Picture this: You’re standing in front of two houses that look identical from the outside. Both are listed at $500,000. But here’s the catch—one comes with a $100,000 mortgage that you’d have to assume, while the other is mortgage-free. Which one would you actually pay less to own outright? The mortgage-free house, of course! This simple analogy captures the essence of Enterprise Value—one of the most important metrics in investing that goes beyond the surface-level stock price to reveal what a company really costs to acquire. Corporatefinanceins
In the world of stock market investing, understanding Enterprise Value can be the difference between making informed decisions and falling into costly traps. Whether you’re analyzing potential investments or trying to understand why the stock market goes up, this metric provides crucial insights that market capitalization alone cannot offer.
TL;DR (Key Takeaway) Summary
- Enterprise Value (EV) represents the true cost of acquiring a company, including its debt obligations, and minus its cash reserves—not just its stock price
- The formula is: EV = Market Cap + Total Debt – Cash and Cash Equivalents, giving investors a complete picture of a company’s valuation
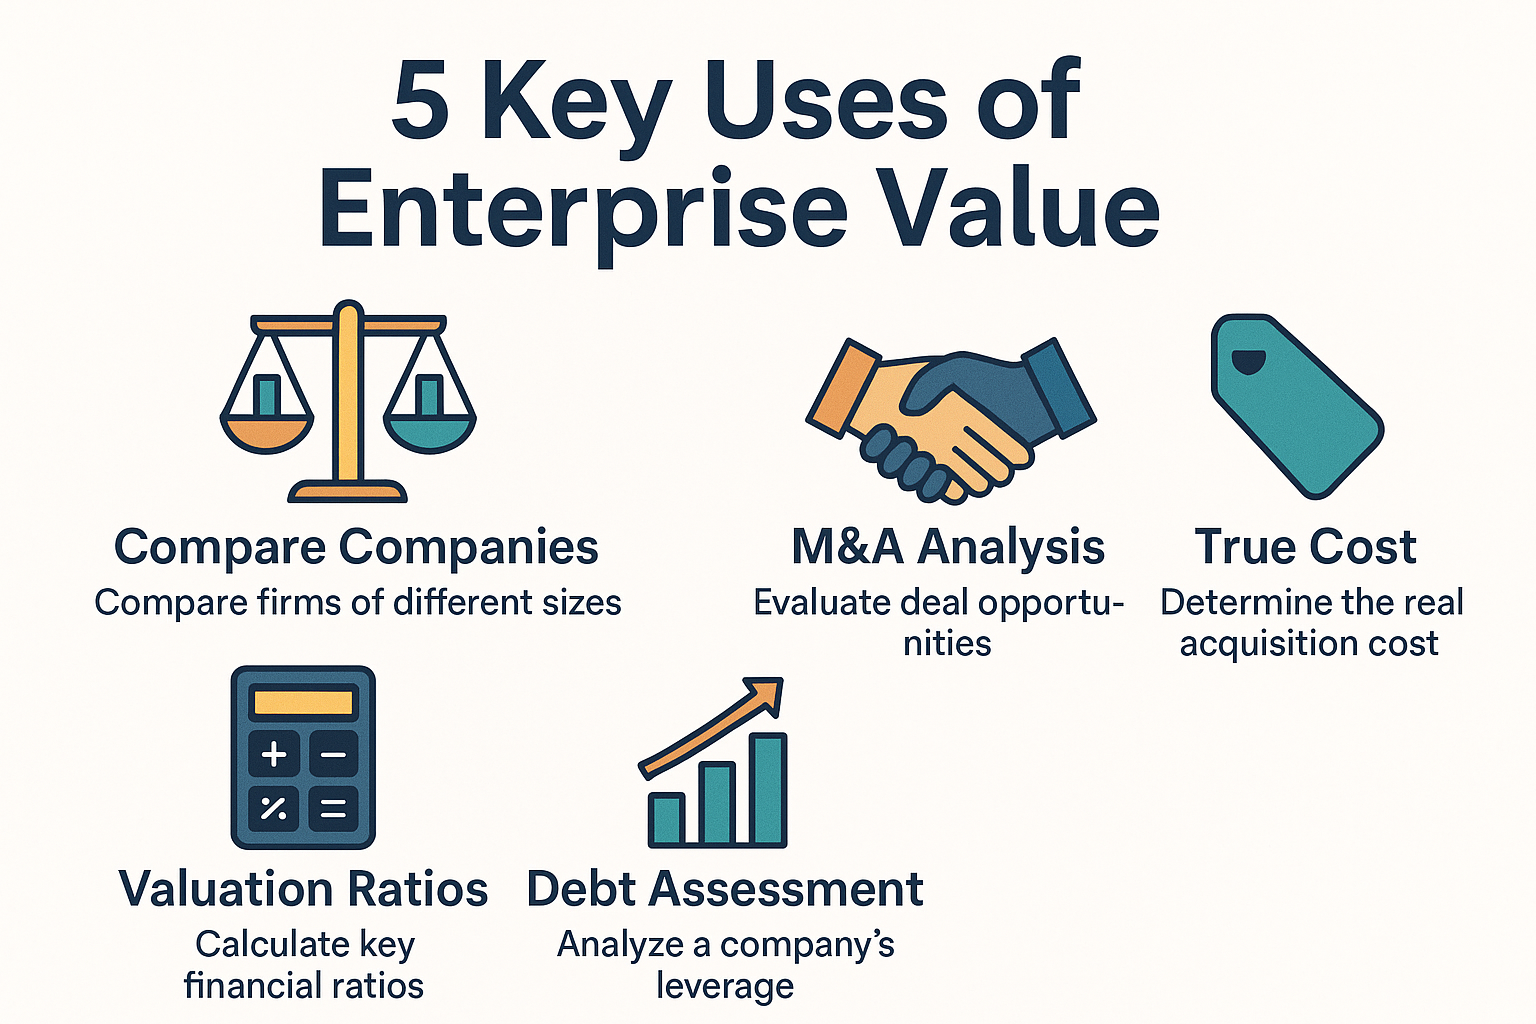
- EV is essential for comparing companies with different capital structures, making it superior to market cap for valuation purposes
- Investors use EV in key ratios like EV/EBITDA and EV/Sales to assess whether a company is overvalued or undervalued
- A negative Enterprise Value (rare) can signal either a distressed company or an exceptional bargain, depending on the circumstances
What Is Enterprise Value? The Complete Definition
In simple terms, Enterprise Value means the total cost to purchase a company outright, including all its debts and obligations, minus the cash you’d get in the deal.
Think of Enterprise Value (EV) as the theoretical takeover price of a business. When one company acquires another, they don’t just pay the market capitalization (stock price × shares outstanding). They also assume all the company’s debts and retain all the cash on the balance sheet. Enterprise Value accounts for all these factors to give you the real acquisition cost. Investopedia
Unlike market capitalization, which only considers equity value, Enterprise Value provides a capital-structure-neutral valuation metric. This makes it incredibly useful when comparing companies that have different levels of debt and cash, which is pretty much every company in existence.
According to the CFA Institute, Enterprise Value is considered one of the foundational metrics for equity valuation and is widely used by professional analysts, investment bankers, and institutional investors worldwide.
The Enterprise Value Formula: Breaking It Down Step by Step
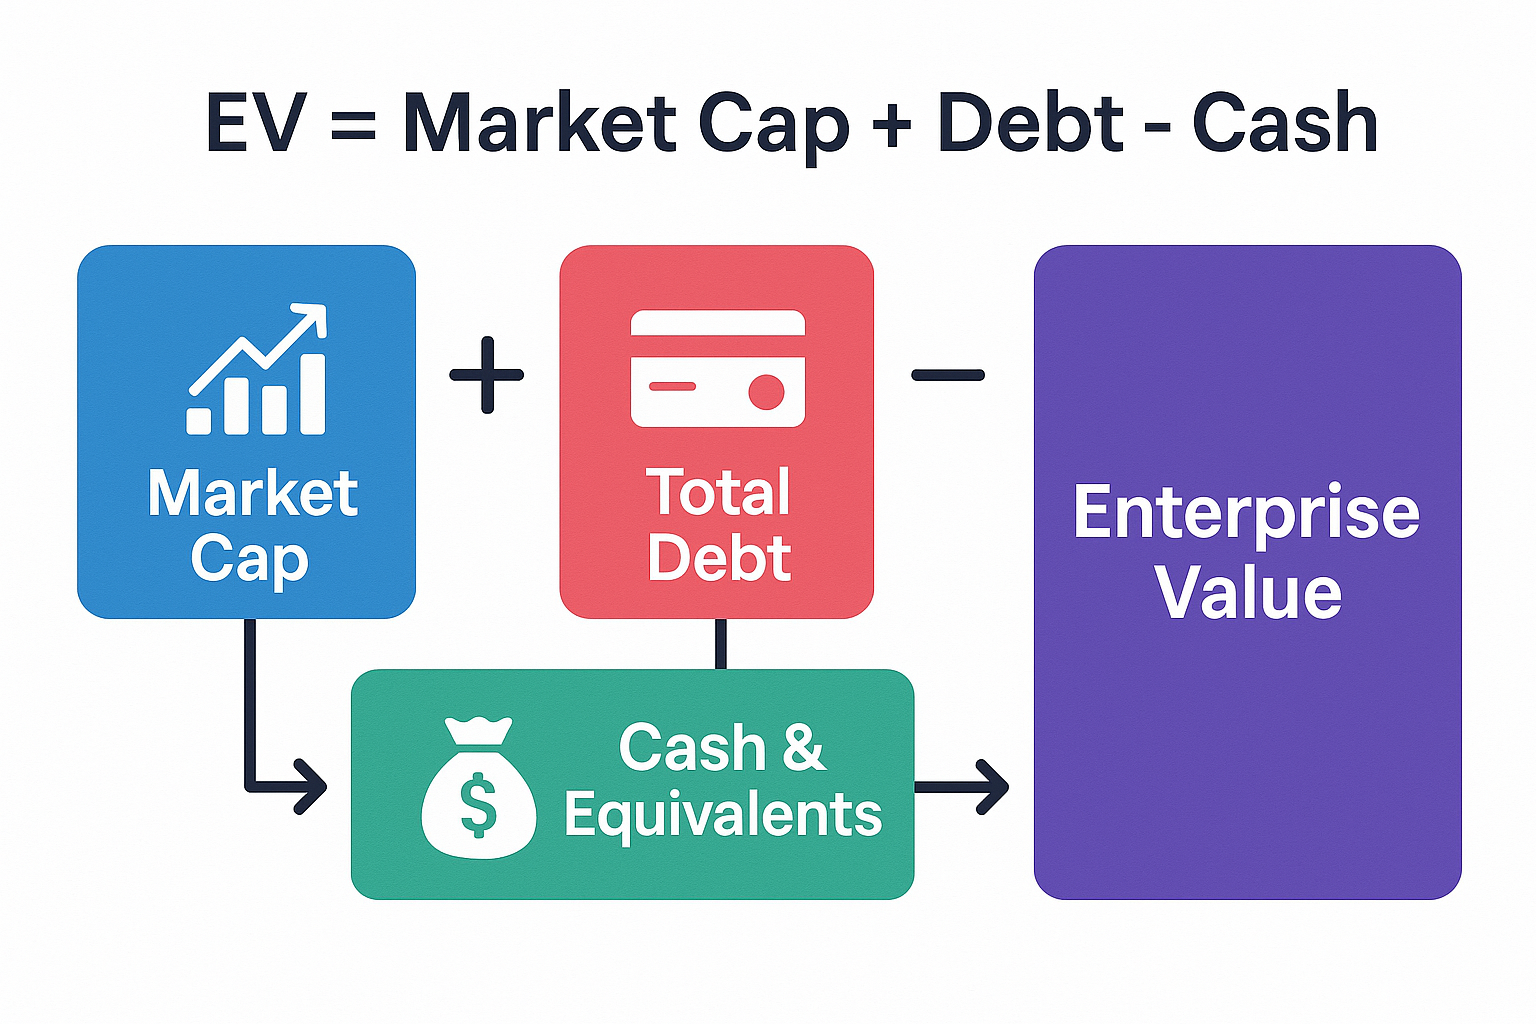
The formula for Enterprise Value is straightforward, but understanding each component is crucial:
EV = Market Capitalization + Total Debt – Cash and Cash Equivalents
Let’s break down each element:
Market Capitalization
Market cap is simply the current stock price multiplied by the total number of outstanding shares. If a company has 10 million shares trading at $50 each, the market cap is $500 million. This represents the cost to buy all the equity.
Total Debt
This includes:
- Short-term debt (due within one year)
- Long-term debt (due after one year)
- Capital leases
- Any other interest-bearing obligations
Why add debt? Because when you acquire a company, you inherit all its debts. You’ll either need to pay them off or continue servicing them.
Cash and Cash Equivalents
This includes:
- Cash in bank accounts
- Short-term investments
- Marketable securities
- Anything that can be quickly converted to cash
Why subtract cash? Because this money comes with the company and can immediately be used to pay down debt or returned to you as the new owner.
Extended Formula (More Comprehensive)
For a more precise calculation, especially for complex companies:
EV = Market Cap + Total Debt + Preferred Equity + Minority Interest – Cash and Cash Equivalents
- Preferred Equity: Preferred shares that have different rights than common stock
- Minority Interest: The portion of subsidiaries not owned by the parent company
Real-World Example: Calculating Enterprise Value
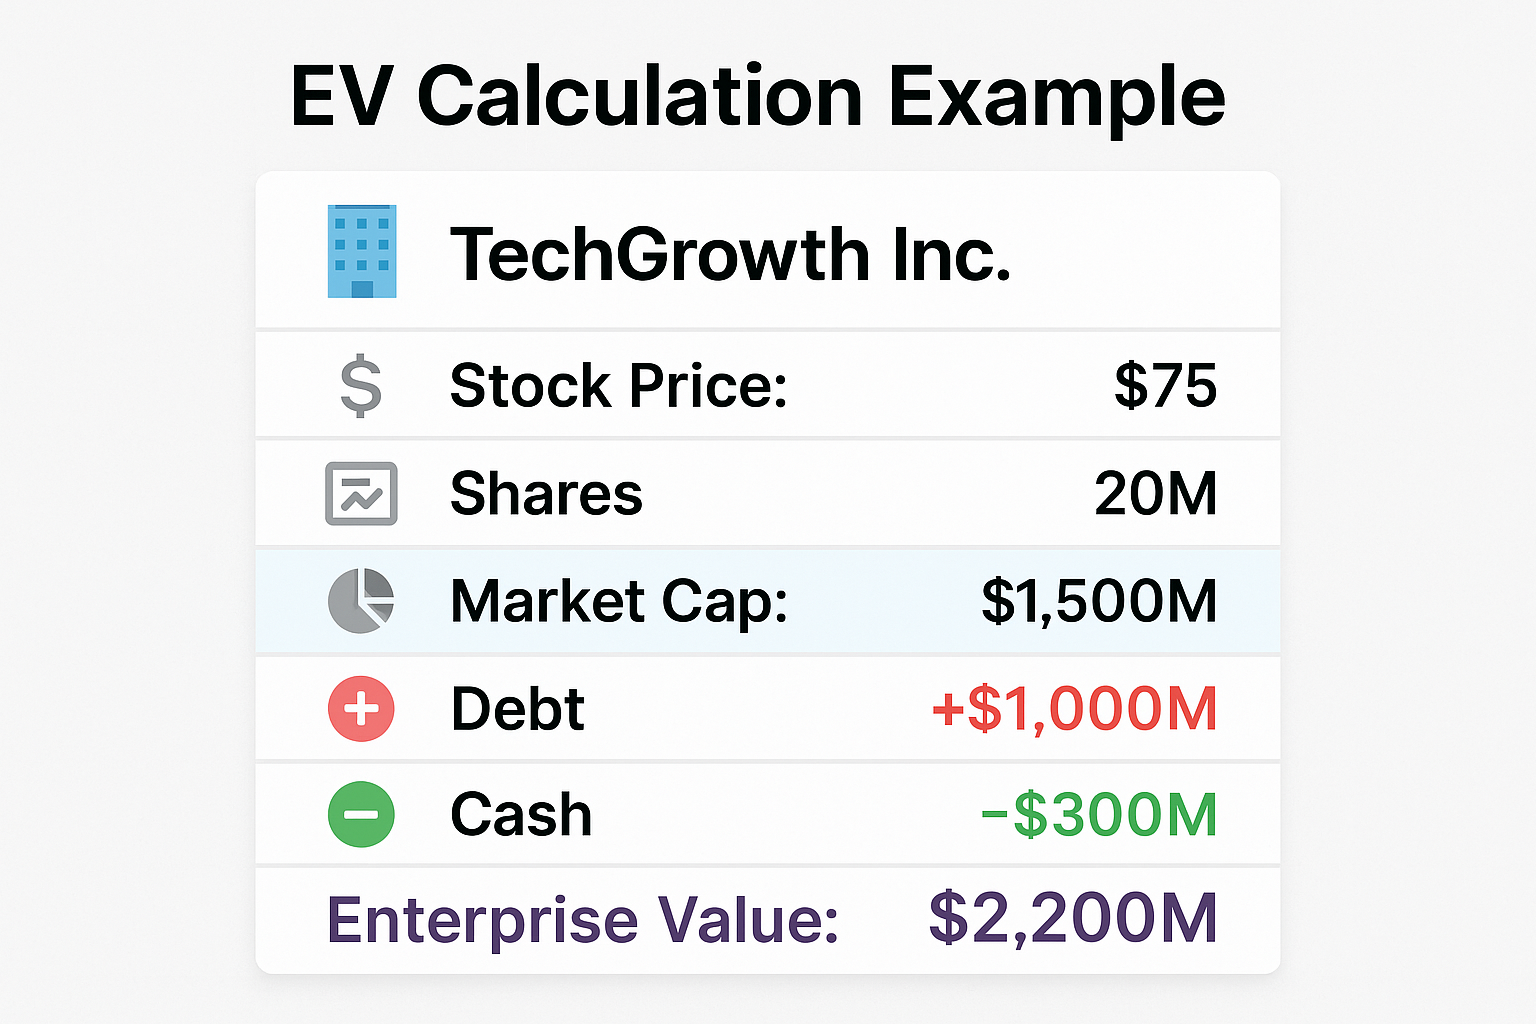
Let’s calculate the Enterprise Value for a fictional company called TechGrowth Inc.:
| Component | Amount |
|---|---|
| Stock Price | $75 |
| Shares Outstanding | 20 million |
| Short-term Debt | $200 million |
| Long-term Debt | $800 million |
| Cash and Equivalents | $300 million |
Step 1: Calculate Market Cap
Market Cap = $75 × 20 million = $1,500 million ($1.5 billion)
Step 2: Calculate Total Debt
Total Debt = $200M + $800M = $1,000 million ($1 billion)
Step 3: Apply the Formula
EV = $1,500M + $1,000M – $300M = $2,200 million ($2.2 billion)
What does this tell us? While TechGrowth’s market cap is $1.5 billion, the true cost to acquire the company is $2.2 billion once you account for the debt you’d assume and the cash you’d receive.
Why Enterprise Value Matters: The Investor’s Perspective
1. Apples-to-Apples Comparisons
When comparing two companies in the same industry, market cap alone can be misleading. Consider these two companies:
Company A:
- Market Cap: $1 billion
- Debt: $0
- Cash: $100 million
- EV: $900 million
Company B:
- Market Cap: $800 million
- Debt: $500 million
- Cash: $50 million
- EV: $1.25 billion
Company B has a lower market cap, but it’s actually more expensive to acquire! Enterprise Value reveals this truth.
2. Better Valuation Ratios
Enterprise Value is used in crucial valuation metrics:
- EV/EBITDA: Compares enterprise value to earnings before interest, taxes, depreciation, and amortization
- EV/Sales: Compares enterprise value to total revenue
- EV/FCF: Compares enterprise value to free cash flow
These ratios are superior to P/E (price-to-earnings) because they account for capital structure differences. According to Morningstar, EV/EBITDA is one of the most reliable valuation multiples for comparing companies across different industries.
3. Merger & Acquisition Insights
In the M&A world, Enterprise Value is the starting point for deal negotiations. Investment bankers use EV to determine:
- Fair acquisition prices
- Takeover premiums
- Whether a deal creates value for shareholders
4. Debt Matters
Enterprise Value forces investors to consider a company’s debt load. Two companies might have the same market cap, but if one is drowning in debt while the other has a fortress balance sheet, they’re fundamentally different investments.
Understanding these nuances can help you avoid common mistakes that cause people to lose money in the stock market.
Enterprise Value vs Market Capitalization: Key Differences
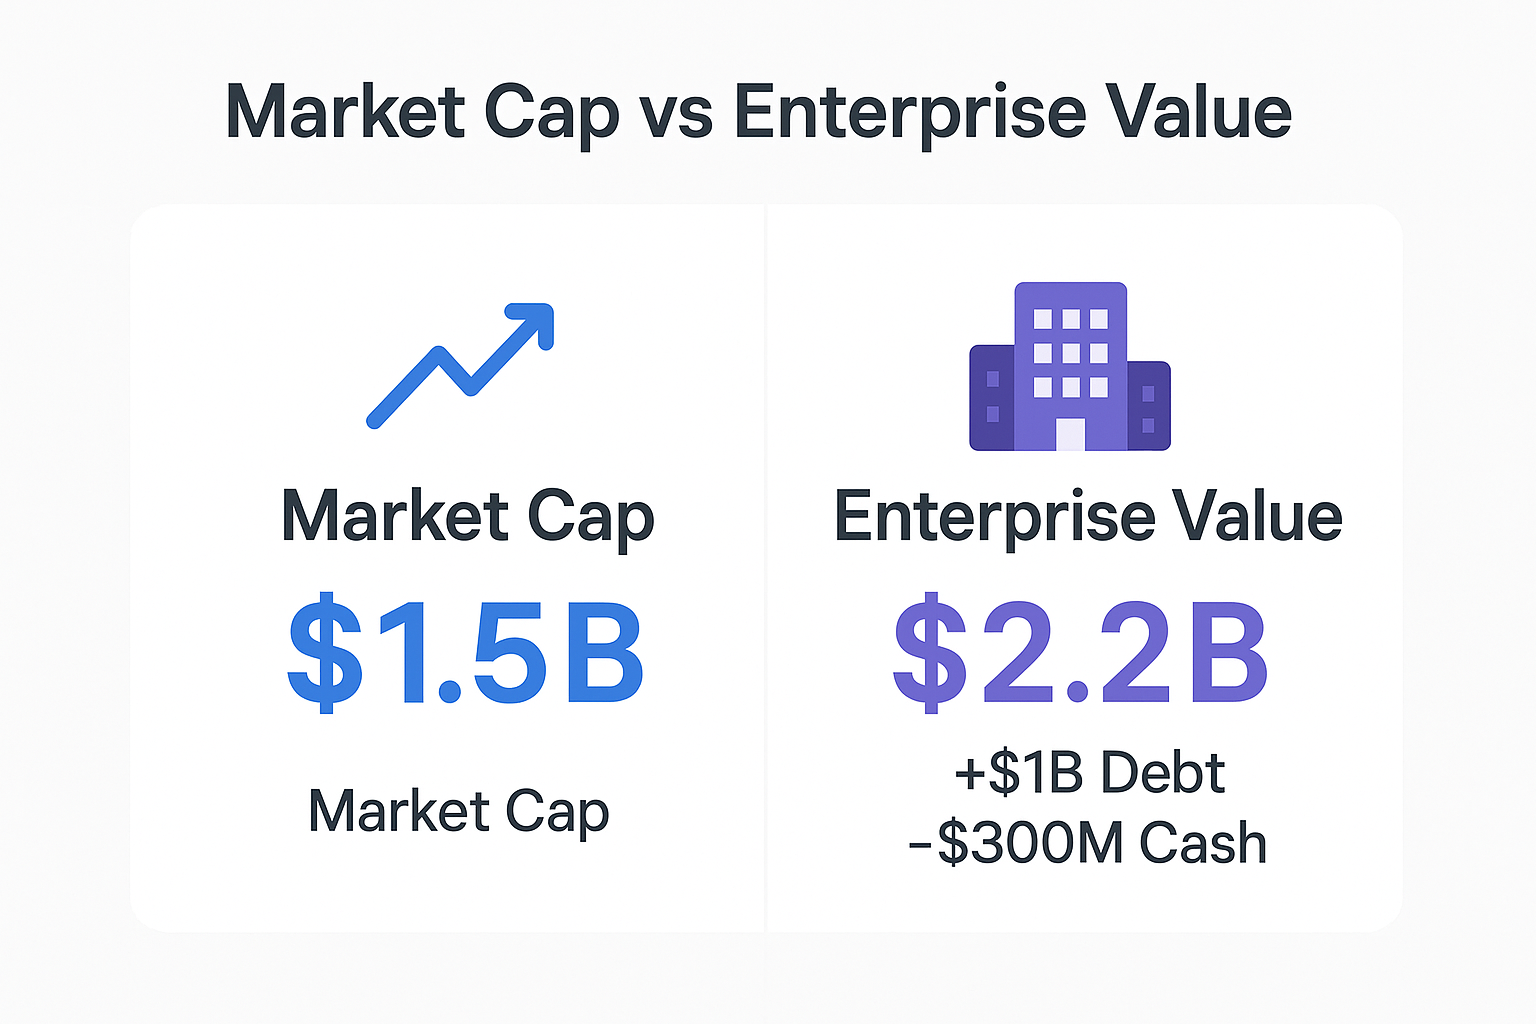
| Aspect | Market Capitalization | Enterprise Value |
|---|---|---|
| What it measures | Equity value only | Total company value |
| Formula | Stock Price × Shares | Market Cap + Debt – Cash |
| Includes debt? | No | Yes |
| Accounts for cash? | No | Yes |
| Best for | Quick size comparison | Accurate valuation |
| Used by | Retail investors | Professional analysts |
| Capital structure neutral? | No | Yes |
Market cap tells you what the equity is worth. Enterprise Value tells you what the whole company is worth. Netsuite.com
How to Interpret Enterprise Value in Your Investment Analysis
What a High Enterprise Value Means
A high EV relative to market cap typically indicates:
- Significant debt burden: The company is leveraged
- Low cash reserves: Not much liquidity on hand
- Higher acquisition cost: More expensive to buy outright
This isn’t necessarily bad; many successful companies use debt strategically. But it does mean higher financial risk.
What a Low Enterprise Value Means
A low EV relative to market cap suggests:
- Strong balance sheet: Little to no debt
- High cash position: Lots of liquidity
- Lower acquisition cost: Cheaper to acquire
This often indicates financial stability and flexibility.
The Rare Case of Negative Enterprise Value
Occasionally, you’ll find a company with a negative Enterprise Value. This happens when:
Cash and Equivalents > Market Cap + Total Debt
This seems like a paradox—you could theoretically buy the company, use its cash to pay off all debts, and still have money left over!
Why does this happen?
- Market pessimism: Investors believe the company will burn through cash
- Distressed situations: Bankruptcy fears
- Temporary market inefficiencies: Sometimes genuine bargains exist
- Hidden liabilities: Pension obligations or lawsuits not reflected in debt
Real-world story: During the 2008 financial crisis, several small-cap companies traded at negative enterprise values. Savvy investors who recognized that some of these were fundamentally sound businesses (not frauds or terminal cases) made extraordinary returns. However, many others were indeed distressed and eventually went bankrupt. Due diligence is essential!
Using Enterprise Value in Valuation Ratios
EV/EBITDA: The Gold Standard
A higher EV/EBITDA usually indicates a more expensive company relative to its operating earnings.
The EV/EBITDA ratio is favored by analysts because:
- It’s not distorted by capital structure (debt vs equity)
- It’s less affected by accounting policies than P/E
- It works for companies with negative net income but positive EBITDA
- It’s ideal for comparing companies across borders with different tax rates
Industry benchmarks (as of 2025):
- Technology: 15-25x
- Consumer staples: 12-18x
- Utilities: 8-12x
- Energy: 6-10x
(Source: S&P Global Market Intelligence)
EV/Sales: For High-Growth Companies
Investors use EV/Sales to measure companies that aren’t yet profitable.
This ratio is particularly useful for:
- Early-stage growth companies
- Biotech firms await FDA approval
- SaaS companies prioritizing growth over profitability
A lower EV/Sales ratio suggests the company is undervalued relative to its revenue generation.
EV/FCF: Cash Generation Focus
The EV/Free Cash Flow ratio shows how much you’re paying for each dollar of cash the company generates. Lower is generally better, indicating you’re getting more cash generation for your investment dollar.
Advantages of Using Enterprise Value
Capital structure neutral: Compare debt-heavy and debt-light companies fairly
More accurate for acquisitions: Reflects true takeover cost
Highlights financial health: Reveals debt burdens hidden by market cap
Better for valuation multiples: Creates more reliable comparison ratios
Industry-standard metric: Used universally by professionals
Accounts for cash: Recognizes that cash adds value
Limitations and Common Mistakes with Enterprise Value
Doesn’t Account for All Liabilities
Enterprise Value typically doesn’t include:
- Pension obligations
- Operating leases (though this changed with new accounting standards)
- Contingent liabilities
- Environmental cleanup costs
Cash Quality Matters
Not all cash is created equal. Some “cash” might be:
- Trapped overseas with repatriation taxes
- Needed for daily operations (working capital)
- Restricted by covenants or regulations
Subtracting all cash equally can overstate the true value.
Doesn’t Reflect Profitability
A company can have a low EV but still be a terrible investment if it’s losing money and burning cash. Always use EV alongside profitability metrics.
Minority Interest Complications
For companies with complex corporate structures, calculating the correct Enterprise Value requires careful attention to minority interests and unconsolidated investments.
Market Timing Issues
Enterprise Value uses current stock prices, which fluctuate daily. The cycle of market emotions can cause EV to swing wildly based on sentiment rather than fundamentals.
Enterprise Value in Different Investment Strategies
Value Investing
Value investors love Enterprise Value because it helps identify undervalued companies. They look for:
- Low EV/EBITDA compared to industry peers
- Negative or very low enterprise values (with strong fundamentals)
- Companies where EV doesn’t reflect true asset value
Warren Buffett’s Berkshire Hathaway has used EV-based analysis for decades, though Buffett himself prefers to think in terms of “owner earnings” and intrinsic value.
Growth Investing
Growth investors use EV differently:
- EV/Sales for pre-profitable companies
- EV growth rate vs. revenue growth rate
- Future EV projections based on market expansion
They’re often willing to pay higher EV multiples for superior growth prospects.
Dividend Investing
For those focused on earning passive income through dividend investing, Enterprise Value helps assess:
- Whether dividend payments are sustainable given debt levels
- If the company has cash to maintain or grow dividends
- How the dividend yield looks relative to EV (not just market cap)
When evaluating high dividend stocks, a company with high debt (high EV relative to market cap) might struggle to maintain dividends during downturns.
Real Company Example: Apple Inc. (Simplified 2024 Data)
Let’s look at a simplified Enterprise Value calculation for Apple:
Apple Inc. (Approximate 2024 figures):
- Market Cap: ~$2,800 billion
- Total Debt: ~$110 billion
- Cash and Equivalents: ~$60 billion
Enterprise Value:
EV = $2,800B + $110B – $60B = $2,850 billion
Key insights:
- Apple’s EV is only slightly higher than its market cap
- The company has substantial debt ($110B) but also huge cash reserves ($60B)
- The net debt position (Debt – Cash = $50B) is relatively small for a company of this size
- This indicates a strong balance sheet with financial flexibility
EV/EBITDA (estimated): ~22x (as of late 2024)
This multiple is reasonable for a company with Apple’s brand strength, ecosystem, and consistent profitability, though it’s higher than the S&P 500 average of ~14x.
(Note: These are simplified figures for educational purposes. Always check current data from sources like SEC.gov or the company’s investor relations page.)
How to Find Enterprise Value Data
You don’t always need to calculate EV manually. Here’s where to find it:
Free Resources:
- Yahoo Finance: Shows EV in the “Statistics” tab
- Google Finance: Basic EV data available
- SEC.gov: EDGAR database for official filings (10-K, 10-Q)
- Company investor relations pages: Often include key metrics
Premium Resources:
- Bloomberg Terminal: Comprehensive data and analysis
- FactSet: Professional-grade financial data
- Morningstar: Detailed valuation metrics and analysis
- S&P Capital IQ: Industry-standard for institutional investors
For smart investors making informed decisions, checking multiple sources helps ensure accuracy.
Enterprise Value and Your Investment Decision-Making Process
Here’s how to incorporate EV into your analysis:
Step 1: Calculate or Find the EV
Get current data from reliable sources.
Step 2: Calculate Relevant Ratios
Compute EV/EBITDA, EV/Sales, or EV/FCF depending on the company type.
Step 3: Compare to Peers
How does this company’s EV multiples stack up against competitors?
Step 4: Analyze the Trend
Is EV growing faster or slower than fundamentals (revenue, EBITDA, cash flow)?
Step 5: Consider the Capital Structure
Is the debt level appropriate for this industry? Is cash being used productively?
Step 6: Integrate with Other Metrics
Never use EV in isolation. Combine with profitability, growth, and quality metrics.
This systematic approach can help you make smarter decisions about passive income opportunities and long-term wealth building.
Key Risks and Red Flags to Watch For
Rapidly Increasing EV Without Revenue Growth
This suggests the market is pricing in expectations that may not materialize.
Negative Enterprise Value with Deteriorating Fundamentals
Could indicate a value trap rather than a bargain.
Very High Debt Relative to Market Cap
The company might be over-leveraged, increasing bankruptcy risk.
Declining Cash Balances
If cash is shrinking while debt grows, financial health is deteriorating.
EV Multiples Far Above Industry Average
The company may be overvalued unless there’s a compelling reason (superior growth, moat, etc.).
Enterprise Value for Different Company Types
Mature, Stable Companies
- Typically have moderate EV/EBITDA (8-15x)
- Stable debt levels
- Consistent cash generation
- EV grows steadily with earnings
High-Growth Tech Companies
- Often have high EV/Sales (5-20x or higher)
- May have negative EBITDA
- EV driven by future expectations
- Cash burn vs. cash generation is crucial
Financial Companies (Banks, Insurance)
- EV is less meaningful due to the nature of their business
- Debt is part of their business model, not a liability in the traditional sense
- Use industry-specific metrics instead (P/B, P/E, ROE)
Cyclical Companies (Energy, Materials)
- EV multiples fluctuate with commodity cycles
- Look at EV through the cycle, not just at peaks or troughs
- Net debt often increases during downturns
Putting It All Together: Your Enterprise Value Action Plan
Now that you understand Enterprise Value, here’s how to use this knowledge:
For Beginners:
- Start checking EV alongside market cap when researching stocks
- Compare EV/EBITDA ratios within the same industry
- Notice the debt levels of companies you’re considering
- Use free tools like Yahoo Finance to access EV data easily
For Intermediate Investors:
- Calculate EV manually for your portfolio holdings
- Track EV trends over time, not just snapshots
- Analyze the capital structure decisions management makes
- Compare EV multiples across your entire portfolio
For Advanced Investors:
- Build valuation models using EV as a foundation
- Assess M&A opportunities using EV frameworks
- Identify market inefficiencies through EV analysis
- Consider adjusted EV calculations for complex situations
Conclusion: Why Enterprise Value Should Be in Your Investing Toolkit
Enterprise Value isn’t just another financial metric—it’s a fundamental lens through which savvy investors view companies. While market capitalization tells you what the stock market thinks the equity is worth, Enterprise Value reveals what someone would actually pay to own the entire business.
Throughout this guide, we’ve seen how EV:
- Provides a more accurate picture of company valuation
- Enables fair comparisons between companies with different capital structures
- Forms the foundation for critical valuation ratios
- Helps identify both opportunities and red flags
- Reflects the true cost of acquiring a business
Whether you’re building wealth through dividend investing, analyzing stock market opportunities, or planning to make your kids millionaires through smart investing, understanding Enterprise Value will make you a more informed, confident investor.
Your next steps:
- Pull up the financial data for three companies you’re interested in
- Calculate their Enterprise Values manually
- Compare their EV/EBITDA ratios to industry averages
- Notice how this changes your perspective on which is “expensive” or “cheap”
- Incorporate EV analysis into your regular investment research routine
Remember, no single metric tells the whole story. Enterprise Value is powerful, but it works best when combined with analysis of profitability, growth prospects, competitive positioning, and management quality. Use it as one important tool in your comprehensive investment analysis toolkit.
The companies with the most attractive stock prices aren’t always the best values—and Enterprise Value helps you see the difference. Start using it today, and you’ll be thinking like the professionals who manage billions of dollars.
For more insights on building wealth through informed investing decisions, explore our comprehensive investing guides and continue your financial education journey.
💼 Enterprise Value Calculator
Calculate the true acquisition cost of any company
It shows the total value of a company, including debt and minus cash, making it the best measure of acquisition cost.
Not always. Companies with large cash reserves may have an EV lower than the market cap.
Book value is based on accounting records, while EV reflects market pricing and financial structure.
EV is most useful in M&A deals, private equity, and when comparing companies with different leverage.
It measures a company’s value against earnings before interest, taxes, depreciation, and amortization. Widely used because it neutralizes financing differences.
Yes — if a company has more cash than debt, EV can be negative (rare but possible, especially in cash-rich tech firms).
Equity value = Market cap. EV = Equity value + Debt – Cash. EV gives the broader picture
For private firms, EV must be estimated using comparable multiples, since no public market cap exists.
Disclaimer
This article is for educational purposes only and does not constitute financial advice. Enterprise Value calculations and investment decisions should be made after thorough research and, when appropriate, consultation with qualified financial professionals. Past performance does not guarantee future results. Always conduct your own due diligence before making investment decisions.
About the Author
Written by Max Fonji — With over a decade of experience in financial analysis and investment education, Max is your go-to source for clear, data-backed investing insights. As the founder of TheRichGuyMath.com, Max has helped thousands of investors understand complex financial concepts and make smarter investment decisions. His approach combines rigorous analysis with accessible explanations, making advanced investing strategies available to everyone.


