Picture two investors sitting across from each other. One owns a house worth $500,000 with a $200,000 mortgage. The other owns 1,000 shares of stock trading at $50 per share. Despite their different investments, both are asking the same fundamental question: “What do I actually own?”
Equity represents the portion of an asset that belongs entirely to you, the true ownership value after subtracting what you owe. It’s the mathematical difference between what something is worth and what you still owe on it. This single concept forms the foundation of personal finance, corporate valuation, and wealth building across every asset class.
Understanding equity transforms how you view money. Instead of seeing just prices and balances, you start recognizing actual ownership and real net worth. This shift in perspective, from gross values to net ownership, separates those who build lasting wealth from those who merely accumulate debt-laden assets.
Key Takeaways
- Equity equals ownership value: The mathematical difference between an asset’s current market value and any outstanding debts against it
- Three primary equity types exist: Home equity (real estate), shareholder equity (business ownership), and brand equity (intangible value)
- Equity builds wealth systematically: As you pay down debt and assets appreciate, your equity grows through compound effects
- Equity appears on balance sheets: Found in the fundamental accounting equation: Assets – Liabilities = Equity
- Equity provides financial leverage: Higher equity increases borrowing capacity and reduces risk exposure
Understanding Equity: The Core Definition
Equity represents the residual claim on assets after deducting all liabilities. In plain English, it’s what you truly own once you’ve paid off what you owe.
The math behind equity is straightforward:
Equity = Total Assets – Total Liabilities
This formula applies universally, whether you’re calculating personal net worth, corporate shareholder value, or real estate ownership. The principle remains constant: true ownership equals value minus debt.
Why Equity Matters for Wealth Building
Equity serves as the primary measure of actual wealth accumulation. A person might own a $1 million home, but if they owe $900,000 on the mortgage, their real estate equity is only $100,000. The gross asset value creates an illusion of wealth; the net equity reveals the truth.
Financial institutions understand this distinction. When evaluating creditworthiness, lenders examine equity positions because equity represents:
- Real financial cushion: The buffer protecting lenders if asset values decline
- Commitment level: Higher equity indicates greater financial stake and lower default risk
- Wealth accumulation progress: Growing equity demonstrates successful wealth building over time
Research from the Federal Reserve shows that household equity in real estate and financial assets comprises approximately 70% of total net worth for middle-income Americans. This data underscores equity’s central role in personal financial health.
The Accounting Foundation
The accounting equation provides the structural framework for understanding equity:
Assets = Liabilities + Equity
Rearranging this equation gives us:
Equity = Assets – Liabilities
This relationship appears on every balance sheet across every industry. The balance sheet’s right side (liabilities and equity) must always equal the left side (assets), hence the term “balance.”
For corporations, this equity section includes:
- Common stock (par value)
- Additional paid-in capital
- Retained earnings
- Treasury stock (negative equity)
- Accumulated other comprehensive income
Each component tells part of the story about how equity was created through investor contributions, profitable operations, or market value changes.
Types of Equity: Where Ownership Takes Form
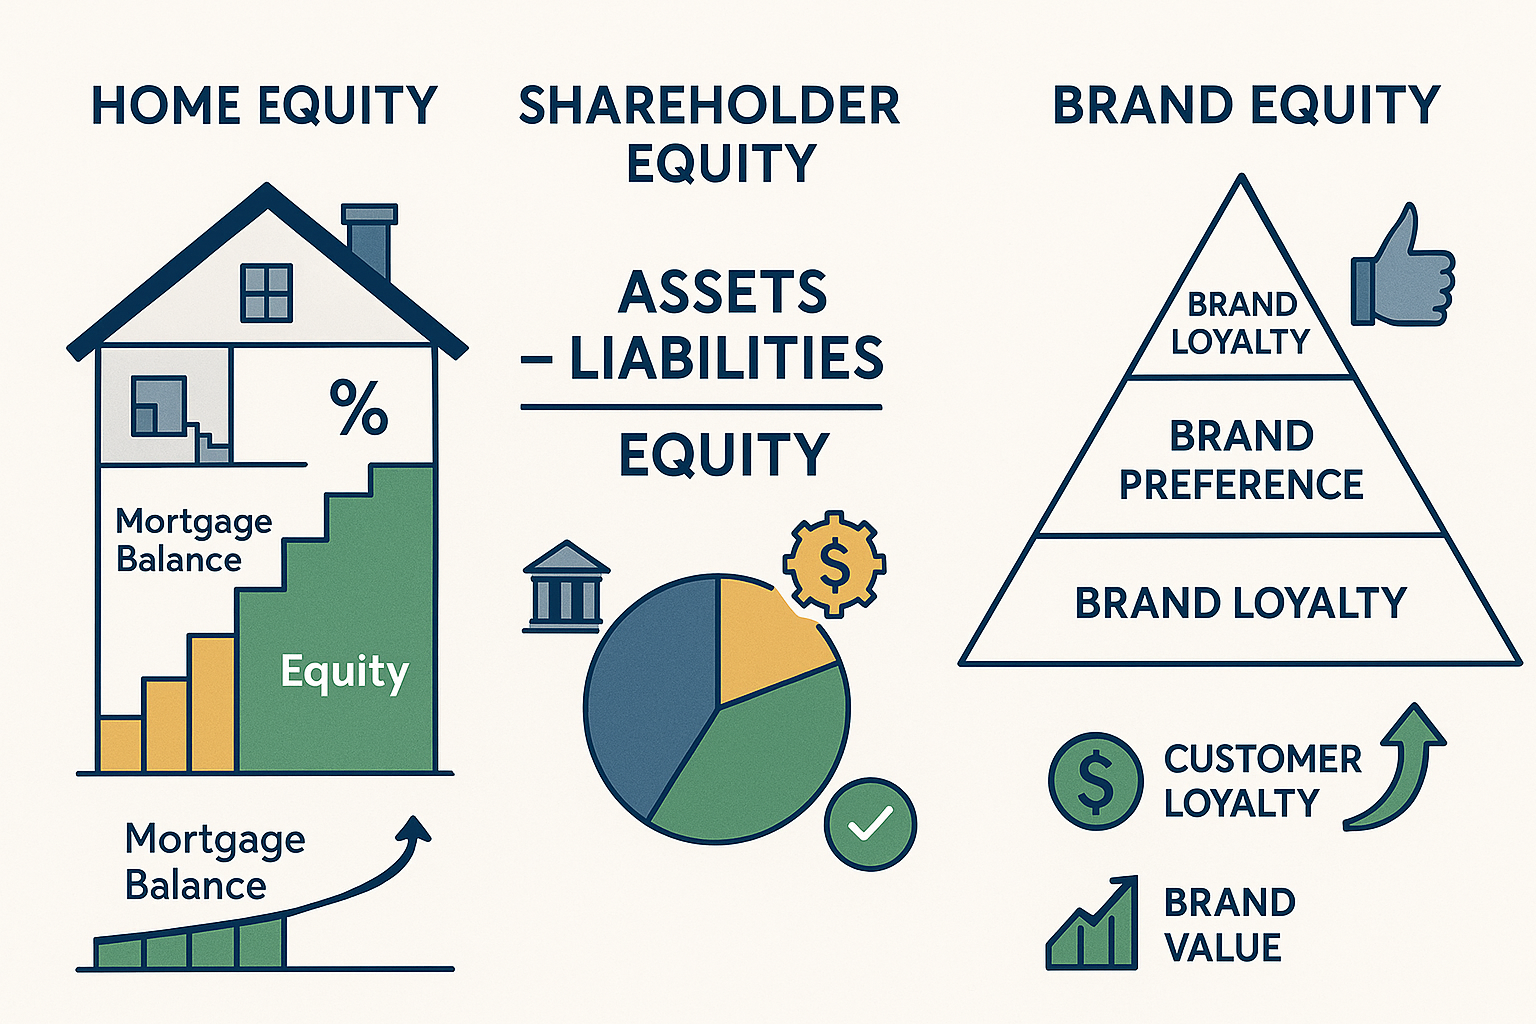
Equity manifests in distinct forms across different asset classes. Each type follows the same mathematical principle but applies to different contexts.
Home Equity: Real Estate Ownership
Home equity represents the portion of a property’s value that the homeowner actually owns. As the mortgage principal decreases and property values increase, home equity grows.
Calculation Example:
Current home value: $450,000
Outstanding mortgage balance: $280,000
Home equity: $170,000
This $170,000 represents real ownership. If the homeowner sold the property, paid off the mortgage, and covered closing costs, this equity would convert to liquid cash (minus transaction fees).
Home equity builds through two mechanisms:
- Principal paydown: Each mortgage payment reduces the loan balance, increasing equity
- Property appreciation: Market value increases, directly boosts equity
The combination creates a compound effect. A homeowner making regular payments while property values rise experiences accelerated equity growth. This explains why real estate has historically served as a primary wealth-building vehicle for American households.
According to the Federal Housing Finance Agency, U.S. home prices appreciated an average of 4.2% annually from 1991 to 2024. Combined with mortgage amortization, this appreciation rate enabled millions of homeowners to build substantial equity over decades.
Shareholder Equity: Business Ownership
Shareholder equity (also called stockholders’ equity or owners’ equity) represents the net value belonging to a company’s shareholders. This appears on corporate balance sheets as the difference between total assets and total liabilities.
Corporate Equity Components:
| Component | Definition | Example |
|---|---|---|
| Common Stock | Par value of issued shares | $1,000,000 |
| Additional Paid-In Capital | Amount received above par value | $15,000,000 |
| Retained Earnings | Cumulative profits reinvested | $8,500,000 |
| Treasury Stock | Repurchased shares (negative) | -$2,000,000 |
| Total Shareholder Equity | Sum of all components | $22,500,000 |
Shareholder equity increases when:
- The company generates accounting profit and retains earnings
- Investors purchase newly issued shares at premium prices
- Asset values increase (through revaluation or acquisition)
Conversely, equity decreases when companies experience losses, pay dividends, or repurchase shares.
For investors, shareholder equity per share provides a baseline valuation metric. The book value per share equals total shareholder equity divided by outstanding shares:
Book Value Per Share = Total Shareholder Equity ÷ Shares Outstanding
If a company has $22,500,000 in equity and 5,000,000 shares outstanding, the book value per share equals $4.50. This represents the theoretical value each share would receive if the company liquidated all assets at book value and paid all liabilities.
Brand Equity: Intangible Value
Brand equity represents the intangible value a brand name adds beyond the physical assets and operations. This form of equity doesn’t appear directly on traditional balance sheets but significantly impacts market valuation.
Strong brand equity creates:
- Price premiums: Customers pay more for recognized brands
- Customer loyalty: Repeat purchases and reduced acquisition costs
- Market share protection: Competitive moats against new entrants
- Extension opportunities: Ability to launch new products under established brand
Consider Apple Inc. The company’s market capitalization regularly exceeds its book value by hundreds of billions of dollars. This difference largely reflects brand equity—the intangible value customers place on the Apple brand, ecosystem, and experience.
Quantifying brand equity requires specialized valuation methods:
- Cost approach: Estimating replacement cost of building equivalent brand recognition
- Market approach: Comparing to similar brand transactions and licensing deals
- Income approach: Calculating present value of future cash flows attributable to brand strength
Interbrand, a leading brand valuation consultancy, estimated Apple’s brand value at $502 billion in 2024 [3]. This brand equity represents real economic value, even though it doesn’t appear as a line item on Apple’s balance sheet.
Private Equity: Investment Ownership
Private equity refers to ownership stakes in companies not publicly traded on stock exchanges. Private equity firms raise capital from investors, purchase companies (or portions thereof), improve operations, and eventually sell for profit.
The equity structure in private equity transactions includes:
- Sponsor equity: Capital contributed by the private equity firm
- Management equity: Ownership stakes granted to company executives
- Preferred equity: Priority claims with fixed returns
- Common equity: Residual ownership after preferred claims
Private equity investments typically target absolute returns of 20-25% annually, achieved through operational improvements, financial engineering, and multiple expansion.
How Equity Works: The Mechanics of Ownership
Understanding how equity functions requires examining the mathematical relationships between assets, liabilities, and ownership value.
The Balance Sheet Relationship
Every financial position—personal or corporate—can be expressed through the fundamental equation:
Assets = Liabilities + Equity
This equation must always balance. When assets increase, either liabilities must increase, equity must increase, or both must change in offsetting amounts.
Example Transaction Analysis:
Initial Position:
Assets: $100,000
Liabilities: $60,000
Equity: $40,000
Transaction: Purchase $20,000 equipment with $5,000 cash and $15,000 loan
New Position:
Assets: $115,000 ($100,000 – $5,000 + $20,000)
Liabilities: $75,000 ($60,000 + $15,000)
Equity: $40,000 (unchanged)
The equation remains balanced: $115,000 = $75,000 + $40,000
This mechanical relationship governs every financial transaction. Understanding it enables accurate tracking of how decisions affect true ownership value.
Equity Growth Mechanisms
Equity increases through four primary mechanisms:
1. Asset Appreciation
When asset values rise while liabilities remain constant, equity automatically increases. A home purchased for $300,000 that appreciates to $400,000 creates $100,000 in additional equity (assuming no new debt).
2. Liability Reduction
Paying down debt while maintaining asset values increases equity. Each mortgage payment that reduces principal adds to home equity, even if property values remain flat.
3. Profit Retention
For businesses, retained earnings directly increase shareholder equity. A company generating $1,000,000 in net income that retains $700,000 (paying $300,000 in dividends) increases equity by $700,000.
4. Capital Contributions
New investments increase equity. When shareholders inject additional capital or homeowners make property improvements with cash, equity rises by the contribution amount.
Leverage and Equity Risk
Leverage—using debt to acquire assets—creates a mathematical amplification effect on equity returns. This amplification works in both directions, magnifying gains and losses.
Leverage Example:
Scenario A: All-Cash Purchase
Property cost: $200,000
Equity invested: $200,000
Property appreciates to: $240,000
Equity gain: $40,000
Return on equity: 20% ($40,000 ÷ $200,000)
Scenario B: Leveraged Purchase
Property cost: $200,000
Equity invested: $40,000
Mortgage: $160,000
Property appreciates to: $240,000
Equity value: $80,000 ($240,000 – $160,000)
Equity gain: $40,000 ($80,000 – $40,000)
Return on equity: 100% ($40,000 ÷ $40,000)
The leveraged purchase generated a 100% return on equity versus 20% for the all-cash purchase, a 5x amplification. However, this leverage also amplifies downside risk.
If the property declined to $180,000:
Scenario A (All-Cash):
Loss: $20,000
Return: -10% ($20,000 ÷ $200,000)
Scenario B (Leveraged):
Equity value: $20,000 ($180,000 – $160,000)
Loss: $20,000 ($40,000 – $20,000)
Return: -50% ($20,000 ÷ $40,000)
The same $20,000 loss represents -10% for the unleveraged position but -50% for the leveraged position. This mathematical relationship explains why highly leveraged positions carry greater risk.
Understanding the debt-to-equity ratio helps investors assess leverage levels and associated risks.
Calculating Equity: Practical Examples
Applying equity calculations to real scenarios demonstrates how the concept works across different contexts.
Personal Home Equity Calculation
Situation: Sarah purchased a home in 2020 for $350,000 with a $280,000 mortgage (20% down payment). By 2025, she will have paid the mortgage balance down to $255,000, and comparable homes in her neighborhood are selling for $425,000.
Calculation:
Current market value: $425,000
Outstanding mortgage: $255,000
Current home equity: $170,000
Original equity (2020): $70,000 ($350,000 – $280,000)
Equity increase: $100,000
Total return on original equity: 143% ($100,000 ÷ $70,000)
Sarah’s equity grew through two channels:
- Appreciation: $75,000 ($425,000 – $350,000)
- Principal paydown: $25,000 ($280,000 – $255,000)
This example illustrates how homeowners following the 3x rent rule and making consistent payments build wealth through equity accumulation.
Business Shareholder Equity Calculation
Situation: TechStart Inc. shows the following on its balance sheet:
- Total assets: $5,000,000
- Accounts payable: $400,000
- Long-term debt: $1,800,000
- Other liabilities: $200,000
Calculation:
Total liabilities: $2,400,000 ($400,000 + $1,800,000 + $200,000)
Total assets: $5,000,000
Shareholder equity: $2,600,000
With 1,000,000 shares outstanding:
Book value per share: $2.60 ($2,600,000 ÷ 1,000,000)
If TechStart’s shares trade at $15.00, the market values the company at 5.77x book value ($15.00 ÷ $2.60). This premium reflects investor expectations of future profitability and growth.
Stock Portfolio Equity Calculation
Situation: James maintains a margin account with the following positions:
- Stock portfolio market value: $125,000
- Margin loan balance: $35,000
- Cash balance: $5,000
Calculation:
Total account value: $130,000 ($125,000 + $5,000)
Margin debt: $35,000
Account equity: $95,000
James’s equity represents 73% of his total account value ($95,000 ÷ $130,000). Most brokerages require minimum equity levels (typically 25-30% for margin accounts). James maintains a comfortable cushion above these requirements.
If his portfolio declined by 20% to $100,000:
New total value: $105,000 ($100,000 + $5,000)
Margin debt: $35,000 (unchanged)
New equity: $70,000
Equity percentage: 67% ($70,000 ÷ $105,000)
Despite a 20% portfolio decline, James would still meet margin requirements because his equity percentage remains above 30%. This demonstrates how maintaining lower leverage protects against margin calls during market downturns.
Understanding these calculations helps investors apply principles similar to dollar cost averaging to systematically build equity positions over time.
Equity vs Other Financial Concepts
Distinguishing equity from related financial terms clarifies its unique role in wealth measurement.
Equity vs. Assets
Assets represent everything of value you own. Equity represents the portion you own free and clear after subtracting debts.
A $500,000 home is an asset. If you owe $300,000 on the mortgage, your equity is $200,000. The asset value measures gross ownership; the equity value measures net ownership.
This distinction matters for financial planning. High asset values with corresponding high liabilities don’t necessarily indicate wealth. Net equity provides an accurate measure.
Equity vs Cash
Cash represents liquid funds available for immediate use. Equity represents ownership value that may or may not be liquid.
Home equity, for example, isn’t accessible without selling the property or borrowing against it. Shareholder equity in a private company can’t be converted to cash without finding a buyer.
Cash provides liquidity and flexibility. Equity provides ownership and potential appreciation. Balanced financial planning requires both liquid emergency funds and equity-building investments.
Equity vs. Net Worth
Net worth equals total assets minus total liabilities—essentially the sum of all equity positions across all assets.
Net worth = Home equity + Investment equity + Business equity + Other assets – Other liabilities
Net worth provides a comprehensive snapshot of total financial position. Individual equity values show the breakdown by asset category.
Tracking net worth over time reveals whether financial decisions are building or eroding wealth. According to Federal Reserve data, median household net worth in the United States reached $192,900 in 2022, up from $97,300 in 2013. This growth primarily resulted from home equity appreciation and stock market gains.
Equity vs. Return on Equity
Return on Equity (ROE) measures profitability relative to shareholder equity:
ROE = Net Income ÷ Shareholder Equity
While equity represents a static ownership value, ROE measures the efficiency of equity deployment. A company with $1,000,000 in equity generating $150,000 in annual profit achieves a 15% ROE.
Investors use ROE to compare how effectively different companies convert equity into profits. Higher ROE generally indicates superior capital efficiency, though extremely high return on equity (ROE) sometimes signals excessive leverage.
Understanding the relationship between equity and returns helps investors evaluate whether companies are generating adequate expected returns on shareholder capital.
Building Equity: Strategic Approaches
Growing equity requires intentional strategies that either increase asset values, decrease liabilities or both.
Systematic Debt Reduction
Every dollar of principal repayment directly increases equity. Creating a systematic debt reduction plan accelerates equity growth.
Debt Reduction Strategies:
- Debt avalanche method: Pay minimums on all debts, then apply extra payments to the highest-interest debt first
- Debt snowball method: Pay minimums on all debts, then apply extra payments to the smallest balance first
- Bi-weekly payments: Making half-payments every two weeks results in 13 full payments annually instead of 12
- Refinancing: Lowering interest rates reduces total interest paid and accelerates principal paydown
For mortgage holders, even modest additional principal payments create substantial long-term equity gains through reduced interest.
Example: A $300,000 mortgage at 6% interest with a 30-year term requires monthly payments of $1,799. Adding just $200 monthly to principal:
- Saves $64,000 in total interest
- Pays off the mortgage 6 years earlier
- Builds equity $200 faster each month, plus interest savings
This approach aligns with the 50/30/20 rule budgeting framework, where debt repayment falls within the 20% savings and debt reduction category.
Asset Appreciation Strategies
While debt reduction provides guaranteed equity growth, asset appreciation offers potentially higher returns with corresponding risk.
Real Estate Appreciation:
- Location selection: Properties in high-growth areas appreciate faster
- Property improvements: Strategic renovations increase market value
- Market timing: Purchasing during market downturns maximizes appreciation potential
Stock Portfolio Appreciation:
- Diversification: Spreading investments across sectors and asset classes reduces risk
- Long-term holding: Time in market beats timing the market for most investors
- Dividend reinvestment: Automatically purchasing additional shares compounds growth
Historical data show the S&P 500 has delivered average annual returns of approximately 10% since 1926. While past performance doesn’t guarantee future results, long-term equity market participation has consistently built wealth for patient investors.
Capital Contribution Methods
Adding new capital increases equity directly. For businesses, this means issuing new shares or retaining earnings. For individuals, this means saving and investing.
Personal Capital Building:
- Automated savings: Directing a percentage of income to investments before discretionary spending
- Employer match maximization: Contributing enough to retirement accounts to capture full employer matches
- Tax-advantaged accounts: Using IRAs, 401(k)s, and HSAs to build equity with tax benefits
A 25-year-old contributing $500 monthly to a retirement account earning 8% annually would accumulate approximately $1,900,000 by age 65. This demonstrates the power of systematic capital contribution combined with compound growth.
Leverage Optimization
Strategic leverage can accelerate equity building when used prudently. The key is maintaining sustainable debt levels that amplify returns without creating excessive risk.
Optimal Leverage Principles:
- Borrow at rates below expected returns: If investment returns exceed borrowing costs, leverage adds value
- Maintain adequate equity cushion: Higher equity percentages protect during downturns
- Match debt duration to asset life: Long-term assets justify long-term financing
- Stress test scenarios: Ensure the ability to service debt even if income decreases or asset values decline
The equity ratio, total equity divided by total assets, provides a quick measure of leverage levels. Higher ratios indicate lower leverage and reduced risk.
Equity in Different Contexts
Equity principles apply across various financial domains, each with unique characteristics.
Equity in Retirement Planning
Retirement security depends heavily on accumulated equity across multiple asset classes. The traditional three-legged retirement stool consists of:
- Social Security: Government-provided income
- Pension/employer plans: Employer-sponsored retirement benefits
- Personal savings: Individual equity accumulated through investments
Modern retirement planning increasingly emphasizes the third leg, personal equity building through retirement accounts and investments.
The 4% rule provides a framework for retirement withdrawal planning. This guideline suggests retirees can withdraw 4% of their portfolio equity annually with minimal risk of depleting funds over a 30-year retirement.
Example: A retiree with $1,000,000 in investment equity could withdraw $40,000 annually (4%) while maintaining a high probability of portfolio sustainability.
This approach requires building substantial equity before retirement, emphasizing the importance of early and consistent saving.
Equity in Business Valuation
Business valuation heavily relies on equity analysis. Multiple valuation methods incorporate equity:
Book Value Method:
Values business at shareholder equity on the balance sheet. Simple but often understates value for profitable, growing companies.
Adjusted Book Value:
Adjusts balance sheet equity to reflect current market values of assets and liabilities. More accurate than the straight book value.
Earnings Multiple Method:
Values business as multiple of earnings, then subtracts debt to arrive at equity value. Common in private business sales.
Discounted Cash Flow (DCF):
Calculates the present value of future cash flows, then subtracts debt to determine equity value. Theoretically sound but requires accurate projections.
Understanding these methods helps business owners and investors assess whether equity positions are fairly valued.
Equity in Real Estate Investment
Real estate investors focus intensely on equity building because property equity provides:
- Refinancing capacity: Higher equity enables cash-out refinancing for new investments
- Borrowing power: Equity in existing properties can secure loans for additional purchases
- Risk buffer: Substantial equity protects against market downturns
- Wealth accumulation: Equity growth through appreciation and amortization builds net worth
Successful real estate investors often follow a systematic approach:
- Purchase property with appropriate leverage (typically 20-25% down)
- Hold property while tenants pay down the mortgage
- Benefit from property appreciation
- Refinance to extract equity when values increase
- Use extracted equity to purchase additional properties
- Repeat the cycle
This strategy, sometimes called “BRRRR” (Buy, Rehab, Rent, Refinance, Repeat), systematically builds equity across a growing portfolio.
Equity Compensation for Employees
Many companies offer equity compensation to employees, aligning worker interests with shareholder interests. Common equity compensation forms include:
Stock Options:
The right to purchase company stock at predetermined prices. Options gain value as stock prices exceed the strike price.
Restricted Stock Units (RSUs):
Grants of company stock that vest over time. Employees receive actual shares once vesting requirements are met.
Employee Stock Purchase Plans (ESPPs):
Programs allowing employees to purchase company stock at discounted prices, typically through payroll deductions.
Performance Shares:
Stock grants contingent on achieving specific performance targets.
Equity compensation can significantly enhance total compensation, particularly at high-growth companies. However, it also concentrates risk; if the company struggles, both employment and investment value decline simultaneously.
Financial advisors typically recommend diversifying away from employer stock once vesting occurs, maintaining no more than 10-15% of the total investment portfolio in any single company.
Common Equity Mistakes to Avoid
Understanding equity pitfalls helps investors protect and grow ownership value.
Mistake #1: Confusing Gross Value with Net Equity
Many people overestimate wealth by focusing on asset values while ignoring corresponding liabilities. A $2 million home with a $1.8 million mortgage provides only $200,000 in equity, not $2 million in wealth.
Solution: Always calculate net equity (assets minus liabilities) when assessing financial position.
Mistake #2: Excessive Leverage
While leverage can accelerate returns, excessive debt creates vulnerability to market downturns and income disruptions.
During the 2008 financial crisis, homeowners with minimal equity faced foreclosure when property values declined below mortgage balances. Those with substantial equity weathered the storm despite temporary value decreases.
Solution: Maintain adequate equity cushions. For homes, target at least 20% equity. For investment portfolios, keep margin debt below 30% of total value.
Mistake #3: Neglecting Equity Diversification
Concentrating equity in a single asset class or individual investment creates unnecessary risk. If that asset declines significantly, total net worth suffers disproportionately.
Solution: Diversify equity across multiple asset classes, real estate, stocks, bonds, and potentially alternative investments. Within stock portfolios, diversify across sectors and geographies using index funds or ETFs.
Mistake #4: Ignoring Tax Implications
Equity transactions often trigger tax consequences. Selling appreciated assets generates capital gains taxes. Withdrawing equity through refinancing doesn’t trigger taxes but increases debt service.
Solution: Understand capital gains tax implications before making equity decisions. Consider tax-loss harvesting, 1031 exchanges for real estate, and holding periods to minimize tax burdens.
Mistake #5: Failing to Monitor Equity Levels
Equity values change continuously as asset prices fluctuate and debt balances adjust. Failing to track these changes can lead to unpleasant surprises.
Solution: Review equity positions quarterly. Calculate current values for major assets (home, investment accounts, business interests) and compare against outstanding debts. Track trends over time to ensure equity is growing.
Equity and Financial Independence

Building sufficient equity across various assets creates the foundation for financial independence, the point where investment income covers living expenses without requiring active work.
The Financial Independence Equation
Financial independence occurs when:
Annual Investment Income ≥ Annual Living Expenses
Investment income derives from equity positions:
- Dividend income from stock equity
- Rental income from real estate equity (after mortgage payments)
- Business distributions from ownership equity
- Interest income from bond equity
The required equity to achieve financial independence depends on expected returns and annual expenses.
Example Calculation:
Annual expenses: $60,000
Expected portfolio return: 4% (conservative)
Required equity: $1,500,000 ($60,000 ÷ 0.04)
At 4% returns, $1,500,000 in equity generates $60,000 annually, covering expenses without depleting principal.
Higher return expectations reduce required equity. At 6% expected returns, only $1,000,000 in equity would be needed ($60,000 ÷ 0.06).
Building Equity for Financial Independence
Achieving financial independence requires systematic equity building over extended periods. The timeline depends on:
- Savings rate: Percentage of income directed toward equity building
- Investment returns: Annual growth rate on invested equity
- Time horizon: Years available for compound growth
- Starting equity: Existing equity accelerates progress
Savings Rate Impact:
| Savings Rate | Years to Financial Independence* |
|---|---|
| 10% | 51 years |
| 25% | 32 years |
| 50% | 17 years |
| 75% | 7 years |
*Assumes 5% real returns and living on 100% of current take-home pay in retirement
This table demonstrates the dramatic impact of savings rate on financial independence timelines. Higher savings rates both accumulate equity faster and reduce required equity by lowering living expenses.
Investors pursuing financial independence often focus on dividend growth stocks and dividend aristocrats that provide growing income streams from equity positions.
Interactive Tools and Resources
💰 Equity Calculator
Calculate your true ownership value across different asset types
Conclusion: Building Wealth Through Equity
Equity represents the mathematical foundation of wealth building—the measurable difference between what you own and what you owe. This simple concept applies universally across real estate, business ownership, investment portfolios, and every asset class.
Understanding equity transforms financial decision-making. Instead of focusing solely on gross values and impressive-sounding numbers, equity-focused thinking prioritizes net ownership and real wealth accumulation.
The path to financial independence runs directly through systematic equity building:
Immediate Actions:
- Calculate current equity positions across all major assets—home, investments, business interests
- Track equity trends quarterly to monitor whether financial decisions are building or eroding wealth
- Establish systematic debt reduction plans for mortgages, student loans, and other liabilities
- Implement automated investment contributions to build equity in diversified portfolios
- Maintain adequate equity cushions to protect against market volatility and economic downturns
Long-Term Strategy:
The math behind equity building is unforgiving but fair. Those who consistently reduce liabilities, allow assets to appreciate, and reinvest profits build substantial equity over time. Those who accumulate debt-laden assets without building true ownership find themselves perpetually working without wealth accumulation.
Start measuring equity today. Calculate the difference between what you own and what you owe across every asset. Track this number monthly. Watch it grow through disciplined financial decisions and patient capital allocation.
Equity doesn’t build overnight. But compounded over years and decades, systematic equity growth creates the foundation for financial independence, generational wealth, and true economic security.
The question isn’t whether to focus on equity; it’s whether you’re ready to prioritize real ownership over the illusion of gross asset values. Your financial future depends on the answer.
References
[1] Federal Reserve Board. (2024). “Distribution of Household Wealth in the U.S.” Federal Reserve Economic Data. https://www.federalreserve.gov
[2] Federal Housing Finance Agency. (2024). “House Price Index.” FHFA.gov. https://www.fhfa.gov
[3] Interbrand. (2024). “Best Global Brands 2024.” Interbrand.com. https://www.interbrand.com
[4] Federal Reserve Board. (2023). “Survey of Consumer Finances.” Federal Reserve Statistical Release. https://www.federalreserve.gov
[5] Morningstar. (2024). “Long-Term Returns on Stocks, Bonds, and Bills.” Morningstar Direct. https://www.morningstar.com
Author Bio
Max Fonji is the founder of The Rich Guy Math, a data-driven financial education platform dedicated to explaining the mathematical principles behind wealth building. With expertise in valuation principles, investment analysis, and evidence-based financial planning, Max translates complex financial concepts into actionable insights for investors at all levels. His analytical approach combines rigorous quantitative methods with clear educational communication, helping readers understand not just what to do with money, but why specific strategies work based on mathematical evidence.
Educational Disclaimer
This article is provided for educational and informational purposes only and does not constitute financial, investment, tax, or legal advice. The content presents general principles about equity and wealth building, but cannot account for individual circumstances, risk tolerance, or financial goals.
Equity values fluctuate based on market conditions, economic factors, and individual asset performance. Historical returns and examples cited do not guarantee future results. All investments carry risk, including potential loss of principal.
Before making financial decisions involving equity, whether purchasing real estate, investing in securities, starting a business, or using leverage, consult with qualified financial, tax, and legal professionals who can evaluate your specific situation and provide personalized guidance.
The Rich Guy Math and its authors do not provide personalized financial advice through this content. Readers are responsible for conducting their own due diligence and making informed decisions appropriate to their individual circumstances.
Frequently Asked Questions About Equity
What is the simplest definition of equity?
Equity is the value you actually own in an asset after subtracting what you owe. It’s calculated as: Equity = Asset Value – Debt. For example, if your home is worth $300,000 and you owe $200,000 on the mortgage, your equity is $100,000.
How does equity differ from cash?
Cash represents liquid money available for immediate use, while equity represents ownership value that may not be liquid. You can spend cash directly, but accessing equity typically requires selling the asset or borrowing against it. Both contribute to net worth, but equity often provides growth potential while cash provides flexibility.
Can equity be negative?
Yes, equity becomes negative when liabilities exceed asset values. This situation, called being “underwater” or “upside down,” occurs when you owe more than an asset is worth. For example, if your home value drops to $180,000 but you owe $200,000, you have -$20,000 in equity.
How do I increase my equity?
Equity increases through four primary methods: (1) paying down debt, (2) asset appreciation, (3) adding new capital, and (4) retaining profits (for businesses). The most reliable approach combines systematic debt reduction with long-term asset ownership, allowing both mechanisms to work simultaneously.
What is a good equity percentage?
For homes, 20% equity or higher is generally considered healthy and provides access to better refinancing terms. For businesses, equity ratios above 50% indicate strong financial stability. For investment portfolios using margin, maintaining at least 50% equity provides cushion against market volatility. Higher equity percentages always reduce risk.
Does equity appear on financial statements?
Yes, equity appears on the balance sheet as the difference between total assets and total liabilities. For corporations, the equity section includes multiple components: common stock, additional paid-in capital, retained earnings, and other comprehensive income. Personal balance sheets also show net equity (net worth) as assets minus liabilities.
How is equity taxed?
Equity itself isn’t taxed—only transactions involving equity trigger tax consequences. Selling appreciated assets generates capital gains taxes on the equity growth. Dividends paid from corporate equity are taxed as income. Extracting home equity through refinancing doesn’t trigger taxes, but selling the property does. Understanding capital gains tax implications helps optimize equity-related decisions.
What’s the relationship between equity and risk?
Higher equity generally reduces risk because it provides a larger cushion against asset value declines. Conversely, lower equity (higher leverage) amplifies both gains and losses, increasing risk. The debt-to-equity ratio quantifies this relationship—lower ratios indicate less risk, while higher ratios signal greater leverage and risk exposure.
