When analyzing a company’s financial health, understanding how it finances its operations separates informed investors from those guessing in the dark. The Equity Multiplier reveals a critical truth: whether a business builds its empire on shareholder money or borrowed funds.
This single ratio exposes the math behind financial leverage, showing exactly how much risk a company accepts to amplify potential returns. For investors seeking data-driven insights into corporate balance sheets, the equity multiplier transforms complex financing structures into a clear, actionable number.
Key Takeaways
- The equity multiplier measures financial leverage by dividing total assets by shareholders’ equity, revealing how much a company relies on debt versus equity financing
- A multiplier of 1.0 means zero debt, while higher values indicate increasing leverage and financial risk
- The ratio is essential for DuPont analysis, connecting leverage decisions to overall return on equity
- Industry context matters critically; capital-intensive sectors naturally carry higher multipliers than service businesses
- Higher multipliers amplify both returns and risks, making this metric vital for understanding a company’s financial structure and stability
What Is the Equity Multiplier?
The equity multiplier is a financial leverage ratio that quantifies how much of a company’s assets are financed by shareholders versus creditors. It measures the proportion of total assets supported by equity capital.
This ratio belongs to the family of leverage metrics that help investors assess corporate capital structure. Unlike debt ratios that focus solely on liabilities, the equity multiplier approaches leverage from the asset side of the balance sheet.
The Core Concept Behind Financial Leverage
Every company needs assets to operate: equipment, inventory, real estate, and intellectual property. The fundamental question becomes: where does the money come from to acquire these assets?
Two primary sources exist: equity (shareholder investment) and debt (borrowed capital). The equity multiplier reveals this financing mix through a simple calculation.
A higher equity multiplier indicates greater reliance on debt financing. This creates leverage; the company controls more assets than shareholders have directly invested. As a result, returns can magnify when the business performs well, but losses also amplify during downturns.
How the Equity Multiplier Fits Into Financial Analysis
The equity multiplier serves as one component of a comprehensive financial evaluation. Analysts use it alongside other metrics to build a complete picture of corporate health and risk exposure.
This ratio gained prominence through the DuPont analysis framework, which decomposes return on equity into three distinct drivers. The equity multiplier represents the leverage component of this equation.
Because the equity multiplier directly connects to return on equity, understanding this relationship helps investors grasp how companies generate shareholder returns. A company can boost ROE through operational efficiency, asset management, or financial leverage; the equity multiplier isolates that third pathway.
The Equity Multiplier Formula Explained
The equity multiplier calculation requires only two inputs, both found on the company’s balance sheet. This simplicity makes it accessible for beginner investors while remaining powerful for sophisticated analysis.
The Basic Formula
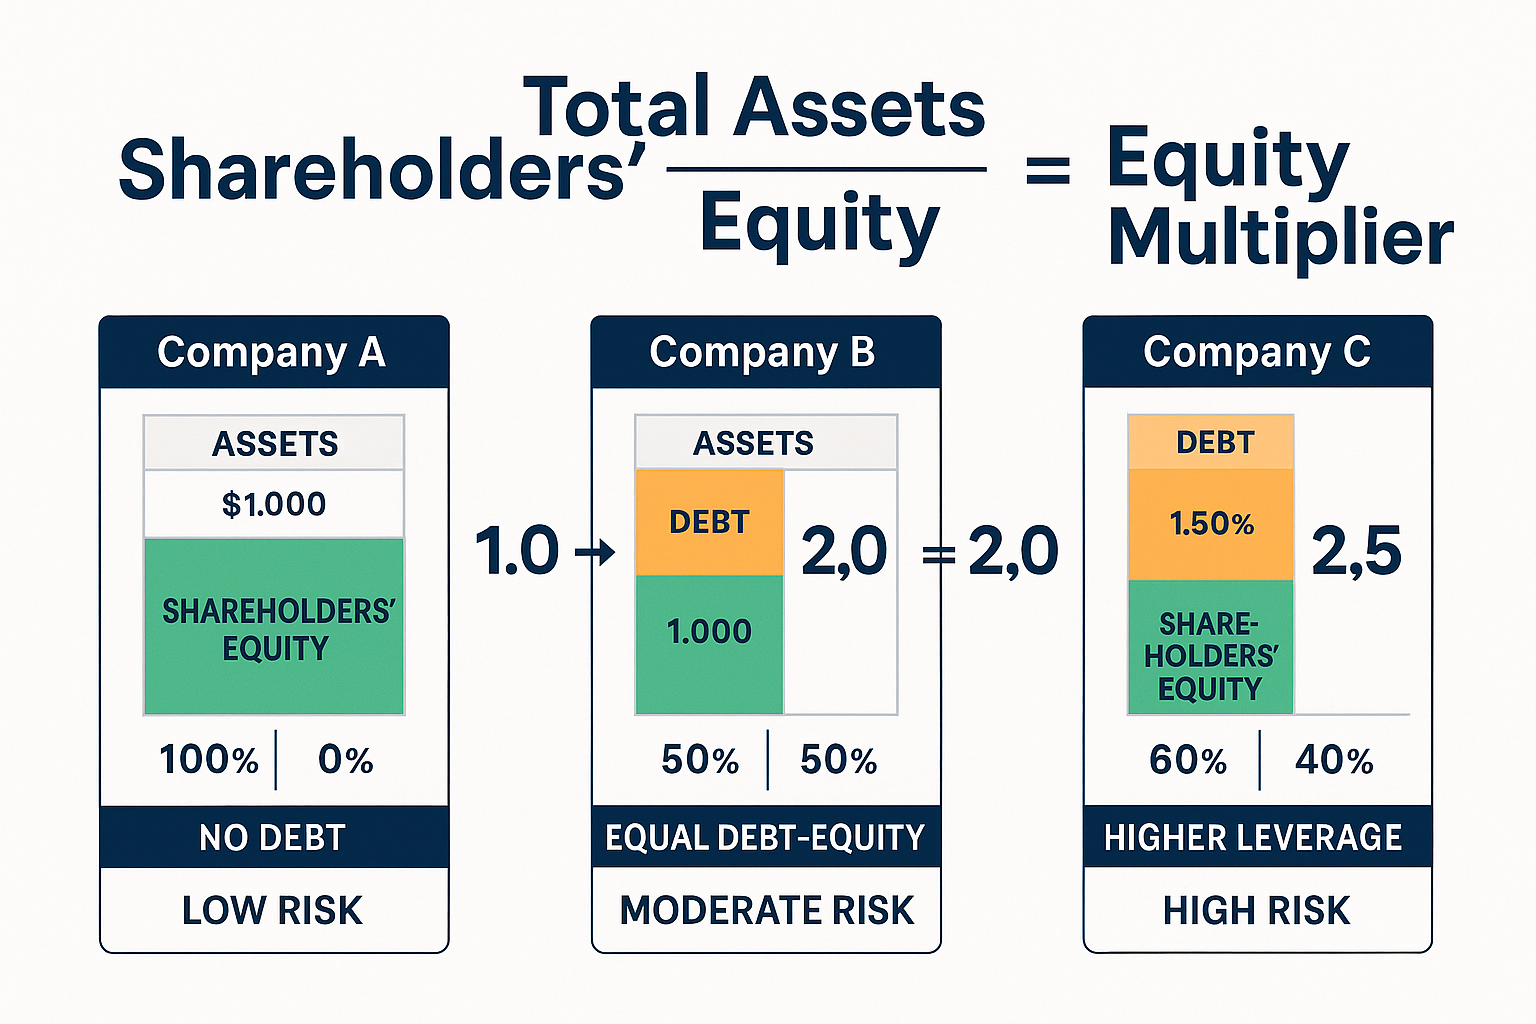
Equity Multiplier = Total Assets ÷ Shareholders’ Equity
Both values come directly from the balance sheet:
- Total Assets: Everything the company owns (current assets + non-current assets)
- Shareholders’ Equity: The residual ownership stake after subtracting liabilities from assets
The formula can also be expressed as:
Equity Multiplier = Total Assets ÷ (Total Assets – Total Liabilities)
This alternative formulation highlights the relationship between assets, liabilities, and equity through the fundamental accounting equation.
How to Calculate Equity Multiplier Step-by-Step Example
Consider a company with the following balance sheet values:
| Balance Sheet Item | Amount |
|---|---|
| Total Assets | $500,000 |
| Total Liabilities | $300,000 |
| Shareholders’ Equity | $200,000 |
Calculation:
Equity Multiplier = $500,000 ÷ $200,000 = 2.5
This result means that for every $1 of shareholder equity, the company controls $2.50 in total assets. The difference ($1.50 per equity dollar) comes from debt financing.
Understanding the Numbers
The equity multiplier always equals 1.0 or higher. Here’s what different values indicate:
- 1.0: Zero debt; all assets financed entirely by equity
- 2.0: Equal split between debt and equity financing
- 3.0: Debt finances twice as much as equity
- 4.0 and above: Heavy reliance on borrowed capital
Lower multipliers indicate conservative financing strategies. Companies with ratios near 1.0 carry minimal debt, reducing financial risk but potentially limiting growth opportunities.
Higher multipliers signal aggressive leverage. These companies amplify potential returns through borrowed money, but they also face greater vulnerability during economic stress because debt obligations remain fixed regardless of business performance.
The Relationship to Other Leverage Ratios
The equity multiplier connects mathematically to the debt-to-equity ratio, another common leverage metric:
Equity Multiplier = 1 + Debt-to-Equity Ratio
This relationship allows quick conversion between metrics. A company with a debt-to-equity ratio of 1.5 has an equity multiplier of 2.5 (1 + 1.5).
Similarly, the equity multiplier relates inversely to the equity ratio:
Equity Multiplier = 1 ÷ Equity Ratio
If a company’s equity ratio is 0.40 (meaning equity funds 40% of assets), the equity multiplier equals 2.5 (1 ÷ 0.40).
How to Use the Equity Multiplier in Investment Analysis
Understanding the formula represents only the starting point. The real value emerges when applying this metric to evaluate investment opportunities and assess corporate risk profiles.
Comparing Companies Within Industries
The equity multiplier shines brightest in comparative analysis. Examining a single company’s multiplier in isolation provides limited insight; context comes from benchmarking against competitors.
Industry norms vary dramatically. Capital-intensive businesses like utilities, telecommunications, and real estate naturally carry higher equity multipliers because they require substantial fixed assets financed partially through debt.
Service companies, software firms, and consulting businesses typically show lower multipliers. These operations need fewer physical assets and can fund growth primarily through retained earnings and equity.
When comparing companies, focus on peers within the same sector. A utility company with an equity multiplier of 3.5 might be conservative, while a technology startup with the same ratio could signal dangerous overleveraging.
Identifying Financial Risk Levels
The equity multiplier serves as a risk indicator because debt creates fixed obligations. Companies must pay interest and principal regardless of profitability.
Higher multipliers mean greater financial risk for several reasons:
- Increased bankruptcy probability: More debt means higher fixed payments that can overwhelm cash flow during downturns
- Reduced financial flexibility: Heavily leveraged companies struggle to obtain additional financing when needed
- Earnings volatility: Leverage magnifies both gains and losses, creating unpredictable results
- Covenant restrictions: Debt agreements often limit management decisions and strategic options
Investors seeking stability and consistent returns typically prefer companies with lower equity multipliers. Those willing to accept higher risk for potentially greater rewards may target moderately leveraged firms.
Extreme multipliers in either direction warrant scrutiny. A ratio below 1.5 might indicate excessive conservatism, potentially underutilizing tax advantages of debt or missing growth opportunities. Ratios above 5.0 often signal distress or unsustainable capital structures.
The Equity Multiplier in DuPont Analysis
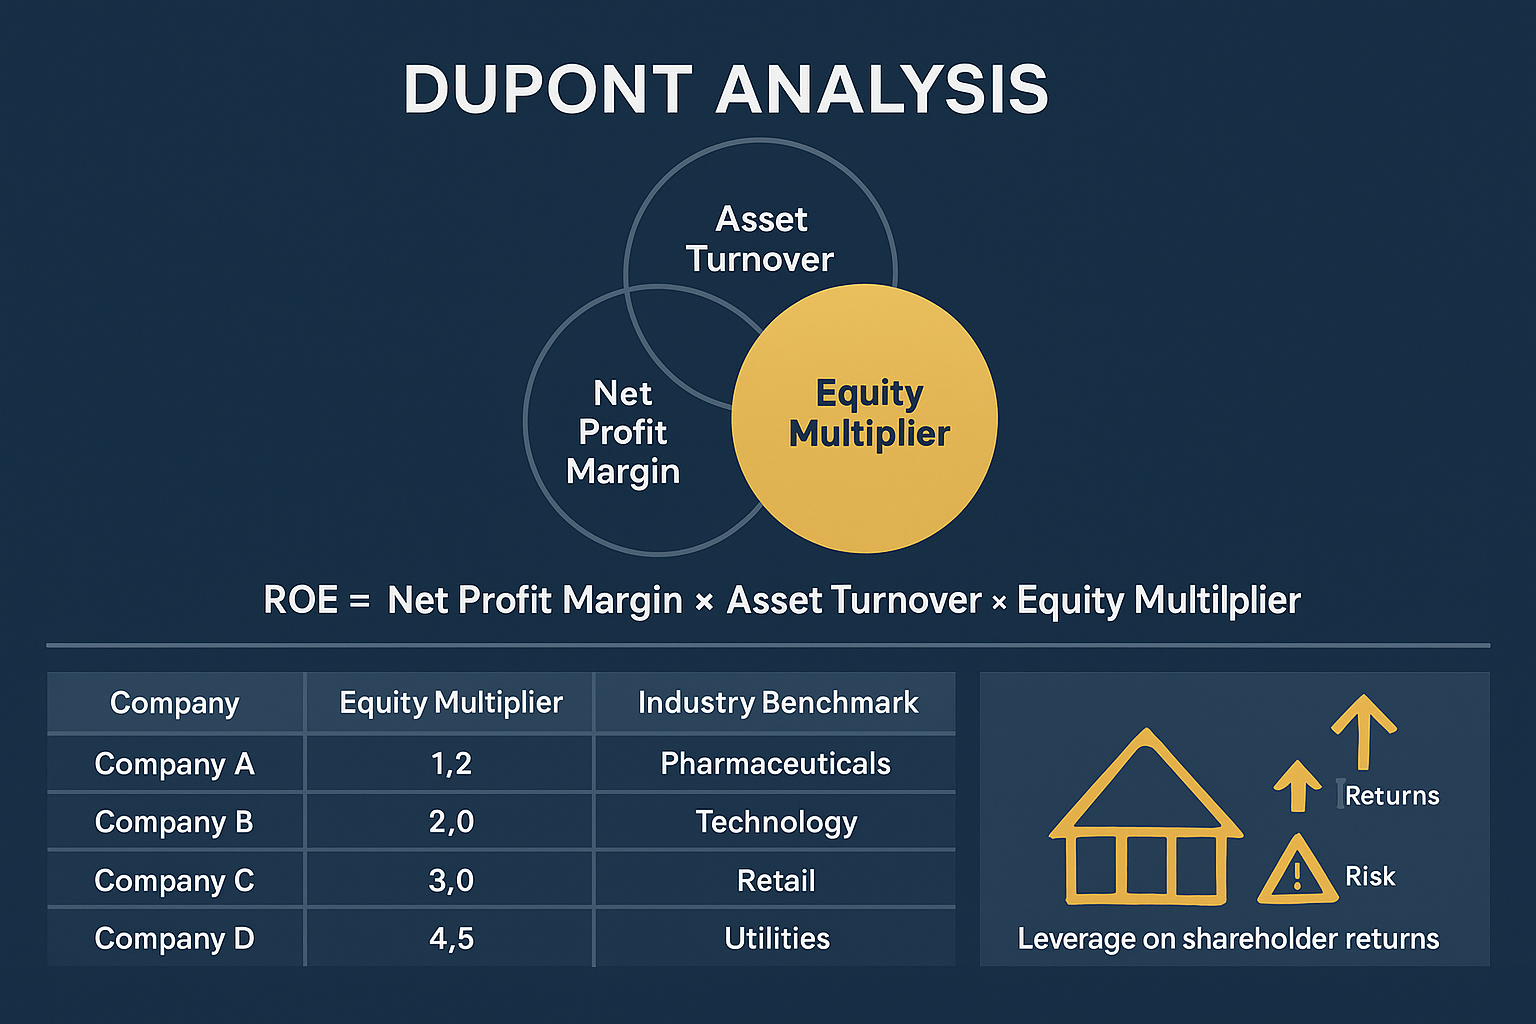
The DuPont framework decomposes return on equity into three components, revealing the drivers behind shareholder returns:
ROE = Net Profit Margin × Asset Turnover × Equity Multiplier
This equation shows that companies can improve ROE through:
- Operational efficiency (higher profit margins)
- Asset productivity (better asset turnover)
- Financial leverage (increased equity multiplier)
The equity multiplier isolates the leverage contribution. Two companies might deliver identical ROE, but one achieves it through superior operations while another relies on debt amplification.
This distinction matters tremendously for risk assessment. Leverage-driven ROE carries higher volatility and downside risk compared to operationally-driven returns.
Consider two companies, each with 15% ROE:
Company A:
- Net Profit Margin: 10%
- Asset Turnover: 1.5×
- Equity Multiplier: 1.0
- ROE = 10% × 1.5 × 1.0 = 15%
Company B:
- Net Profit Margin: 5%
- Asset Turnover: 1.0×
- Equity Multiplier: 3.0
- ROE = 5% × 1.0 × 3.0 = 15%
Company A generates superior returns through operational excellence with zero debt. Company B achieves the same ROE only through aggressive leverage, creating significantly higher risk.
Understanding how companies construct their returns helps investors make informed decisions aligned with their risk management preferences.
Tracking Changes Over Time
The equity multiplier’s trajectory reveals strategic shifts in capital structure. Monitoring this ratio across multiple periods exposes management’s financing philosophy and changing risk profiles.
Rising equity multipliers indicate:
- Increased debt issuance
- Share buyback programs are reducing equity
- Acquisition activity financed through borrowing
- Declining retained earnings or equity value
Falling equity multipliers suggest:
- Debt repayment initiatives
- Equity offerings dilute ownership
- Strong earnings retention, building equity base
- Conservative shift in financial strategy
Sudden jumps or drops deserve investigation. A manufacturing company that maintains a 2.0 multiplier for years, then jumps to 3.5, has fundamentally altered its risk profile, understanding why matters for investment decisions.
Similarly, understanding the relationship between assets and liabilities helps contextualize these changes within broader financial health trends.
Practical Applications and Real-World Examples
Theory becomes actionable through concrete examples. Examining how different companies and industries utilize leverage illuminates the equity multiplier’s practical implications.
Industry-Specific Benchmarks
Different sectors maintain characteristic equity multiplier ranges based on their business models and capital requirements:
| Industry | Typical Equity Multiplier Range | Reasoning |
|---|---|---|
| Technology/Software | 1.2 – 2.0 | Low capital requirements, asset-light operations |
| Retail | 2.0 – 3.0 | Moderate inventory and real estate needs |
| Manufacturing | 2.5 – 3.5 | Significant equipment and facility investments |
| Utilities | 3.0 – 4.5 | Massive infrastructure requiring debt financing |
| Banking/Finance | 8.0 – 15.0+ | Unique business model with deposits as “debt” |
Financial institutions operate differently. Banks and insurance companies show extremely high equity multipliers because customer deposits and policy reserves appear as liabilities. This doesn’t indicate distress; it reflects their intermediary role in the financial system.
For non-financial companies, multipliers above 5.0 typically signal aggressive leverage or potential financial stress. Context always matters, but these benchmarks provide useful reference points.
Case Study: Conservative vs Aggressive Leverage
Conservative Company Example:
TechCorp shows the following balance sheet:
- Total Assets: $1,000,000
- Total Liabilities: $200,000
- Shareholders’ Equity: $800,000
Equity Multiplier = $1,000,000 ÷ $800,000 = 1.25
This low multiplier indicates TechCorp finances operations primarily through equity. The company carries minimal debt, providing financial stability and flexibility. During economic downturns, TechCorp faces fewer fixed obligations and can weather storms more easily.
However, this conservative approach has tradeoffs. TechCorp foregoes tax benefits from interest deductions and might grow more slowly than leveraged competitors during expansions.
Aggressive Company Example:
ManufactureCo presents different numbers:
- Total Assets: $1,000,000
- Total Liabilities: $750,000
- Shareholders’ Equity: $250,000
Equity Multiplier = $1,000,000 ÷ $250,000 = 4.0
ManufactureCo uses substantial debt to control four times the assets that shareholders directly funded. This leverage amplifies returns when business thrives, profits flow to a smaller equity base, boosting ROE.
But risk increases proportionally. If revenue declines 20%, ManufactureCo must still service debt obligations. The fixed nature of debt payments can quickly consume cash flow, potentially leading to covenant violations or bankruptcy.
How Companies Change Their Equity Multiplier
Management can deliberately adjust the equity multiplier through various strategic actions:
Increasing the Multiplier:
- Issue new debt: Borrowing money increases assets (cash) and liabilities, raising the multiplier
- Share buybacks: Repurchasing stock reduces equity while maintaining assets, increasing the ratio
- Special dividends: Large equity distributions decrease shareholders’ equity
- Leverage acquisitions: Buying companies with debt financing adds assets and liabilities
Decreasing the Multiplier:
- Debt repayment: Paying down loans reduces both assets (cash) and liabilities
- Equity offerings: Selling new shares increases shareholders’ equity
- Retained earnings: Profitable operations that retain earnings build an equity base
- Asset sales: Divesting assets to pay debt reduces the numerator and denominator
Understanding these mechanisms helps investors interpret changes in capital structure. A company reducing its multiplier from 3.5 to 2.5 over three years demonstrates commitment to deleveraging and risk reduction.
Limitations and What the Equity Multiplier Doesn’t Tell You
Despite its usefulness, the equity multiplier has important limitations:
1. No information about debt quality or terms
The ratio treats all debt equally. A company with low-interest, long-term bonds faces a different risk than one with high-interest, short-term loans, but the equity multiplier doesn’t distinguish.
2. Ignores cash flow and liquidity
A high multiplier paired with strong cash generation might be sustainable, while the same ratio with weak cash flow signals danger. The metric doesn’t capture this critical difference.
3. Accounting values vs market values
Balance sheets use historical cost accounting. A company with appreciated real estate shows artificially low equity, inflating the multiplier beyond economic reality.
4. Industry context required
Without sector benchmarks, the ratio provides limited insight. A 2.5 multiplier means entirely different things for a software company versus a utility.
5. Doesn’t measure profitability
A company can have a conservative equity multiplier while losing money, or an aggressive multiplier while generating strong returns. Leverage and profitability are separate dimensions requiring separate analysis.
Effective financial analysis combines the equity multiplier with complementary metrics like EBITDA, cash flow ratios, and profitability measures to build a complete picture.
Advanced Insights: Equity Multiplier and Investment Strategy
Beyond basic analysis, sophisticated investors leverage the equity multiplier to refine portfolio construction and identify opportunities aligned with specific investment philosophies.
Value Investing Perspectives
Value investors often prefer companies with lower equity multipliers. Conservative leverage indicates financial discipline and provides a margin of safety during market turbulence.
Benjamin Graham’s principles emphasized balance sheet strength. Companies with minimal debt can survive prolonged downturns, maintain dividends, and capitalize on opportunities when competitors struggle.
The equity multiplier helps identify these financially robust businesses. When screening for value investments, targeting multipliers below industry medians filters for companies less vulnerable to financial distress.
However, extremely low multipliers might indicate management inefficiency. A company sitting on excess cash with a 1.0 multiplier potentially wastes shareholder capital that could generate returns through strategic investments or an optimal capital structure.
Growth Investing and Leverage
Growth investors face different considerations. Rapidly expanding companies often utilize leverage to accelerate development without diluting existing shareholders through equity offerings.
Moderate leverage can fuel growth efficiently. A technology company with a 2.0 equity multiplier might use debt to fund research, acquisitions, or market expansion while maintaining founder control and avoiding dilution.
The key distinction lies between productive leverage (funding growth initiatives with positive returns) and financial leverage (simply amplifying existing operations). The equity multiplier alone doesn’t reveal this difference; investors must examine how companies deploy borrowed capital.
Tracking the multiplier alongside revenue growth and return on assets reveals whether leverage drives value creation or merely inflates financial risk.
Dividend Investing Considerations
For dividend investors, the equity multiplier signals payout sustainability. High leverage creates fixed obligations that compete with dividends for cash flow.
Companies with equity multipliers above 4.0 face greater dividend risk. During downturns, management must prioritize debt service over shareholder distributions to avoid default.
Conservative dividend portfolios often emphasize companies with multipliers between 1.5 and 2.5. These businesses maintain financial flexibility to sustain and grow payouts through economic cycles.
The dividend aristocrats, companies with 25+ years of consecutive dividend increases, typically show moderate equity multipliers, reflecting the balanced approach necessary for long-term payout reliability.
Sector Rotation Strategies
The equity multiplier informs sector rotation decisions based on economic cycles:
During Economic Expansions:
Higher equity multipliers become more acceptable as revenue growth supports debt service. Cyclical sectors like industrials and materials often carry elevated leverage to maximize returns during booms.
Investors might increase exposure to moderately leveraged companies (multipliers 2.5-3.5) that can amplify economic growth into shareholder returns.
During Economic Contractions:
Lower equity multipliers provide defensive characteristics. Companies with minimal debt survive revenue declines more reliably and maintain operational flexibility.
Rotating toward sectors and companies with multipliers below 2.0 reduces portfolio vulnerability during recessions. Utilities, consumer staples, and healthcare often combine stable cash flows with moderate leverage.
Risk-Adjusted Return Optimization
Modern portfolio theory emphasizes risk-adjusted returns rather than absolute performance. The equity multiplier helps investors understand the risk component of their holdings.
Two companies delivering 12% annual returns carry different risk profiles:
- Company with 1.5 multiplier: Returns driven primarily by operations
- Company with 4.0 multiplier: Returns are amplified significantly by leverage
The second company might underperform dramatically during stress periods, creating higher portfolio volatility. Understanding this distinction allows investors to construct portfolios matching their risk tolerance.
Combining low-leverage defensive holdings with selective higher-leverage growth positions creates balanced portfolios. The equity multiplier provides the data needed for informed allocation decisions.
For investors building diversified portfolios, understanding concepts like dollar-cost averaging alongside leverage metrics creates comprehensive investment strategies.
Common Questions About the Equity Multiplier
What’s a “good” equity multiplier?
No universal “good” value exists, context determines appropriateness. For non-financial companies, multipliers between 1.5 and 3.0 generally indicate balanced capital structures.
The optimal multiplier depends on:
- Industry capital requirements
- Business model stability
- Interest rate environment
- Management’s risk tolerance
- Growth stage and opportunities
A utility company with a 3.5 multiplier might be conservative, while a software company with the same ratio could be overleveraged. Always compare against industry peers and historical trends.
How does the equity multiplier differ from the debt-to-equity ratio?
Both measure leverage but from different perspectives:
Debt-to-Equity Ratio = Total Liabilities ÷ Shareholders’ Equity
- Directly compares debt to equity
- Focuses on the liability side
- More intuitive for many investors
Equity Multiplier = Total Assets ÷ Shareholders’ Equity
- Shows total asset control per equity dollar
- Approaches leverage from the asset side
- Integrates cleanly into DuPont analysis
They’re mathematically related: Equity Multiplier = 1 + Debt-to-Equity Ratio
Both provide valuable perspectives on capital structure. The debt-to-equity ratio emphasizes the debt burden directly, while the equity multiplier shows asset leverage.
Can the equity multiplier be negative?
No, under normal circumstances. Both total assets and shareholders’ equity are positive for ongoing businesses, producing positive multipliers.
However, negative shareholders’ equity creates mathematical complications. Companies with accumulated losses exceeding invested capital show negative equity on balance sheets.
When equity is negative, the equity multiplier becomes negative—but this signals severe financial distress rather than providing useful analytical information. Companies in this position face bankruptcy risk and require different evaluation frameworks.
Why do banks have such high equity multipliers?
Financial institutions operate fundamentally differently from operating companies. Banks hold customer deposits as liabilities while deploying those funds as assets (loans, securities).
A typical bank might show:
- Total Assets: $100 billion
- Shareholders’ Equity: $8 billion
- Equity Multiplier: 12.5
This high leverage reflects banking’s intermediary role. Deposits aren’t traditional debt—they’re the core business model. Banks earn returns by borrowing (accepting deposits) at low rates and lending at higher rates.
Regulatory capital requirements ensure banks maintain sufficient equity buffers despite high multipliers. Comparing bank multipliers to industrial companies produces meaningless results because the business models differ fundamentally.
Should I avoid companies with high equity multipliers?
Not necessarily. High multipliers indicate risk that requires compensation through higher expected returns. The question becomes whether the potential return justifies the added risk.
Consider avoiding high multipliers when:
- The company operates in cyclical or unstable industries
- Cash flow shows high volatility
- Interest coverage ratios are weak
- The business model lacks competitive advantages
- Your portfolio already carries significant risk
High multipliers might be acceptable when:
- The industry naturally requires capital-intensive operations
- Cash flows are stable and predictable
- Management has proven ability to manage leverage
- The company trades at significant discounts to intrinsic value
- You’re building a diversified portfolio with risk capacity
Risk tolerance varies among investors. Conservative portfolios emphasize lower multipliers, while aggressive growth strategies might accept higher leverage selectively.
Understanding your personal budgeting and financial goals helps determine appropriate risk levels for your investment portfolio.
Conclusion: Mastering the Math Behind Financial Leverage
The equity multiplier transforms complex capital structures into a single, actionable number. This ratio reveals how companies finance their operations and the financial risk embedded in their balance sheets.
Understanding the equity multiplier provides several critical advantages:
- Quick leverage assessment: Instantly gauge how much debt supports a company’s assets
- Comparative analysis: Benchmark capital structures against industry peers
- Risk evaluation: Identify companies with excessive or conservative leverage
- DuPont integration: Understand how leverage contributes to overall returns
- Strategic insight: Track management’s evolving approach to capital structure
The formula itself is simple—total assets divided by shareholders’ equity. But the implications extend far beyond basic calculation. The equity multiplier connects to fundamental questions about risk, return, and corporate strategy.
For investors building wealth through evidence-based decisions, the equity multiplier belongs in the analytical toolkit alongside profitability metrics, valuation ratios, and cash flow analysis. No single metric tells the complete story, but the equity multiplier illuminates the critical dimension of financial leverage.
Actionable Next Steps
- Calculate equity multipliers for your current holdings: Review balance sheets and compute the ratio for each position
- Compare against industry benchmarks: Research typical multipliers for relevant sectors
- Integrate into DuPont analysis: Decompose ROE to understand return drivers
- Track changes over time: Monitor whether companies are leveraging up or deleveraging
- Adjust portfolio allocations: Ensure your overall portfolio leverage matches your risk tolerance
The math behind money reveals the truth that marketing narratives obscure. Companies can boost returns through operational excellence or financial engineering; the equity multiplier exposes which path they’ve chosen.
Financial literacy grows through understanding these fundamental relationships. Each ratio, formula, and framework adds another layer of insight, transforming investing from speculation into systematic analysis.
The equity multiplier represents one piece of the larger puzzle. Combined with an understanding of assets, accounting principles, and valuation frameworks, investors build the knowledge base necessary for long-term wealth creation.
Master the metrics. Understand the math. Make informed decisions based on data rather than hope. The equity multiplier provides the leverage insight; use it wisely.
References
[1] Corporate Finance Institute. “Equity Multiplier.” CFI Education. https://corporatefinanceinstitute.com/
[2] Investopedia. “Equity Multiplier: Definition, Formula, and Analysis.” https://www.investopedia.com/
[3] CFA Institute. “Financial Analysis Techniques.” CFA Program Curriculum, 2025.
[4] Damodaran, Aswath. “Investment Valuation: Tools and Techniques for Determining the Value of Any Asset.” Wiley Finance, 2012.
[5] Financial Accounting Standards Board (FASB). “Balance Sheet Classification Standards.” https://www.fasb.org/
[6] Palepu, Krishna G., and Paul M. Healy. “Business Analysis and Valuation: Using Financial Statements.” Cengage Learning, 2013.
Author Bio
Max Fonji is the founder of The Rich Guy Math, a data-driven financial education platform dedicated to teaching the mathematical principles behind wealth building and investing. With a background in financial analysis and a passion for making complex concepts accessible, Max breaks down the numbers that drive investment decisions, helping readers understand the evidence-based strategies that create long-term financial success.
Educational Disclaimer
This article is provided for educational and informational purposes only and does not constitute financial, investment, tax, or legal advice. The equity multiplier is one of many financial metrics used in investment analysis, and no single ratio should form the sole basis for investment decisions.
Financial markets involve risk, including the potential loss of principal. Past performance does not guarantee future results. Individual companies’ financial structures vary based on industry, business model, and strategic objectives; what appears optimal for one company may be inappropriate for another.
Before making investment decisions, conduct thorough research, consider your personal financial situation, risk tolerance, and investment objectives, and consult with qualified financial professionals. The Rich Guy Math does not provide personalized investment recommendations or manage client assets.
All data, examples, and calculations presented are for illustrative purposes. Actual investment results will vary based on market conditions, timing, fees, taxes, and individual circumstances.


