In 2008, Lehman Brothers collapsed under the weight of a 30:1 leverage ratio, $30 of assets for every $1 of equity. The same tool that built empires destroyed one of Wall Street’s oldest institutions in days.
Financial Leverage represents one of the most powerful and dangerous concepts in finance. It’s the strategic use of borrowed capital to increase the potential return on investment, functioning as a financial multiplier that amplifies both gains and losses. Understanding the math behind money means recognizing how debt transforms a company’s risk-return profile and why this mechanism separates thriving businesses from bankrupt ones.
This guide breaks down the definition, formulas, real-world examples, and critical insights every investor needs to evaluate leverage intelligently. By the end, you’ll understand exactly how companies use debt to magnify returns and when that strategy backfires.
Key Takeaways
- Financial leverage uses borrowed capital to increase potential returns on equity, functioning as a multiplier that amplifies both profits and losses
- The primary leverage ratio formula is Total Assets ÷ Shareholders’ Equity, with ratios above 2.0x generally indicating higher risk levels
- Leverage magnifies returns: A 20% asset return can translate to 80% equity returns with proper leverage, but losses multiply identically
- Industry context matters critically in capital-intensive sectors like utilities operate safely at 3-4x leverage, while tech companies rarely exceed 1.5x
- Interest coverage ratio (EBIT ÷ Interest Expense) determines sustainability, with ratios below 2.5x signaling potential financial distress
What Is Financial Leverage?
Financial leverage is the practice of using debt to finance assets to increase returns to equity holders beyond what would be possible using only internal capital.
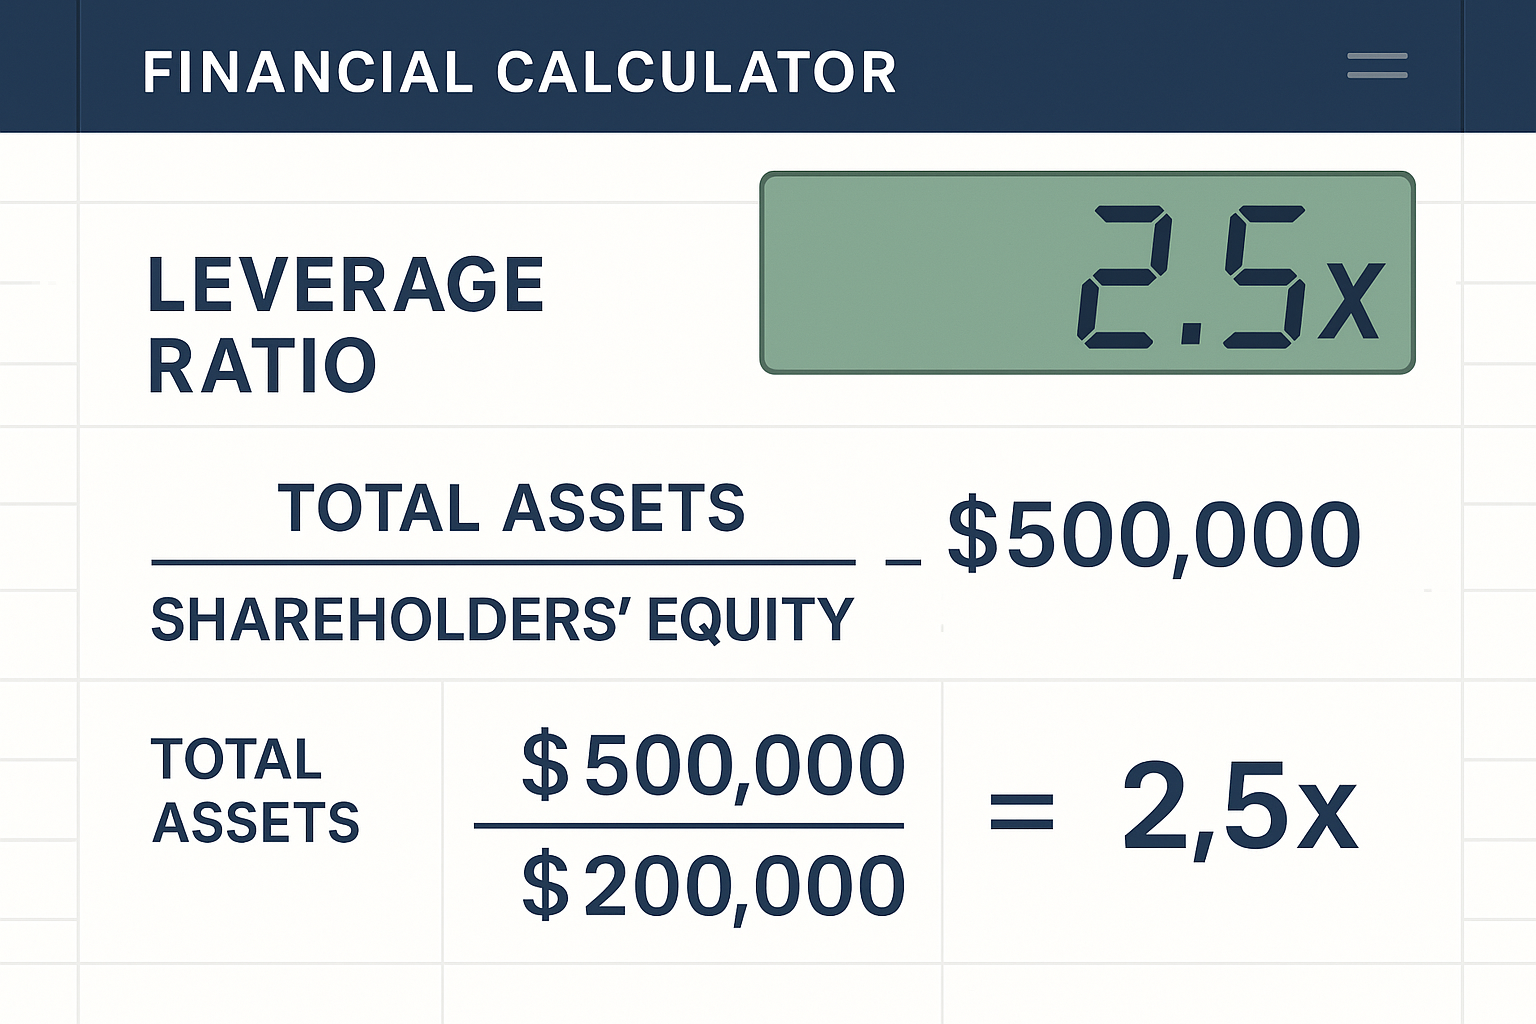
Think of leverage as a financial fulcrum. With the right positioning, a small amount of equity can move a much larger asset base. A company with $200,000 in equity that borrows $300,000 can control $500,000 in assets, 2.5 times what equity alone would allow.
The Mechanism Behind Leverage
The power of leverage comes from a simple mathematical reality: when the return on borrowed capital exceeds the cost of that debt, the difference flows directly to equity holders.
Here’s the cause and effect:
Without leverage: A company invests $100,000 of equity, earns a 15% return, and generates $15,000 profit, a 15% return on equity.
With leverage: The same company uses $100,000 equity plus $200,000 borrowed at 5% interest. Total assets: $300,000. At 15% return, the total profit is $45,000. After paying $10,000 in interest ($200,000 × 5%), the net profit is $35,000, a 35% return on the original $100,000 equity.
The leverage multiplied returns from 15% to 35%. This amplification effect explains why companies pursue debt financing despite the risks.
Why Companies Use Financial Leverage
Organizations employ leverage for three primary reasons:
- Capital efficiency: Debt allows companies to pursue growth opportunities without diluting existing shareholders through equity issuance
- Tax advantages: Interest payments are tax-deductible, reducing the effective cost of debt below the stated interest rate
- Return amplification: When deployed strategically, leverage increases return on equity (ROE) substantially
However, leverage introduces fixed obligations. Interest must be paid regardless of operating performance, creating financial risk that increases with debt levels.
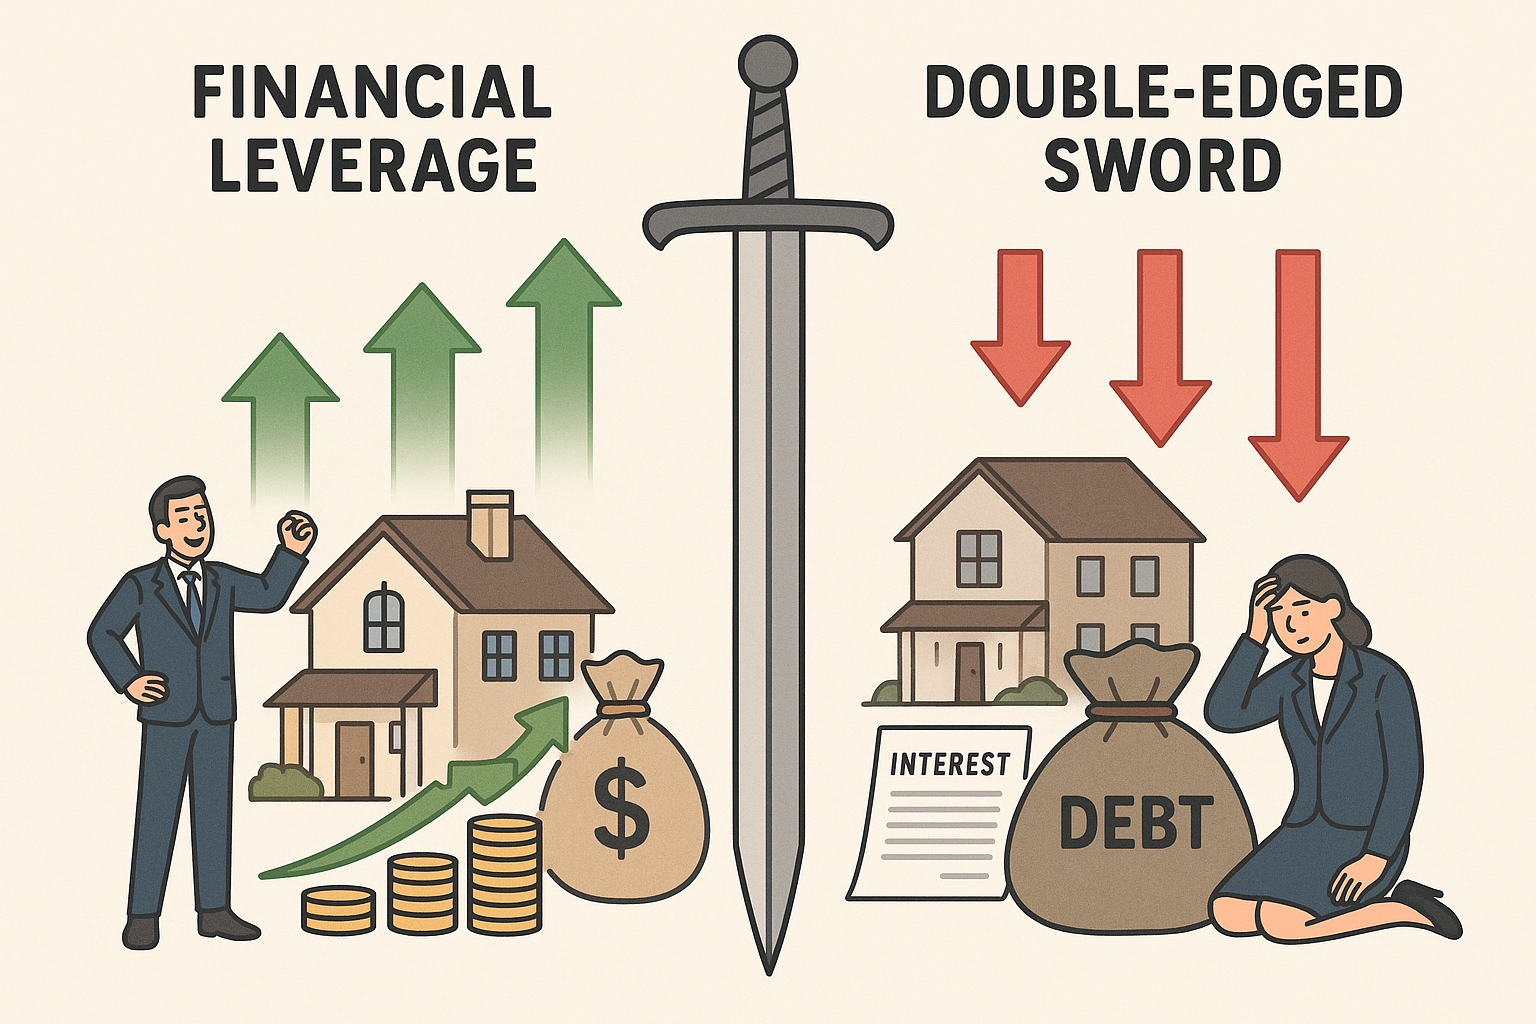
Insight: Financial leverage transforms a company’s risk profile fundamentally. The same mechanism that doubles returns in good times can eliminate equity entirely in downturns.
Understanding Financial Leverage Ratios and Formulas
Measuring leverage requires specific formulas that quantify the relationship between debt, equity, and assets. These ratios provide data-driven insights into a company’s capital structure and financial risk.
Primary Financial Leverage Ratio Formula
The most common leverage ratio divides total assets by shareholders’ equity:
Financial Leverage Ratio = Total Assets ÷ Shareholders’ Equity
For greater precision, use average values:
Financial Leverage Ratio = [(Beginning Total Assets + Ending Total Assets) ÷ 2] ÷ [(Beginning Shareholders’ Equity + Ending Shareholders’ Equity) ÷ 2]
Interpretation:
- 1.0x: No leverage; assets equal equity (zero debt)
- 1.5x: Moderate leverage; $1.50 in assets per $1.00 equity
- 2.0x: Significant leverage; debt equals equity
- 3.0x+: High leverage; substantial debt relative to equity
Alternative Leverage Formulas
Several related ratios measure leverage from different angles:
Debt-to-Equity Ratio:
Debt-to-Equity = Total Debt ÷ Total EquityThis formula isolates debt specifically, excluding other assets. A 1.0 ratio means debt equals equity; 2.0 means debt is twice equity.
Debt-to-Assets Ratio:
Debt-to-Assets = Total Debt ÷ Total AssetsThis shows what percentage of assets are financed through debt. A 0.60 ratio means 60% debt financing, 40% equity financing.
Equity Multiplier:
Equity Multiplier = Total Assets ÷ Total EquityThis is identical to the primary leverage ratio and forms part of the DuPont analysis framework for decomposing ROE. Understanding how equity functions in corporate finance provides essential context for leverage analysis.
Components Explained
Total Assets includes everything a company owns: cash, inventory, equipment, property, intellectual property, and receivables. This figure comes directly from the balance sheet.
Total Equity encompasses all ownership interests: common stock, preferred stock, additional paid-in capital, and retained earnings. This represents the residual claim after all liabilities are satisfied.
Total Debt includes short-term loans, long-term debt, bonds payable, and lease obligations—any borrowed capital requiring repayment with interest.
Calculating Financial Leverage: Step-by-Step Example
Company XYZ Financial Data:
- Beginning Total Assets: $800,000
- Ending Total Assets: $1,000,000
- Beginning Shareholders’ Equity: $300,000
- Ending Shareholders’ Equity: $400,000
Step 1: Calculate average total assets
($800,000 + $1,000,000) ÷ 2 = $900,000Step 2: Calculate average shareholders’ equity
($300,000 + $400,000) ÷ 2 = $350,000Step 3: Divide average assets by average equity
$900,000 ÷ $350,000 = 2.57xResult: Company XYZ operates with a 2.57x financial leverage ratio, meaning it has $2.57 in assets for every $1.00 of equity. This indicates moderate-to-high leverage depending on industry context.
The debt-to-equity ratio provides additional perspective on capital structure decisions.
How Financial Leverage Amplifies Returns (and Losses)
The mathematical amplification effect of leverage works identically in both directions, a reality that makes leverage simultaneously attractive and dangerous.
The Upside: Return Amplification
Consider two identical companies pursuing the same $500,000 investment opportunity:
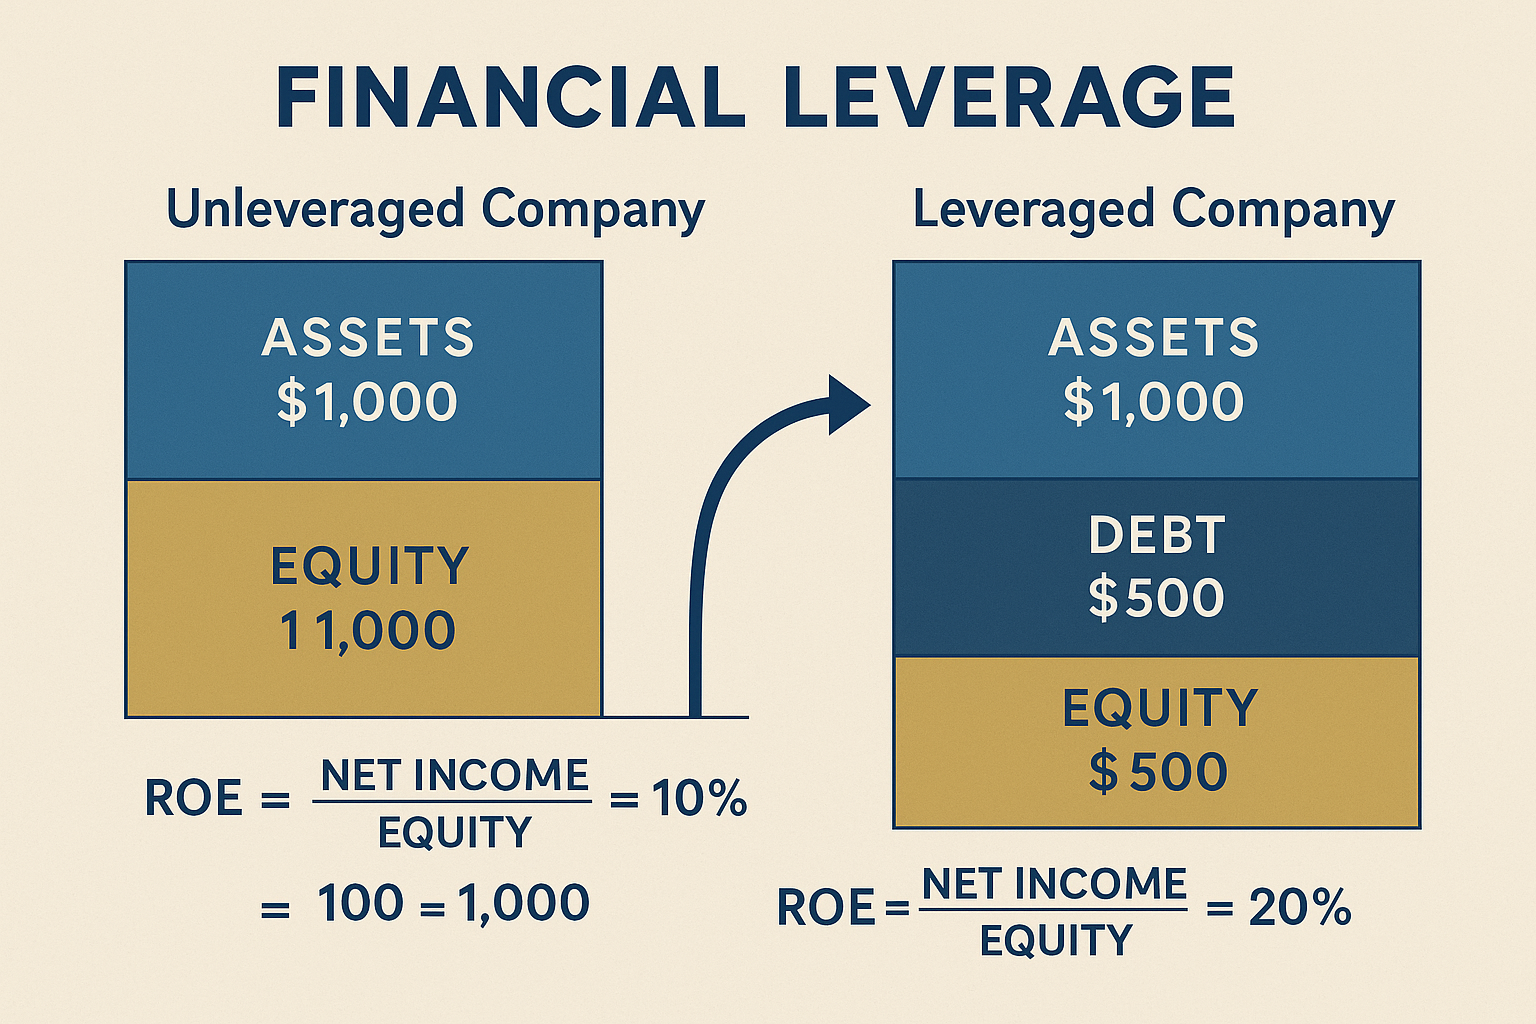
Company A (Unleveraged):
- Equity: $500,000
- Debt: $0
- Total Assets: $500,000
- Asset Return: 20%
- Total Profit: $100,000
- Return on Equity: 20% ($100,000 ÷ $500,000)
Company B (Leveraged):
- Equity: $100,000
- Debt: $400,000 at 6% interest
- Total Assets: $500,000
- Asset Return: 20%
- Total Profit: $100,000
- Interest Expense: $24,000 ($400,000 × 6%)
- Net Profit to Equity: $76,000
- Return on Equity: 76% ($76,000 ÷ $100,000)
Company B achieved a 76% return on equity versus Company A’s 20%, nearly quadruple the return using the same asset base. This demonstrates the leverage’s power when returns exceed borrowing costs.
The Downside: Loss Amplification
Now assume the same investment generates only a 5% return:
Company A (Unleveraged):
- Total Profit: $25,000
- Return on Equity: 5%
Company B (Leveraged):
- Total Profit: $25,000
- Interest Expense: $24,000
- Net Profit to Equity: $1,000
- Return on Equity: 1%
In a poor performance scenario, Company B’s return collapsed to 1% while Company A maintained 5%. The leveraged company’s equity holders absorbed nearly all the downside.
If returns turn negative at -10%:
Company A: -10% ROE (loses $50,000)
Company B:
- Loss: $50,000
- Interest Still Due: $24,000
- Total Loss to Equity: $74,000
- Return on Equity: -74%
The leverage that multiplied gains by 3.8x in good times multiplied losses by 7.4x in bad times.
The Break-Even Threshold
The critical threshold occurs when asset returns equal the cost of debt. At this point, leverage provides no benefit; all profits go to servicing debt.
Formula for Break-Even:
Required Asset Return = (Debt ÷ Total Assets) × Interest RateFor Company B:
($400,000 ÷ $500,000) × 6% = 4.8%Any asset return below 4.8% destroys equity value. Any return above 4.8% amplifies equity returns.
Takeaway: Leverage magnifies outcomes proportionally to the ratio employed. A 2x leveraged company experiences roughly double the volatility in return on equity (ROE) compared to an unleveraged competitor.
Understanding risk management becomes essential when employing leverage strategies.
Degree of Financial Leverage (DFL)
While the leverage ratio measures capital structure, the Degree of Financial Leverage (DFL) quantifies how sensitive earnings per share (EPS) are to changes in operating income.
DFL Formula
DFL = EBIT ÷ (EBIT – Interest Expense)
Where:
- EBIT = Earnings Before Interest and Taxes (operating income)
- Interest Expense = Total interest costs on debt
Interpreting DFL
A DFL of 2.0 means that a 10% increase in EBIT produces a 20% increase in EPS. Conversely, a 10% decrease in EBIT causes a 20% decrease in EPS.
Example Calculation:
The company has:
- EBIT: $200,000
- Interest Expense: $50,000
DFL = $200,000 ÷ ($200,000 - $50,000)
DFL = $200,000 ÷ $150,000
DFL = 1.33
A 1.33 DFL indicates moderate financial leverage. Every 1% change in EBIT produces a 1.33% change in earnings available to equity holders.
Why DFL Matters
DFL reveals earnings volatility. Companies with high interest expenses relative to EBIT experience dramatic swings in profitability from small changes in operations.
Low DFL (1.0-1.5): Stable earnings, low financial risk
Moderate DFL (1.5-2.5): Moderate earnings volatility
High DFL (2.5+): High earnings volatility, significant financial risk
The degree of operating leverage combines with DFL to determine total business risk.
Real-World Examples of Financial Leverage
Theory becomes concrete through actual applications across different scenarios.
Example 1: Real Estate Investment
Scenario: An investor purchases a $400,000 rental property.
Option A (No Leverage):
- Cash payment: $400,000
- Annual rental income: $32,000
- Annual expenses: $12,000
- Net income: $20,000
- Cash-on-cash return: 5% ($20,000 ÷ $400,000)
Option B (With Leverage):
- Down payment: $80,000 (20%)
- Mortgage: $320,000 at 4.5% interest
- Annual rental income: $32,000
- Annual expenses: $12,000
- Annual mortgage interest (year 1): ~$14,400
- Net income: $5,600
- Cash-on-cash return: 7% ($5,600 ÷ $80,000)
Additionally, the investor benefits from:
- Principal paydown (wealth building through forced savings)
- Property appreciation on the full $400,000 value
- Tax deductions on mortgage interest
If the property appreciates 5% ($20,000):
- Unleveraged return: 5% on $400,000 investment
- Leveraged return: 25% on $80,000 investment ($20,000 appreciation ÷ $80,000 invested)
This demonstrates why real estate investors favor leverage; appreciation multiplies on the full asset value while equity investment remains minimal. Similar principles apply when evaluating assets versus liabilities in personal finance.
Example 2: Corporate Expansion
TechCorp wants to expand manufacturing capacity, requiring $10 million investment projected to generate 18% annual returns.
Scenario A (Equity Financing):
- Issue new shares: $10 million
- Annual return: $1.8 million
- Dilution to existing shareholders
- No fixed obligations
Scenario B (Debt Financing):
- Borrow $10 million at 7% interest
- Annual return: $1.8 million
- Interest expense: $700,000
- Net benefit to existing shareholders: $1.1 million
- No dilution
- Fixed interest obligation
TechCorp chooses debt because:
- Return on investment (18%) exceeds cost of debt (7%)
- Existing shareholders capture the 11% spread
- Interest is tax-deductible, reducing effective cost to ~5.25% (assuming 25% tax rate)
However, TechCorp now has $700,000 in fixed annual obligations regardless of performance.
Example 3: Leveraged Buyout (LBO)
Private equity firms use leverage extensively in acquisitions.
Acquisition Structure:
- Target company price: $100 million
- Private equity contribution: $30 million (30%)
- Debt financing: $70 million (70%)
- Leverage ratio: 2.33x ($70M debt ÷ $30M equity)
5-Year Outcome:
- Company value grows to $150 million
- Debt paid down to $50 million through cash flow
- Equity value: $100 million ($150M – $50M debt)
Returns:
- Total gain: $70 million ($100M – $30M initial investment)
- Return on equity: 233% over 5 years
- Annualized return: ~27%
Without leverage (all-equity $100M purchase):
- Equity value: $150 million
- Total gain: $50 million
- Return: 50% over 5 years
- Annualized return: ~8.4%
Leverage transformed an 8.4% annualized return into 27%, but only because the company generated sufficient cash flow to service debt, and the exit valuation exceeded the purchase price.
Industry-Specific Leverage Benchmarks
Optimal leverage varies dramatically by industry due to differences in asset stability, cash flow predictability, and capital intensity.
Capital-Intensive Industries (High Leverage Tolerance)
Utilities: 3.0-5.0x leverage ratio
- Regulated, predictable cash flows
- Essential services with stable demand
- Hard assets (power plants, infrastructure)
Telecommunications: 2.5-4.0x
- Recurring subscription revenue
- High infrastructure costs
- Stable customer bases
Real Estate (REITs): 2.0-3.0x
- Income-producing properties
- Predictable rental cash flows
- Tangible collateral for lenders
Moderate Leverage Industries
Manufacturing: 1.5-2.5x
- Cyclical but established demand
- Physical assets for collateral
- Working capital requirements
Retail: 1.5-2.0x
- Inventory and real estate assets
- Consumer spending volatility
- Seasonal cash flow patterns
Low Leverage Industries
Technology/Software: 0.5-1.5x
- Intangible assets (difficult collateral)
- Rapid industry changes
- Often cash-rich from operations
Biotechnology: 0.5-1.0x
- High R&D risk
- Uncertain revenue timelines
- Limited tangible assets
Professional Services: 0.5-1.2x
- Human capital (non-collateralizable)
- Project-based revenue
- Low asset bases
Leverage Ratio Comparison Table
| Industry | Typical Leverage Ratio | Debt-to-Equity | Risk Level |
|---|---|---|---|
| Utilities | 3.5-4.5x | 2.5-3.5 | Low |
| Telecom | 2.5-3.5x | 1.5-2.5 | Low-Moderate |
| REITs | 2.0-3.0x | 1.0-2.0 | Moderate |
| Manufacturing | 1.8-2.3x | 0.8-1.3 | Moderate |
| Retail | 1.5-2.0x | 0.5-1.0 | Moderate-High |
| Technology | 1.0-1.5x | 0.0-0.5 | Variable |
| Biotech | 0.5-1.0x | 0.0-0.3 | High |
Context matters: A 3.0x leverage ratio signals distress for a software company but represents conservative financing for a utility.
Investors must compare companies within their industry peer groups, not across sectors. Understanding balance sheet basics helps contextualize these industry differences.
Evaluating Leverage Sustainability: Interest Coverage Ratio
A company’s leverage ratio reveals capital structure, but the Interest Coverage Ratio determines whether that debt load is sustainable.
Interest Coverage Formula
Interest Coverage Ratio = EBIT ÷ Interest Expense
This measures how many times over a company can pay its interest obligations from operating income.
Interpretation Guidelines
- Below 1.5x: Financial distress; insufficient earnings to cover interest
- 1.5-2.5x: Vulnerable; limited cushion for downturns
- 2.5-4.0x: Adequate; reasonable safety margin
- 4.0-8.0x: Strong; comfortable debt service capacity
- Above 8.0x: Conservative; potentially underleveraged
Practical Example
Company Alpha:
- EBIT: $500,000
- Interest Expense: $125,000
- Interest Coverage: 4.0x ($500,000 ÷ $125,000)
Company Alpha generates $4 of operating income for every $1 of interest expense, a healthy cushion.
Company Beta:
- EBIT: $500,000
- Interest Expense: $350,000
- Interest Coverage: 1.43x ($500,000 ÷ $350,000)
Company Beta barely covers interest payments. A 30% decline in EBIT would eliminate the ability to service debt, triggering potential default.
Why This Ratio Matters More Than Leverage Ratios Alone
Two companies can have identical 2.5x leverage ratios but vastly different risk profiles:
Company 1:
- Assets: $10M
- Equity: $4M
- Debt: $6M at 4% = $240,000 interest
- EBIT: $1.2M
- Interest Coverage: 5.0x (healthy)
Company 2:
- Assets: $10M
- Equity: $4M
- Debt: $6M at 8% = $480,000 interest
- EBIT: $600,000
- Interest Coverage: 1.25x (distressed)
Same leverage ratio, completely different risk levels due to profitability and interest rate differences.
Insight: Leverage ratios show capital structure; interest coverage ratios reveal sustainability. Both are essential for complete risk assessment.
The current ratio and quick ratio provide additional liquidity perspectives on debt service capacity.
Advantages and Disadvantages of Financial Leverage
Financial leverage presents a clear trade-off between potential returns and risk exposure.
Advantages
1. Amplified Returns on Equity
When asset returns exceed debt costs, the spread accrues entirely to equity holders, multiplying ROE substantially beyond what unleveraged operations could achieve.
2. Tax Efficiency
Interest payments are tax-deductible expenses, reducing the effective cost of debt. At a 25% corporate tax rate, 6% debt costs only 4.5% after tax benefits.
3. Preserved Ownership
Debt financing allows growth without diluting existing shareholders’ ownership percentages or control, unlike equity issuance.
4. Capital Availability
Leverage enables companies to pursue opportunities exceeding their internal capital resources, accelerating growth timelines.
5. Disciplined Capital Allocation
Fixed debt obligations force management discipline in capital deployment and operational efficiency to ensure debt service capacity.
Disadvantages
1. Magnified Losses
The same mechanism that amplifies gains multiplies losses identically. Poor performance combined with high leverage can eliminate equity value rapidly.
2. Fixed Obligations
Interest and principal payments are contractual obligations regardless of business performance, creating financial risk during downturns.
3. Reduced Flexibility
High debt levels limit strategic options, restrict additional borrowing capacity, and may include restrictive covenants limiting management decisions.
4. Bankruptcy Risk
Inability to service debt triggers default, potentially leading to bankruptcy, asset liquidation, and total equity loss.
5. Higher Cost of Capital
As leverage increases, both debt and equity become more expensive due to increased risk, potentially offsetting return benefits.
6. Earnings Volatility
Leverage increases earnings volatility substantially, making financial performance less predictable and potentially reducing valuation multiples.
The Optimal Leverage Balance
The ideal leverage level maximizes firm value by balancing tax benefits and return amplification against financial distress costs and bankruptcy risk.
This optimal point varies by:
- Industry characteristics
- Business cycle position
- Asset tangibility
- Cash flow stability
- Growth opportunities
- Management risk tolerance
There is no universal “correct” leverage ratio, only appropriate ranges for specific contexts.
Financial Leverage vs Operating Leverage
While financial leverage involves debt, operating leverage relates to fixed costs in business operations. Together, they determine total business risk.
Operating Leverage Defined
Operating leverage measures the proportion of fixed costs to variable costs in a company’s cost structure. High operating leverage means a large portion of costs remains constant regardless of sales volume.
Degree of Operating Leverage (DOL):
DOL = Contribution Margin ÷ Operating IncomeOr:
DOL = % Change in EBIT ÷ % Change in SalesCombined Leverage Effect
Degree of Combined Leverage (DCL) measures total volatility:
DCL = DOL × DFLExample:
- DOL = 2.0 (a 10% sales change produces 20% EBIT change)
- DFL = 1.5 (a 10% EBIT change produces 15% EPS change)
- DCL = 3.0 (a 10% sales change produces 30% EPS change)
Risk Implications
Companies with both high operating and financial leverage experience extreme earnings volatility. A small revenue decline cascades through fixed operating costs and fixed interest expenses, devastating equity returns.
Risk Matrix:
| Operating Leverage | Financial Leverage | Total Risk |
|---|---|---|
| High | High | Extreme |
| High | Low | Moderate-High |
| Low | High | Moderate-High |
| Low | Low | Low |
Strategic consideration: Companies with high operating leverage (airlines, manufacturers) often maintain lower financial leverage to avoid excessive total risk. Conversely, companies with low operating leverage (software firms) can safely employ more financial leverage.
Understanding this interaction helps explain why capital structure varies so dramatically across industries.
How to Calculate and Analyze Financial Leverage for Investment Decisions
Investors should systematically evaluate leverage when analyzing potential investments.
Step-by-Step Analysis Framework
Step 1: Calculate the Leverage Ratio
Gather balance sheet data:
Financial Leverage Ratio = Total Assets ÷ Shareholders' EquityStep 2: Calculate Debt-to-Equity
Debt-to-Equity = Total Debt ÷ Total EquityStep 3: Assess Interest Coverage
From the income statement:
Interest Coverage = EBIT ÷ Interest ExpenseStep 4: Compare to Industry Benchmarks
Research industry-average ratios using:
- Financial databases (Bloomberg, FactSet)
- Industry reports
- Peer company analysis
- Credit rating agency publications
Step 5: Analyze Trends Over Time
Calculate ratios for the past 5 years to identify:
- Increasing leverage (potential risk buildup)
- Decreasing leverage (deleveraging, reduced risk)
- Stable ratios (consistent capital structure strategy)
Step 6: Evaluate Debt Maturity Profile
Review when debt comes due:
- Short-term refinancing risk
- Long-term obligations
- Maturity wall concentrations
Step 7: Assess Cash Flow Coverage
Beyond EBIT, examine:
Cash Flow to Debt = Operating Cash Flow ÷ Total DebtTarget: Above 20% annually indicates healthy debt service capacity.
Red Flags in Leverage Analysis
Warning signs:
- Leverage ratios are increasing while profitability declines
- Interest coverage below 2.5x
- Debt-to-equity above industry norms by 50%+
- Rising interest expenses with flat revenue
- Frequent debt refinancing
- Covenant violations or waivers
- Negative cash flow with high debt
Green Flags in Leverage Analysis
Positive indicators:
- Stable leverage with growing EBIT
- Interest coverage above 5.0x
- Conservative leverage relative to the industry
- Declining debt with stable operations
- Investment-grade credit ratings
- Positive free cash flow
- Manageable debt maturity schedule
Practical Application: Never evaluate leverage in isolation. Combine leverage analysis with profitability metrics, cash flow analysis, and competitive positioning for comprehensive assessment.
The Altman Z-Score incorporates leverage into a bankruptcy prediction model, providing an additional analytical perspective.
Financial Leverage in Personal Finance
Leverage principles apply beyond corporate finance to individual wealth building.
Mortgage Leverage
The most common personal leverage application is home financing.
Example:
- Home price: $400,000
- Down payment: $80,000 (20%)
- Mortgage: $320,000 at 3.5%
- Leverage ratio: 5.0x ($400,000 ÷ $80,000)
If the home appreciates 5% annually ($20,000):
- Unleveraged return: 5%
- Leveraged return: 25% ($20,000 ÷ $80,000 invested)
However, if the home depreciates 5%:
- Unleveraged loss: 5%
- Leveraged loss: 25%
The 20/4/10 rule for car buying and the 3x rent rule help individuals manage personal leverage responsibly.
Margin Trading
Investors can borrow against investment portfolios to purchase additional securities.
Typical margin structure:
- Initial margin: 50% (must put up half the purchase price)
- Maintenance margin: 25% (equity must stay above this level)
Example:
- Investor cash: $10,000
- Margin loan: $10,000
- Total investment: $20,000
- Leverage: 2.0x
If investments gain 15%:
- Portfolio value: $23,000
- Repay loan: $10,000 (plus interest)
- Remaining equity: ~$12,800
- Return: 28% (versus 15% unleveraged)
If investments lose 15%:
- Portfolio value: $17,000
- Repay loan: $10,000
- Remaining equity: ~$6,800
- Loss: 32% (versus 15% unleveraged)
Risk: A 50% decline triggers a margin call, forcing liquidation at the worst time.
Student Loans
Education financing represents leverage on human capital—borrowing against future earning potential.
Analysis framework:
- Total debt: $80,000
- Expected salary increase: $25,000/year
- Payback period: 3.2 years of incremental earnings
- “Return on investment”: Substantial if the degree increases lifetime earnings
However, unlike corporate assets, human capital cannot be liquidated, making education debt particularly risky if career outcomes disappoint.
Personal Leverage Guidelines
Healthy personal leverage:
- Housing costs ≤ 28% of gross income
- Total debt payments ≤ 36% of gross income
- Emergency fund covering 6+ months’ expenses
- Debt used for appreciating or income-producing assets
- Clear repayment plan with margin for error
Dangerous personal leverage:
- Consumer debt for depreciating assets
- Debt payments exceeding 40% of income
- No emergency reserves
- Variable-rate debt without rate caps
- Debt is growing faster than income
The 50/30/20 budgeting rule helps maintain balanced personal finances while managing leverage.
Common Mistakes in Leverage Analysis
Even experienced investors make errors when evaluating financial leverage.
Mistake 1: Ignoring Industry Context
Comparing a utility’s 4.0x leverage to a software company’s 1.2x leverage without context leads to false conclusions. Always benchmark within industry peer groups.
Mistake 2: Focusing Solely on Leverage Ratios
Capital structure ratios without profitability and cash flow analysis provide incomplete pictures. A company with 3.0x leverage and 8.0x interest coverage may be safer than one with 1.5x leverage and 1.8x interest coverage.
Mistake 3: Overlooking Off-Balance-Sheet Liabilities
Operating leases, pension obligations, and contingent liabilities create leverage-like risk without appearing in traditional leverage calculations. Read footnotes carefully.
Mistake 4: Assuming Debt Is Always Bad
Zero leverage often signals missed opportunities. Companies with strong cash flows and stable operations that avoid all debt may be underleveraged, leaving returns on the table.
Mistake 5: Neglecting Debt Maturity and Structure
$100 million in debt maturing in 10 years differs dramatically from $100 million due next year. Maturity profiles and refinancing risk matter enormously.
Mistake 6: Ignoring Interest Rate Environments
Low-rate environments make leverage appear safer than it is. When rates rise, debt service costs increase, potentially turning sustainable leverage into distress.
Mistake 7: Forgetting the Amplification Works Both Ways
Investors attracted to leverage’s upside potential often underestimate downside amplification. Model both scenarios before deploying leverage.
Conclusion: Mastering the Math Behind Financial Leverage
Financial leverage represents one of finance’s most powerful tools—and one of its most dangerous when misunderstood or misapplied.
The mathematics are straightforward: borrowing capital to finance assets amplifies returns when asset returns exceed debt costs. A 2.5x leveraged company can transform a 15% asset return into a 35% equity return. But that same leverage transforms a 5% loss into a 20% equity loss.
The key insights:
- Leverage is neutral—neither inherently good nor bad. Its value depends entirely on context: industry norms, profitability, cash flow stability, and interest rates.
- Measurement requires multiple ratios: leverage ratio, debt-to-equity, interest coverage, and cash flow metrics together reveal the complete picture.
- Industry context is essential: A 3.5x ratio signals conservatism for utilities but distress for software companies.
- Sustainability matters more than structure: A company with 4x leverage and 8x interest coverage is safer than one with 2x leverage and 1.5x interest coverage.
- The amplification effect works identically in both directions: Model downside scenarios as carefully as upside projections.
Actionable next steps:
For investors: Add leverage analysis to your investment checklist. Calculate leverage ratio, debt-to-equity, and interest coverage for every stock you evaluate. Compare results to industry benchmarks before making decisions.
For business owners: Evaluate your current capital structure. Calculate your leverage ratios and interest coverage. Determine whether you’re underleveraged (missing growth opportunities) or overleveraged (exposing the business to unnecessary risk).
For individuals: Audit your personal leverage. Calculate total debt-to-income ratios. Ensure debt finances appreciating assets or income-producing opportunities, not consumption.
Continue learning: Study capital allocation strategies and enterprise value to deepen your understanding of corporate finance fundamentals.
Financial leverage, when understood through data-driven analysis and applied with discipline, becomes a powerful wealth-building mechanism. When misunderstood or misapplied, it destroys capital with mathematical precision.
Master the math behind money. Understand the formulas. Respect the risks. Deploy leverage strategically.
The difference between financial success and failure often comes down to understanding this single concept.
📊 Financial Leverage Calculator
Calculate leverage ratios and assess financial risk
📈 Analysis
References
[1] Corporate Finance Institute. “Financial Leverage.” CFI Education Inc., 2025.
[2] Investopedia. “Leverage Ratio: What It Is, What It Tells You, How to Calculate.” Dotdash Meredith, 2025.
[3] CFA Institute. “Capital Structure and Leverage.” CFA Program Curriculum, 2025.
[4] Damodaran, Aswath. “Debt and Value: Beyond Modigliani and Miller.” Stern School of Business, NYU, 2025.
[5] Federal Reserve Bank. “Financial Leverage and Business Cycles.” Federal Reserve Economic Data, 2025.
[6] Moody’s Investors Service. “Rating Methodology: Global Manufacturing Companies.” Moody’s Corporation, 2025.
[7] S&P Global Ratings. “Corporate Methodology: Ratios and Adjustments.” S&P Global, 2025.
About the Author
Max Fonji is a data-driven financial educator and the voice behind The Rich Guy Math. With expertise in corporate finance, valuation analysis, and evidence-based investing, Max translates complex financial concepts into clear, actionable insights. His mission: teaching the math behind money through precision, logic, and calm confidence.
Educational Disclaimer
This article is provided for educational and informational purposes only and does not constitute financial, investment, tax, or legal advice. The content presents general information about financial leverage concepts, formulas, and examples to enhance financial literacy.
Financial leverage involves significant risks, including potential loss of capital. Individual circumstances, risk tolerance, industry factors, and market conditions vary substantially. Before making any financial decisions involving leverage, whether corporate or personal, consult with qualified financial advisors, accountants, and legal professionals.
Past performance does not guarantee future results. All examples are hypothetical and for illustrative purposes only. The Rich Guy Math and its authors assume no liability for decisions made based on this content.
Always conduct thorough due diligence and seek professional guidance appropriate to your specific situation.
Frequently Asked Questions: Financial Leverage
What is financial leverage in simple terms?
Financial leverage is using borrowed money to increase potential investment returns. Instead of investing only your own capital, you add debt to control more assets, amplifying both gains and losses proportionally.
What is a good financial leverage ratio?
A good leverage ratio depends entirely on industry context. Most industries operate safely in the 1.5–2.5x range, while utilities often run at 3–5x due to stable cash flows. Tech companies usually maintain less than 1.5x. Always compare ratios to industry peers.
How does financial leverage increase returns?
Leverage increases returns when the return on assets purchased with borrowed money is greater than the interest cost. For example, if a company earns 15% on its assets but pays only 5% on debt, the 10% spread boosts returns for equity holders.
What is the difference between financial leverage and operating leverage?
Financial leverage refers to using debt to finance assets. Operating leverage refers to the proportion of fixed costs in business operations. Financial leverage affects capital structure, while operating leverage affects cost structure. Together, they determine overall risk.
Can financial leverage be negative?
Leverage ratios themselves cannot be negative. However, if a company has negative equity—meaning liabilities exceed assets—the leverage ratio becomes meaningless or undefined, signaling serious financial distress.
How do you calculate the degree of financial leverage?
The Degree of Financial Leverage (DFL) formula is: EBIT ÷ (EBIT − Interest Expense). It measures how sensitive earnings per share are to changes in operating income.
Is high financial leverage always risky?
Not necessarily. The risk depends on interest coverage, cash flow stability, asset quality, and industry norms. A utility with 4x leverage but 7x interest coverage may be safer than a retailer with 2x leverage and only 2x interest coverage.
What happens when a company has too much leverage?
Too much leverage increases the risk of financial distress. Problems may include difficulty making debt payments, credit downgrades, operational restrictions, covenant violations, and possibly bankruptcy if obligations cannot be met.
How does financial leverage affect stock prices?
Financial leverage increases earnings volatility, which increases stock price volatility as well. Moderate leverage can boost valuations by increasing return on equity, but excessive leverage reduces valuations due to bankruptcy risk.
Should individual investors use leverage?
Individual leverage—such as mortgages or margin borrowing—can accelerate wealth building if used responsibly. However, it requires strong discipline, stable income, and cash reserves. Most investors should use leverage conservatively and only for appreciating or income-producing assets.
Related posts:
 What Is SmartPass? Raptor Digital Hall Pass Explained for K-12 Schools
 What Is the 3x Rent Rule & How to Calculate It (With Examples)
 Portfolio Income: Definition, Examples, Tax Rules, and Strategies
 Bookkeeping vs Accounting: What’s the Difference & Which Do You Need?
 What Is Profitability Analysis & How to Do It: Metrics, Example & Tips
 Emergency Fund vs Savings: What’s the Real Difference and Why It Matters