
When a company borrows money to fuel growth, it’s making a calculated bet: that the returns will exceed the cost of debt. The Financial Leverage Ratio quantifies this bet, revealing exactly how much a company relies on borrowed funds versus its own equity. Understanding this metric is fundamental to assessing financial risk, creditworthiness, and the potential for amplified returns or catastrophic losses.
This comprehensive guide breaks down the math behind financial leverage, showing how investors and business owners can use these ratios to make data-driven decisions about capital structure and risk management.
Key Takeaways
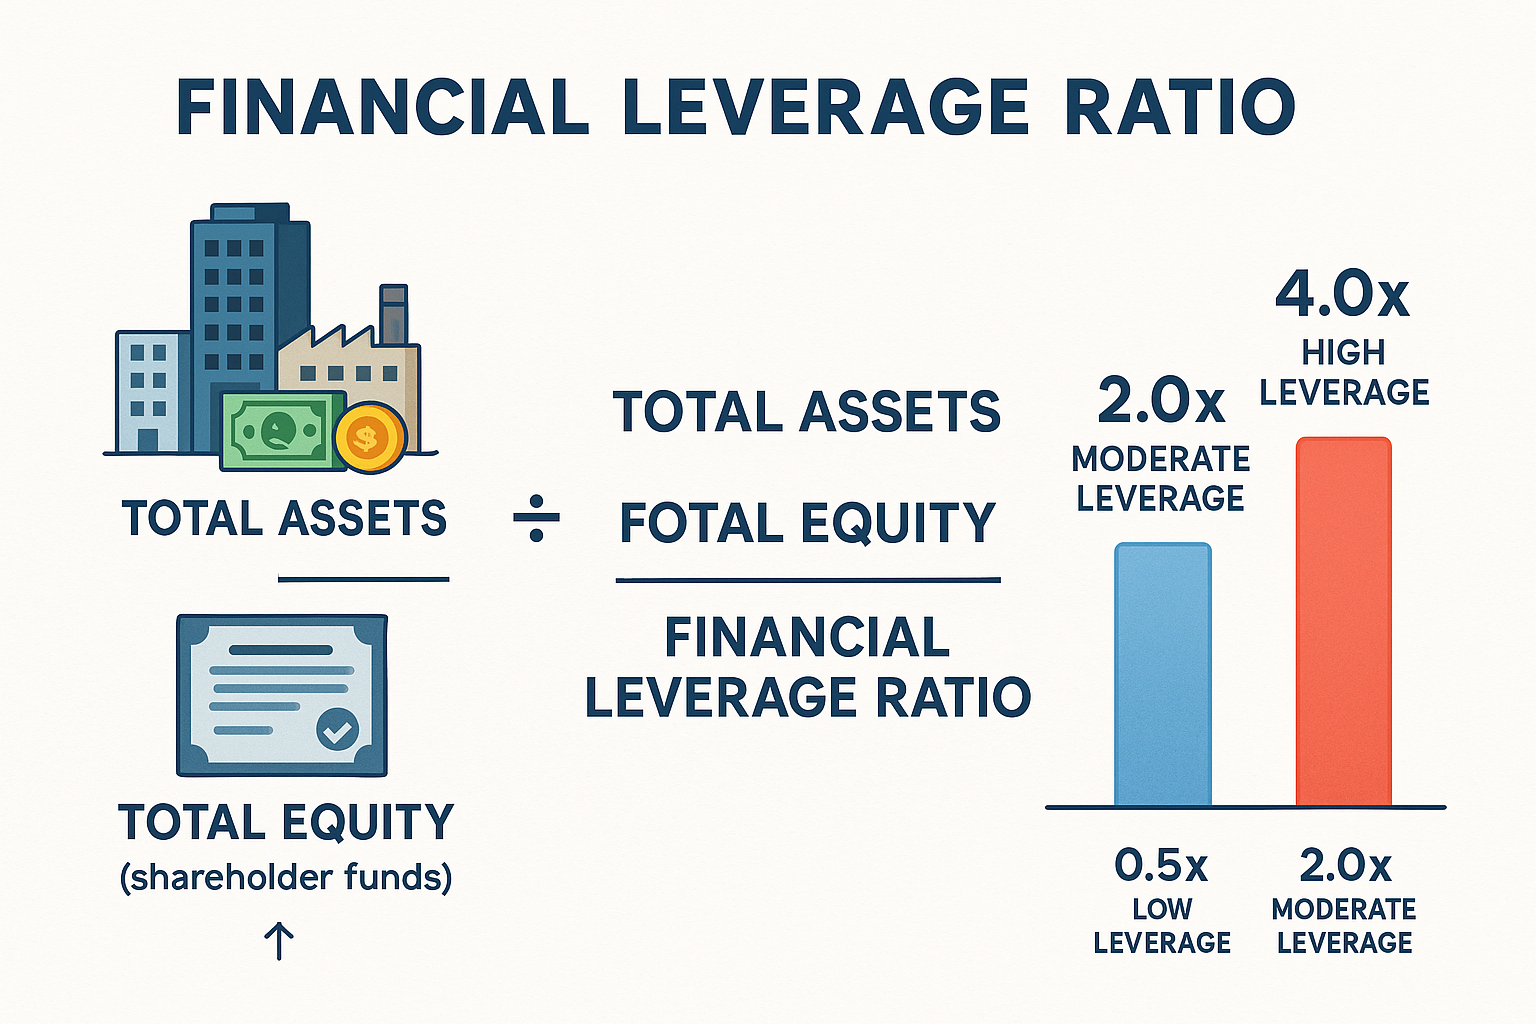
Financial Leverage Ratio measures debt reliance: Calculated as Total Assets ÷ Total Equity, it shows how many dollars of assets are funded by each dollar of shareholder equity.
Higher leverage amplifies both gains and losses: Companies with leverage ratios above 2.0x can generate superior returns during growth periods but face elevated bankruptcy risk during downturns.
Multiple leverage metrics provide a complete picture: Debt-to-Equity, Equity Multiplier, Degree of Financial Leverage (DFL), and Interest Coverage Ratio each reveal different aspects of financial risk.
Industry context matters significantly: Real estate and utilities typically operate with leverage ratios of 3.0-5.0x, while technology companies often maintain ratios below 1.5x.
Strategic leverage improves ROE when managed properly: When investment returns exceed interest costs, leverage enhances shareholder value, but excessive debt creates financial fragility.
What Is the Financial Leverage Ratio?
The Financial Leverage Ratio measures the proportion of a company’s assets financed through debt versus equity. In plain terms, it answers a critical question: For every dollar of shareholder money invested, how many total dollars of assets does the company control?
This ratio serves as a fundamental tool for understanding capital structure, the mix of debt and equity a company uses to fund operations and growth. A company with $10 million in total assets and $5 million in equity has a leverage ratio of 2.0x, meaning each equity dollar supports two dollars of assets.
Why this matters: Debt creates fixed obligations (interest payments) regardless of business performance. Companies with high leverage must generate sufficient cash flow to service debt, or they risk default and bankruptcy. Conversely, companies with low leverage sacrifice potential returns but maintain greater financial stability.
The concept connects directly to risk management principles, balancing potential rewards against downside exposure. Just as portfolio diversification reduces investment risk, appropriate leverage levels protect companies from financial distress while enabling growth.
The Core Financial Leverage Formula
The primary formula for calculating the Financial Leverage Ratio is:
Financial Leverage Ratio = Total Assets ÷ Total Equity
Where:
- Total Assets = Everything the company owns (cash, inventory, equipment, real estate, intellectual property)
- Total Equity = Shareholder ownership stake (assets minus liabilities)
Step-by-Step Calculation Example
Consider a manufacturing company with the following balance sheet data:
- Total Assets: $50 million
- Total Liabilities: $30 million
- Total Equity: $20 million
Calculation:
Financial Leverage Ratio = $50 million ÷ $20 million = 2.5x
Interpretation: This company controls $2.50 in assets for every $1.00 of equity. The remaining $1.50 per equity dollar comes from debt financing.
Alternative Leverage Formula
Another common approach directly measures debt relative to equity:
Financial Leverage Ratio = Total Debt ÷ Total Equity
Using the same example:
Financial Leverage Ratio = $30 million ÷ $20 million = 1.5x
This version shows that the company has $1.50 of debt for every $1.00 of equity, a different perspective on the same capital structure. Both formulas provide valuable insights, and analysts often use them together for comprehensive analysis.
The relationship between these formulas follows basic accounting logic: Total Assets = Total Liabilities + Total Equity. Therefore, the asset-based formula inherently captures both debt and equity components.
Understanding these calculations connects to broader investing fundamentals; the same analytical thinking used to evaluate individual companies applies when selecting investment vehicles.
Types of Financial Leverage Ratios
Financial leverage analysis extends beyond the basic formula. Multiple ratios examine different aspects of a company’s debt structure and risk profile.
1. Debt-to-Equity Ratio
Formula: Total Debt ÷ Total Equity
This ratio directly compares borrowed funds to shareholder investment. A debt-to-equity ratio of 0.5 indicates the company uses 50 cents of debt for every dollar of equity, conservative financing. A ratio of 2.0 signals aggressive leverage, with twice as much debt as equity.
Practical application: Lenders scrutinize this ratio when evaluating loan applications. Ratios above 2.0x typically trigger higher interest rates or loan denial, as they indicate elevated default risk.
2. Equity Multiplier
Formula: Total Assets ÷ Total Equity
The equity multiplier represents the same calculation as the primary leverage ratio, but emphasizes how equity “multiplies” to control larger asset bases. An equity multiplier of 3.0x means shareholders control three dollars of assets for each equity dollar invested.
This metric directly connects to Return on Equity (ROE) through the DuPont Analysis framework, showing how leverage amplifies profitability metrics.
3. Degree of Financial Leverage (DFL)
Formula: EBIT ÷ (EBIT – Interest Expense)
Where EBIT = Earnings Before Interest and Taxes
The DFL measures earnings sensitivity to operating income changes. A DFL of 1.25 means a 10% increase in EBIT produces a 12.5% increase in earnings per share (EPS), demonstrating leverage’s magnification effect.
Example calculation:
- EBIT: $10 million
- Interest Expense: $2 million
- DFL = $10M ÷ ($10M – $2M) = 1.25x
This ratio proves particularly valuable for understanding how business cycle fluctuations impact shareholder returns. Companies with high DFL experience dramatic EPS swings during economic expansions and contractions.
4. Interest Coverage Ratio
Formula: EBITDA ÷ Interest Expense
This ratio assesses whether a company generates sufficient earnings to cover interest obligations. A coverage ratio of 5.0x means the company earns five dollars for every dollar of interest expense, providing a substantial safety margin.
Risk thresholds:
- Above 5.0x: Healthy coverage, low default risk
- 2.0x – 5.0x: Adequate but requires monitoring
- Below 2.0x: Distressed, high default probability
Credit rating agencies heavily weight interest coverage when assigning corporate debt ratings. Companies with coverage below 2.0x often receive junk bond status, significantly increasing borrowing costs.
5. Debt-to-Capital Ratio
Formula: Total Debt ÷ (Total Debt + Total Equity)
This ratio expresses debt as a percentage of total capitalization. A result of 0.60 (or 60%) indicates that debt represents 60% of the company’s capital structure, with equity comprising the remaining 40%.
Strategic insight: Companies targeting specific capital structures use this ratio for decision-making. A firm seeking a 50/50 debt-equity balance would maintain a debt-to-capital ratio of 0.50.
Understanding these various ratios connects to broader valuation principles; comprehensive financial analysis requires examining multiple metrics to build a complete understanding.
How to Interpret Financial Leverage Ratios
Raw numbers mean little without context. Interpreting leverage ratios requires understanding industry norms, business models, and economic conditions.
Low Leverage (Ratio < 1.5x)
Companies with leverage ratios below 1.5x use predominantly equity financing. This conservative approach offers several advantages:
- Lower bankruptcy risk: Minimal debt obligations reduce financial distress probability
- Greater financial flexibility: Easier to weather economic downturns
- Reduced interest burden: More earnings flow to shareholders rather than creditors
Disadvantages:
- Lower ROE potential: Foregone opportunity to amplify returns
- Diluted ownership: Raising equity capital reduces existing shareholder stakes
- Underutilized tax benefits: Interest expense provides tax deductions that equity doesn’t
Technology companies frequently operate with low leverage because their primary assets (intellectual property, human capital) don’t serve as effective loan collateral. Additionally, rapid growth opportunities make maintaining financial flexibility valuable.
Moderate Leverage (Ratio 1.5x – 2.5x)
This range represents balanced capital structures common among established corporations. Companies achieve:
- Optimized ROE: Leverage amplifies returns without excessive risk
- Tax efficiency: Interest deductions reduce effective tax rates
- Disciplined capital allocation: Debt obligations force management to focus on cash generation
The 50/30/20 rule budgeting principle applies at the corporate level; balanced allocation between equity, debt, and retained earnings creates sustainable financial structures.
High Leverage (Ratio > 2.5x)
Leverage ratios exceeding 2.5x indicate aggressive debt usage. While potentially lucrative during growth periods, high leverage creates significant risks:
- Amplified losses: Downturns produce magnified negative effects on equity
- Financial inflexibility: Limited capacity to raise additional capital during stress
- Bankruptcy vulnerability: Small revenue declines can trigger debt covenant violations
When high leverage makes sense:
- Stable, predictable cash flows (utilities, real estate)
- Asset-heavy businesses with tangible collateral
- Mature industries with limited growth capital needs
Real estate investment trusts (REITs) commonly operate with leverage ratios of 3.0x-5.0x because property generates consistent rental income and serves as loan collateral. Understanding the best REITs to invest in requires evaluating their leverage profiles alongside other metrics.
Industry Benchmarks
| Industry | Typical Leverage Ratio | Reasoning |
|---|---|---|
| Technology | 0.8x – 1.5x | Intangible assets, high growth needs |
| Manufacturing | 1.5x – 2.5x | Moderate capital intensity |
| Utilities | 2.5x – 4.0x | Stable cash flows, regulated returns |
| Real Estate | 3.0x – 5.0x | Property collateral, predictable income |
| Financial Services | 8.0x – 15.0x | Leverage is the business model |
Critical insight: Never evaluate leverage in isolation. A 4.0x ratio signals danger for a software company but normalcy for a utility. Industry context determines appropriate leverage levels.
Real-World Financial Leverage Examples
Theory becomes clear through practical application. These examples demonstrate how leverage ratios work across different scenarios.
Example 1: Conservative Technology Startup
Company Profile: Software-as-a-service (SaaS) company, three years post-launch
Balance Sheet:
- Total Assets: $5 million
- Total Liabilities: $1 million
- Total Equity: $4 million
Calculations:
- Financial Leverage Ratio = $5M ÷ $4M = 1.25x
- Debt-to-Equity = $1M ÷ $4M = 0.25x
Analysis: This company uses minimal debt, relying primarily on equity funding (likely venture capital). The low leverage provides flexibility to invest aggressively in growth without debt service constraints. However, equity investors accept dilution in exchange for this financial stability.
This approach mirrors principles discussed in active vs passive income strategies, prioritizing long-term value creation over short-term optimization.
Example 2: Established Manufacturing Corporation
Company Profile: Industrial equipment manufacturer, 25-year operating history
Balance Sheet:
- Total Assets: $200 million
- Total Liabilities: $120 million
- Total Equity: $80 million
Calculations:
- Financial Leverage Ratio = $200M ÷ $80M = 2.5x
- Debt-to-Equity = $120M ÷ $80M = 1.5x
- Interest Coverage = $30M EBITDA ÷ $5M Interest = 6.0x
Analysis: Moderate leverage optimizes the capital structure. The 6.0x interest coverage provides a comfortable safety margin, while the 2.5x leverage ratio amplifies return on equity (ROE) beyond what equity-only financing would achieve. This company successfully balances growth and stability.
Example 3: Real Estate Investment Trust (REIT)
Company Profile: Commercial property REIT specializing in office buildings
Balance Sheet:
- Total Assets: $1 billion
- Total Liabilities: $700 million
- Total Equity: $300 million
Calculations:
- Financial Leverage Ratio = $1,000M ÷ $300M = 3.33x
- Debt-to-Equity = $700M ÷ $300M = 2.33x
- Debt-to-Capital = $700M ÷ $1,000M = 70%
Analysis: High leverage is standard for REITs because:
- Properties generate predictable rental income
- Real estate serves as excellent loan collateral
- Leverage magnifies dividend yields for shareholders
- Tax structure requires distributing 90% of income as dividends
Despite the 3.33x leverage ratio appearing risky in isolation, it’s appropriate given the business model and industry norms. The key is maintaining sufficient interest coverage and property occupancy rates.
Example 4: Degree of Financial Leverage Impact
Scenario: Two identical companies with different capital structures
Company A (Low Leverage):
- EBIT: $10 million
- Interest Expense: $1 million
- DFL = $10M ÷ ($10M – $1M) = 1.11x
Company B (High Leverage):
- EBIT: $10 million
- Interest Expense: $4 million
- DFL = $10M ÷ ($10M – $4M) = 1.67x
Impact Analysis:
If EBIT increases 20% to $12 million:
- Company A EPS increases: 20% × 1.11 = 22.2%
- Company B EPS increases: 20% × 1.67 = 33.4%
If EBIT decreases 20% to $8 million:
- Company A EPS decreases: 20% × 1.11 = 22.2%
- Company B EPS decreases: 20% × 1.67 = 33.4%
Takeaway: Company B’s higher leverage creates greater earnings volatility, amplifying both gains and losses. Investors seeking stable returns prefer Company A, while those accepting higher risk for potential upside favor Company B.
This principle extends to personal finance decisions like understanding assets vs liabilities; leverage magnifies outcomes in both directions.
The Strategic Use of Financial Leverage
Leverage isn’t inherently good or bad; it’s a tool that requires skillful application. Strategic leverage deployment can create substantial shareholder value when executed properly.
When Leverage Creates Value
Condition 1: Return on Assets Exceeds Cost of Debt
If a company earns 12% on assets while paying 5% interest on debt, leverage creates a positive spread of 7%. Each borrowed dollar generates excess returns flowing to equity holders.
Mathematical proof:
- Borrow $100 at 5% interest = $5 annual cost
- Invest $100 in assets earning 12% = $12 annual return
- Net benefit to equity holders = $7 per $100 borrowed
This principle mirrors compound growth concepts; small advantages compound into significant wealth over time.
Condition 2: Stable, Predictable Cash Flows
Companies with consistent revenue streams can reliably service debt obligations. Utilities, consumer staples, and infrastructure businesses exemplify this profile. Predictability reduces default risk, making higher leverage ratios sustainable.
Condition 3: Tax Benefits Optimization
Interest expense is tax-deductible, while dividend payments are not. A company in the 25% tax bracket effectively pays only 75% of stated interest rates after tax benefits.
Example:
- Stated interest rate: 6%
- Tax rate: 25%
- After-tax cost of debt: 6% × (1 – 0.25) = 4.5%
This tax shield increases leverage attractiveness, particularly for profitable companies in high-tax jurisdictions.
When Leverage Destroys Value
Scenario 1: Excessive Debt During Downturns
The 2008 financial crisis demonstrated the dark side. Lehman Brothers operated with leverage ratios exceeding 30x, meaning each dollar of equity supported $30 in assets. When asset values declined just 3.3%, the entire equity base evaporated, triggering bankruptcy.
Scenario 2: Covenant Violations and Restructuring
Debt agreements include covenants, financial metrics that companies must maintain. Violations trigger penalties, higher interest rates, or immediate repayment demands. Companies struggling with excessive leverage often enter death spirals:
- Business deterioration reduces cash flow
- Covenant violations occur
- Lenders demand immediate repayment or impose punitive terms
- The company was forced into bankruptcy or distressed asset sales
Scenario 3: Opportunity Cost During Growth Periods
Highly leveraged companies lack financial flexibility to pursue attractive opportunities. When competitors invest in innovation or acquisitions, debt-constrained firms watch from the sidelines.
This connects to capital allocation strategies; maintaining optionality often proves more valuable than maximizing current leverage.
Optimal Leverage Determination
No universal “correct” leverage ratio exists. Optimal levels depend on:
- Industry characteristics: Capital intensity, competitive dynamics, regulatory environment
- Business maturity: Startups require flexibility; mature firms can support more debt
- Economic conditions: Low-interest-rate environments favor higher leverage
- Management philosophy: Risk tolerance and strategic priorities
- Asset tangibility: Physical assets support higher leverage than intangibles
Framework for evaluation:
- Calculate industry median leverage ratios
- Assess company-specific risk factors (customer concentration, technological disruption, regulatory exposure)
- Stress-test cash flows under recession scenarios
- Ensure interest coverage remains above 3.0x in downside cases
- Maintain covenant compliance with 20%+ safety margins
Financial Leverage and Return on Equity
Leverage directly impacts Return on Equity (ROE), a critical profitability metric. The DuPont Analysis framework decomposes ROE into three components:
ROE = Net Profit Margin × Asset Turnover × Equity Multiplier
Where Equity Multiplier = Total Assets ÷ Total Equity (the leverage ratio)
Leverage’s ROE Amplification Effect
Example Comparison:
Company X (No Leverage):
- Total Assets: $100 million (100% equity-financed)
- Net Income: $10 million
- ROE = $10M ÷ $100M = 10%
Company Y (2x Leverage):
- Total Assets: $100 million (50% equity, 50% debt)
- Equity: $50 million
- Debt: $50 million at 5% interest
- Operating Income (before interest): $10 million
- Interest Expense: $2.5 million
- Net Income: $7.5 million
- ROE = $7.5M ÷ $50M = 15%
Despite earning lower absolute profits ($7.5M vs. $10M), Company Y delivers superior ROE (15% vs. 10%) because leverage concentrates returns on a smaller equity base.
Critical caveat: This advantage only persists when return on assets exceeds debt costs. If operating income falls below interest expense, leverage magnifies losses and destroys equity value.
Understanding this relationship helps when evaluating dividend growth stocks; companies using leverage strategically can sustain higher dividend growth rates.
Regulatory Leverage Requirements
Certain industries face regulatory leverage limits to protect financial system stability.
Banking Sector: Basel III Framework
The 2008 financial crisis exposed dangerous leverage levels in banking. The Basel III international regulatory framework now mandates:
Tier 1 Leverage Ratio = Tier 1 Capital ÷ Total Consolidated Assets ≥ 3%
This requirement limits banks to a maximum 33x leverage (1 ÷ 0.03 = 33.3x). While still high compared to other industries, it represents a significant reduction from pre-crisis levels when major banks exceeded 50x leverage.
Tier 1 Capital includes:
- Common stock
- Retained earnings
- Certain preferred stock
This high-quality capital must comprise at least 3% of total assets, ensuring banks maintain meaningful equity cushions.
Insurance Companies
Insurance regulators use Risk-Based Capital (RBC) requirements that adjust leverage limits based on asset risk profiles. Riskier investment portfolios require higher capital ratios, while conservative bond-heavy portfolios permit more leverage.
Real Estate and Mortgage Lending
Loan-to-Value (LTV) ratios limit leverage for property purchases. Typical requirements:
- Primary residence mortgages: 80% LTV maximum (5x leverage)
- Investment properties: 70-75% LTV maximum (3-4x leverage)
- Commercial real estate: 65-75% LTV maximum
These limits protect both borrowers and lenders from excessive leverage-induced defaults. The 3x rent rule applies similar logic to household budgeting—limiting housing costs relative to income prevents financial distress.
Calculating and Monitoring Your Leverage Ratio
For business owners and investors, regular leverage monitoring provides early warning of financial deterioration.
Data Collection Process
Step 1: Gather Balance Sheet Information
Obtain the most recent balance sheet from:
- Company financial statements (10-K, 10-Q for public companies)
- Internal accounting systems (for private businesses)
- Financial databases (Bloomberg, FactSet, SEC EDGAR)
Step 2: Identify Relevant Line Items
- Total Assets: Sum of current assets + non-current assets
- Total Liabilities: Sum of current liabilities + long-term debt
- Total Equity: Also called “Shareholders’ Equity” or “Net Worth”
Step 3: Verify Accounting Equation
Confirm: Total Assets = Total Liabilities + Total Equity
If this doesn’t balance, data errors exist requiring correction.
Calculation Execution
Using the formulas discussed earlier:
- Primary Leverage Ratio = Total Assets ÷ Total Equity
- Debt-to-Equity = Total Liabilities ÷ Total Equity
- Debt-to-Capital = Total Liabilities ÷ (Total Liabilities + Total Equity)
Trend Analysis
Single-point measurements provide limited insight. Track leverage ratios quarterly over 3-5 years to identify:
- Increasing leverage: A Potential warning sign of deteriorating financial health or aggressive growth strategy
- Decreasing leverage: May indicate deleveraging after a crisis or a conservative management approach
- Stable leverage: Suggests a consistent capital structure policy
Red flags requiring investigation:
- Leverage ratio increases >20% year-over-year
- Debt-to-equity exceeds industry median by >50%
- Interest coverage falls below 3.0x
- Leverage rises while revenues/profits decline
This analytical approach mirrors the discipline required for dollar cost averaging; consistent monitoring and systematic decision-making produce superior outcomes.
Common Mistakes in Leverage Analysis
Even experienced analysts make errors when evaluating financial leverage. Avoiding these pitfalls improves decision accuracy.
Mistake 1: Ignoring Off-Balance-Sheet Liabilities
Companies sometimes structure obligations to avoid balance sheet recognition. Common examples:
- Operating leases (though new accounting standards now require capitalization)
- Pension obligations (unfunded liabilities)
- Guarantees and contingent liabilities
- Special-purpose entities
Solution: Read financial statement footnotes thoroughly. Calculate adjusted leverage ratios, including off-balance-sheet items, for complete risk assessment.
Mistake 2: Comparing Across Industries Without Context
A 3.5x leverage ratio signals distress for a technology company but normalcy for a utility. Industry-specific factors, asset tangibility, cash flow stability, and competitive dynamics determine appropriate leverage levels.
Solution: Always benchmark against industry peers, not absolute thresholds. Use percentile rankings within industry groups.
Mistake 3: Focusing Solely on Leverage Ratios
Leverage ratios reveal capital structure but not operational performance. A company might have conservative 1.2x leverage yet terrible profitability and negative cash flow.
Solution: Combine leverage analysis with:
- Profitability metrics (EBITDA margins, ROE, earnings per share)
- Liquidity ratios (current ratio, quick ratio)
- Cash flow analysis (cash conversion cycle)
- Growth trends (revenue CAGR, market share)
Mistake 4: Neglecting Interest Rate Environment
A company with 4.0x leverage paying 3% interest faces vastly different risk than one paying 8% interest. Interest rate changes dramatically alter debt service burdens.
Solution: Calculate interest coverage ratios and stress-test under various rate scenarios. Consider refinancing risk, when does existing debt mature, and at what rates can it be refinanced?
Mistake 5: Overlooking Asset Quality
Not all assets equally support debt. Cash and marketable securities provide high-quality collateral, while goodwill and intangible assets offer minimal lending value.
Solution: Analyze asset composition. Calculate “tangible leverage” using only physical assets and financial instruments, excluding intangibles.
Interactive Financial Leverage Calculator
📊 Financial Leverage Ratio Calculator
Calculate multiple leverage metrics and assess financial risk
📈 Analysis
Financial Leverage in Personal Finance
While primarily discussed in corporate contexts, leverage principles apply equally to personal financial decisions.
Mortgage Leverage
Homeownership represents most individuals’ largest leverage position. A $400,000 home purchased with $80,000 down payment and $320,000 mortgage creates 5x leverage (total asset value ÷ equity invested).
Benefit: If the home appreciates 10% to $440,000, the equity position grows from $80,000 to $120,000, a 50% return on the initial investment. Leverage amplifies the gain.
Risk: If the home depreciates 10% to $360,000, equity falls from $80,000 to $40,000, a 50% loss. Leverage amplifies losses equally.
The 20/4/10 rule car buying applies similar thinking to vehicle purchases—limiting leverage reduces financial vulnerability.
Investment Account Margin
Brokerage margin accounts allow investors to borrow against portfolio holdings to purchase additional securities. Typical margin requirements permit 2:1 leverage (buying $2 in securities for every $1 of equity).
Danger: Margin calls occur when portfolio values decline below maintenance requirements. Investors must deposit additional funds or face forced liquidation, often at the worst possible time.
Historical example: During the 1929 stock market crash, widespread margin usage amplified losses. Investors who bought stocks with 10:1 leverage (legal at the time) faced complete wipeout from relatively modest market declines.
Student Loan Leverage
Education debt represents leverage on future earning potential. Students borrow today expecting enhanced career prospects to generate returns exceeding loan costs.
Positive outcome: Engineering student borrows $60,000, graduates earning $75,000 annually, loan represents 0.8x single-year earnings, easily serviceable.
Negative outcome: Student borrows $120,000 for a degree with limited job prospects, earns $35,000 annually, the loan represents 3.4x annual earnings, creating a severe financial burden.
The key difference from corporate leverage: human capital cannot be liquidated to repay debt. This makes educational leverage decisions particularly consequential.
Personal Leverage Guidelines
- Maintain total debt-to-income below 36%: Including mortgage, auto loans, student debt, and credit cards
- Limit mortgage to 28% of gross income: Prevents housing costs from consuming excessive resources
- Avoid consumer debt for depreciating assets: Cars, electronics, and vacations should not be financed
- Build an emergency fund before leveraging: 6-12 months’ expenses provides a safety buffer
- Only leverage for appreciating assets: Real estate, education, business investments
These principles connect to emergency fund planning; financial resilience requires maintaining adequate liquidity alongside any leverage positions.
Advanced Leverage Concepts
Beyond basic ratios, sophisticated analysis examines leverage’s dynamic effects on business performance.
Operating Leverage vs Financial Leverage
Operating Leverage measures how revenue changes affect operating income, driven by fixed versus variable cost structure.
Financial Leverage measures how operating income changes affect net income and EPS, driven by debt levels.
Combined Leverage = Operating Leverage × Financial Leverage
This multiplicative effect means companies with both high operating leverage (heavy fixed costs) and high financial leverage (substantial debt) experience extreme earnings volatility.
Example:
- Operating leverage: 2.0x (10% revenue increase → 20% EBIT increase)
- Financial leverage: 1.5x (20% EBIT increase → 30% EPS increase)
- Combined leverage: 2.0 × 1.5 = 3.0x (10% revenue increase → 30% EPS increase)
Airlines exemplify high combined leverage, massive fixed costs (aircraft, facilities), plus substantial debt, creating extreme cyclicality.
Leverage and Bankruptcy Prediction
The Altman Z-Score incorporates leverage ratios into bankruptcy prediction models. The formula includes:
- Working capital / Total assets
- Retained earnings / Total assets
- EBIT / Total assets
- Market value of equity / Book value of total liabilities (leverage component)
- Sales / Total assets
Companies with Z-scores below 1.8 face a high bankruptcy probability within two years. Excessive leverage frequently appears as the primary driver of low scores.
Leverage Buyouts (LBOs)
Private equity firms use extreme leverage to acquire companies, often reaching 6-8x debt-to-EBITDA ratios. The strategy relies on:
- Cash flow generation: Acquired company’s earnings service debt
- Asset sales: Divesting non-core businesses to reduce debt
- Operational improvements: Cost reduction and revenue growth
- Multiple expansion: Selling at higher valuation multiples
Success example: Hilton Hotels LBO (2007) by Blackstone for $26 billion. Despite leveraging through the financial crisis, operational improvements, and eventual IPO, it generated substantial returns.
Failure example: Toys “R” Us LBO (2005) collapsed under $5 billion debt burden, unable to compete with Amazon while servicing massive interest payments.
Conclusion: Mastering the Math Behind Leverage
The Financial Leverage Ratio stands as one of finance’s most powerful yet dangerous tools. Like a lever amplifying physical force, financial leverage magnifies business outcomes, multiplying both successes and failures.
The core mathematical truth: Leverage creates value when returns on assets exceed debt costs, but destroys wealth when this relationship inverts. A company earning 15% on assets while paying 6% on debt generates 9% positive spread on each borrowed dollar. The same company earning 3% on assets while paying 6% on debt loses 3% on each borrowed dollar, rapidly eroding equity.
Strategic takeaways for investors:
- Always contextualize leverage ratios within industry norms: a 3.5x ratio signals different risk levels for utilities versus technology companies
- Examine multiple leverage metrics together: Debt-to-Equity, Interest Coverage, and Debt-to-EBITDA provide complementary perspectives
- Assess leverage trends over time: rapidly increasing leverage often precedes financial distress
- Stress-test under adverse scenarios: evaluate whether companies can service debt during recessions
- Balance leverage analysis with profitability and cash flow metrics: capital structure matters only if the underlying business generates returns
For business owners and managers:
- Optimize leverage based on cash flow stability: predictable earnings support higher debt levels
- Maintain covenant compliance buffers: don’t operate at maximum allowable leverage
- Use debt strategically for value creation: borrow to fund projects with returns exceeding interest costs
- Preserve financial flexibility: unused borrowing capacity provides options during opportunities and crises
- Monitor leverage ratios quarterly: early detection of deterioration enables corrective action
The path to wealth building requires understanding leverage’s dual nature. Used skillfully, it accelerates progress toward financial goals. Used recklessly, it precipitates ruin.
As you evaluate companies, investment opportunities, or personal financial decisions, remember this fundamental principle: Leverage amplifies outcomes in both directions. The math doesn’t lie; it simply multiplies whatever results you generate.
Start analyzing leverage ratios today. Review your investment portfolio, examine the companies you own, and assess whether their capital structures align with your risk tolerance. The numbers tell the story; you just need to read them correctly.
References
[1] Federal Reserve Board. (2023). “Basel III Capital Requirements.” Board of Governors of the Federal Reserve System.
[2] CFA Institute. (2024). “Financial Analysis Techniques.” CFA Program Curriculum Level I.
[3] Damodaran, A. (2025). “Corporate Finance: Theory and Practice.” Stern School of Business, New York University.
[4] SEC. (2024). “Financial Statement Analysis Guide.” U.S. Securities and Exchange Commission Investor Publications.
[5] Moody’s Investors Service. (2024). “Rating Methodology: Corporate Leverage Ratios.” Moody’s Analytics.
[6] Bank for International Settlements. (2023). “Basel III: International Regulatory Framework for Banks.” Basel Committee on Banking Supervision.
Author Bio
Max Fonji is a data-driven financial educator and the voice behind The Rich Guy Math. With expertise in economic analysis, valuation principles, and evidence-based investing, Max breaks down complex financial concepts into clear, actionable insights. His mission: teaching the math behind money to help readers build wealth through understanding, not speculation.
Educational Disclaimer
This article provides educational information about financial leverage ratios and should not be construed as financial, investment, or legal advice. Financial leverage involves significant risk, and inappropriate use can result in substantial losses or bankruptcy. Readers should conduct thorough research and consult qualified financial professionals before making investment decisions or implementing leverage strategies. Past performance does not guarantee future results. The Rich Guy Math and its authors assume no liability for financial decisions made based on this content.
Frequently Asked Questions
What is a good financial leverage ratio?
A “good” leverage ratio depends entirely on industry context and business characteristics. Technology companies typically maintain ratios below 1.5x, while utilities and real estate companies operate successfully with 3.0–5.0x leverage. Compare companies against industry peers rather than absolute benchmarks. Generally, ratios below 2.0x indicate conservative financing, 2.0–3.0x suggests moderate leverage, and above 3.0x signals aggressive debt usage requiring careful evaluation.
How does financial leverage affect return on equity?
Financial leverage amplifies ROE by concentrating returns on a smaller equity base. When a company earns returns on assets exceeding its cost of debt, leverage creates positive spread that flows to equity holders. For example, a company earning 12% on assets while paying 5% on debt generates 7% excess return on each borrowed dollar, boosting ROE. However, this works in reverse—if asset returns fall below debt costs, leverage destroys equity value and reduces ROE.
What’s the difference between financial leverage and operating leverage?
Operating leverage measures how revenue changes affect operating income, determined by a company’s fixed versus variable cost structure. High fixed costs create high operating leverage—small revenue changes produce magnified EBIT changes. Financial leverage measures how operating income changes affect net income and EPS, determined by debt levels. High debt creates high financial leverage—small EBIT changes produce magnified earnings changes. Combined leverage multiplies these effects, creating extreme earnings volatility.
Can a company have too little leverage?
Yes. Companies using exclusively equity financing sacrifice several advantages: tax benefits from interest deductibility, enhanced ROE from positive leverage spreads, and disciplined capital allocation from debt obligations. Extremely conservative leverage (ratios below 0.5x) may indicate management unwilling to optimize capital structure. However, “too little” depends on context—startups and companies in volatile industries benefit from low leverage, while stable, mature businesses with predictable cash flows can safely employ more debt.
How do you calculate degree of financial leverage (DFL)?
DFL = EBIT ÷ (EBIT − Interest Expense). This ratio measures earnings sensitivity to operating income changes. A DFL of 1.5 means a 10% EBIT change produces a 15% EPS change. Companies with no debt have DFL of 1.0 (no magnification effect). Higher DFL indicates greater earnings volatility from leverage. Calculate DFL using income statement data: locate EBIT and interest expense, then apply the formula. DFL changes as EBIT fluctuates—it’s highest when EBIT barely exceeds interest expense.
What is the equity multiplier and how does it relate to leverage?
The equity multiplier equals Total Assets ÷ Total Equity—mathematically identical to the primary financial leverage ratio. It shows how many dollars of assets each equity dollar controls. An equity multiplier of 3.0x means shareholders control $3 in assets for every $1 invested. This metric appears in DuPont Analysis, decomposing ROE into profit margin, asset turnover, and equity multiplier. The equity multiplier directly captures leverage’s effect on ROE, demonstrating how debt amplifies returns on shareholder capital.
How does interest coverage ratio complement leverage ratios?
While leverage ratios measure capital structure (how much debt exists), interest coverage ratios assess debt serviceability (whether the company can afford its debt). Calculate as EBITDA ÷ Interest Expense. Coverage above 5.0x indicates healthy ability to meet obligations; below 2.0x signals distress. A company might have moderate leverage (2.0x) but poor coverage (1.5x) if profitability is weak, or high leverage (4.0x) but strong coverage (8.0x) if highly profitable. Analyze both metrics together for complete risk assessment.
What leverage ratios do banks use for credit decisions?
Commercial lenders typically evaluate: (1) Debt-to-Equity—preferring below 2.0x; (2) Debt-to-EBITDA—usually requiring below 3.0–4.0x; (3) Interest Coverage—minimum 2.5–3.0x; (4) Debt-to-Capital—often limiting to 60%. Requirements vary by industry, loan size, and economic conditions. Banks also examine debt covenants, asset quality, and cash flow stability. Meeting numerical thresholds does not guarantee approval—management quality and competitive position matter equally.