When Warren Buffett evaluates a company, he doesn’t just glance at the stock price and hope for the best. He examines the numbers—the raw financial data that reveals whether a business generates real value or merely creates the illusion of success. The difference between investing and speculating lies in understanding financial ratios: the mathematical tools that transform pages of accounting data into actionable intelligence. These ratios expose profitability trends, measure debt levels, and reveal operational efficiency in ways that narrative reports cannot.
For investors seeking to build wealth through informed decisions, financial ratios serve as the essential language of business analysis. They answer critical questions: Does this company generate enough profit to justify its valuation? Can it pay its debts? Is management deploying capital efficiently? Without these metrics, investment decisions become guesswork. With them, patterns emerge, risks become quantifiable, and opportunities reveal themselves through data rather than speculation.
This guide breaks down the most important financial ratios into clear categories, explains what each metric measures, and demonstrates how to apply these tools when analyzing financial statements. The goal is straightforward: equip readers with the analytical framework that professional investors use to separate strong businesses from weak ones.
Key Takeaways
- Financial ratios transform raw accounting data into comparable metrics that reveal profitability, liquidity, efficiency, and solvency across companies and time periods.
- Profitability ratios measure how effectively a company converts revenue into profit, with metrics like net profit margin and return on equity showing operational success.
- Liquidity ratios assess short-term financial health, indicating whether a business can meet immediate obligations without selling long-term assets.
- Leverage ratios quantify debt levels and financial risk, helping investors understand how much a company relies on borrowed capital versus equity.
- Efficiency ratios reveal operational effectiveness, measuring how well management uses assets to generate revenue and manage working capital.
What Are Financial Ratios and Why Do They Matter
Financial ratios are mathematical relationships between two or more figures from a company’s financial statements. They standardize financial data, making it possible to compare companies of different sizes, track performance over time, and benchmark against industry averages.
Raw financial statement numbers—revenue of $500 million or debt of $200 million—provide limited insight without context. A $200 million debt load might be manageable for a profitable corporation generating $100 million in annual cash flow, but catastrophic for a struggling business with declining revenues. Ratios provide that context by expressing relationships: debt relative to equity, profit relative to sales, or current assets relative to current liabilities.
According to the CFA Institute, financial ratio analysis forms a core component of equity valuation and credit analysis. Analysts use these metrics to:
- Compare performance across companies within the same industry
- Identify trends in profitability, efficiency, and financial stability over multiple periods
- Assess risk by measuring leverage, liquidity, and coverage ratios
- Support valuation models that estimate intrinsic value based on earnings, assets, or cash flows
Understanding how the stock market operates requires more than tracking price movements—it demands insight into the fundamental financial health of underlying businesses.
Insight: Financial ratios convert accounting complexity into decision-making clarity, enabling investors to evaluate businesses using objective, quantifiable metrics.
The Five Core Categories of Financial Ratios
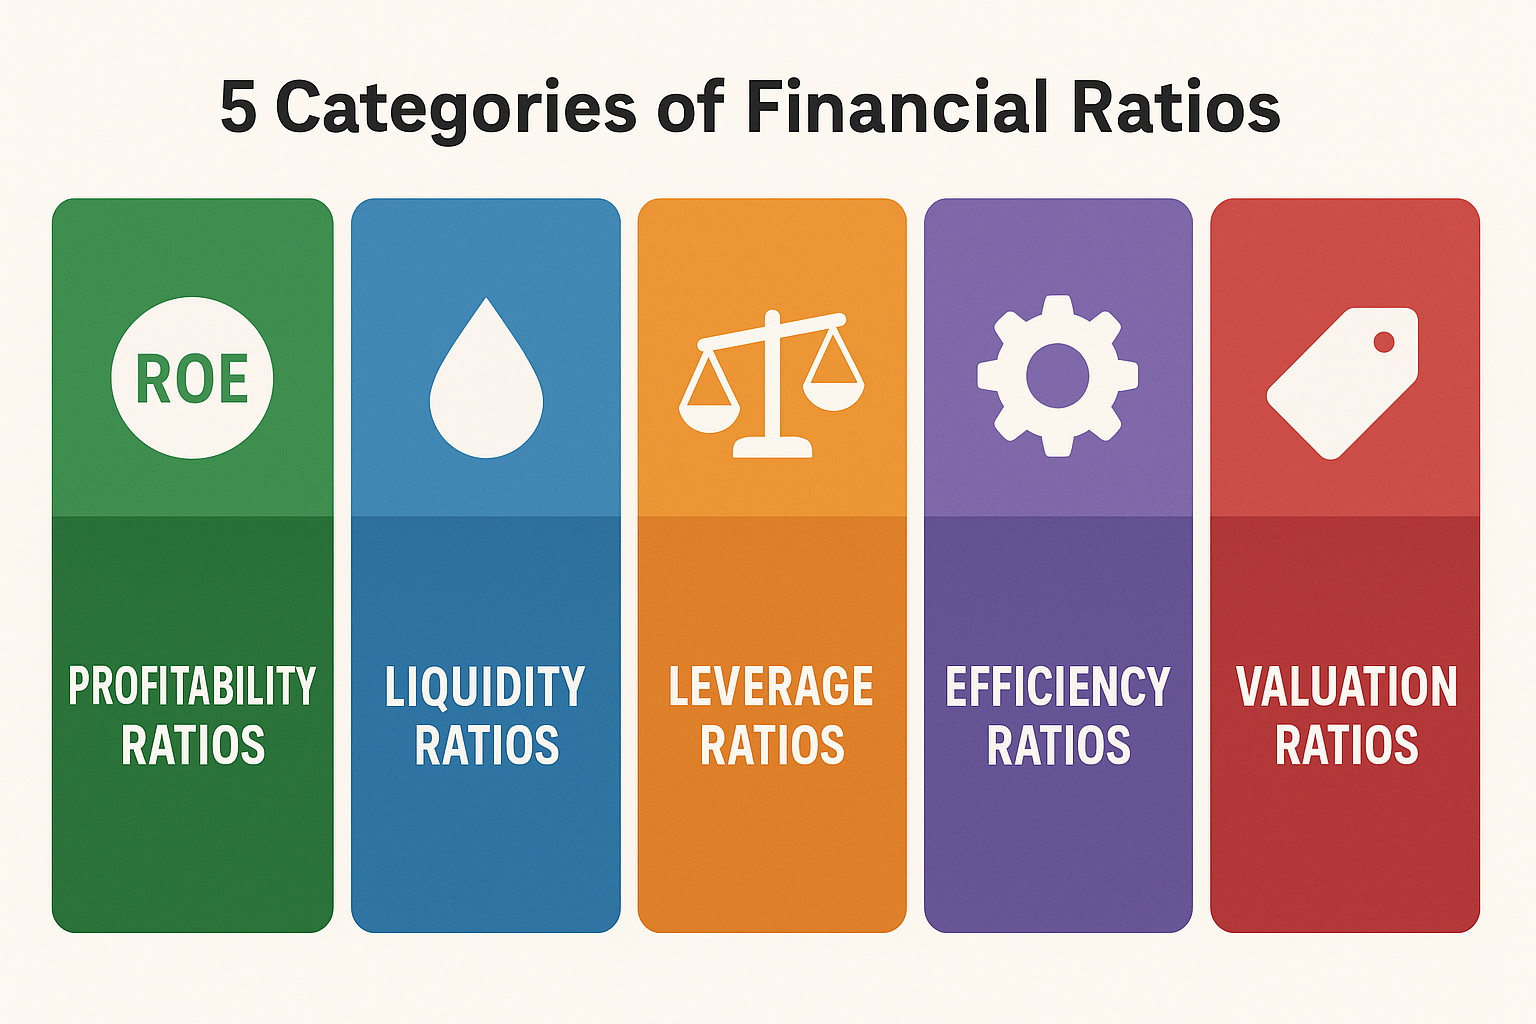
Financial ratios fall into five primary categories, each measuring a distinct aspect of business performance:
- Profitability Ratios – Measure how efficiently a company generates profit from revenue and assets
- Liquidity Ratios – Assess the ability to meet short-term financial obligations
- Leverage (Solvency) Ratios – Quantify debt levels and long-term financial stability
- Efficiency Ratios – Evaluate how effectively management uses assets and manages operations
- Valuation Ratios – Compare market price to fundamental metrics like earnings or book value
Each category answers specific questions about financial health, and together they provide a comprehensive view of business quality.
Profitability Ratios: Measuring Earnings Power
Profitability ratios reveal how effectively a company converts revenue into profit at various stages of the income statement. These metrics matter because sustainable profit generation drives long-term stock returns and dividend income.
Gross Profit Margin
Gross Profit Margin measures the percentage of revenue remaining after deducting the cost of goods sold (COGS).
Formula:
Gross Profit Margin = (Revenue - COGS) / Revenue × 100A company with $1 million in revenue and $600,000 in COGS has a gross profit margin of 40%. This ratio indicates pricing power and production efficiency. Higher margins suggest strong competitive positioning or effective cost management.
Industry Context: Software companies often report gross margins above 80% due to low incremental production costs, while retailers typically operate between 20-40% due to inventory and distribution expenses.
Net Profit Margin
Net Profit Margin shows the percentage of revenue that becomes actual profit after all expenses, taxes, and interest.
Formula:
Net Profit Margin = Net Income / Revenue × 100If a business generates $100,000 in net income on $1 million in revenue, its net profit margin is 10%. This metric reflects overall operational efficiency and cost control across all business functions.
According to NYU Stern School of Business data, median net profit margins vary significantly by sector—technology companies average around 15-20%, while grocery retailers operate near 2-3%.
Return on Assets (ROA)
Return on Assets measures how efficiently a company uses its total assets to generate profit.
Formula:
ROA = Net Income / Total Assets × 100A company with $50,000 in net income and $500,000 in total assets has an ROA of 10%. This ratio indicates management’s effectiveness at deploying capital. A higher return on assets (ROA) suggests better asset utilization.
Application: ROA works best when comparing companies within the same industry, as capital intensity varies dramatically across sectors. Manufacturing requires substantial fixed assets, while consulting businesses operate with minimal physical capital.
Return on Equity (ROE)
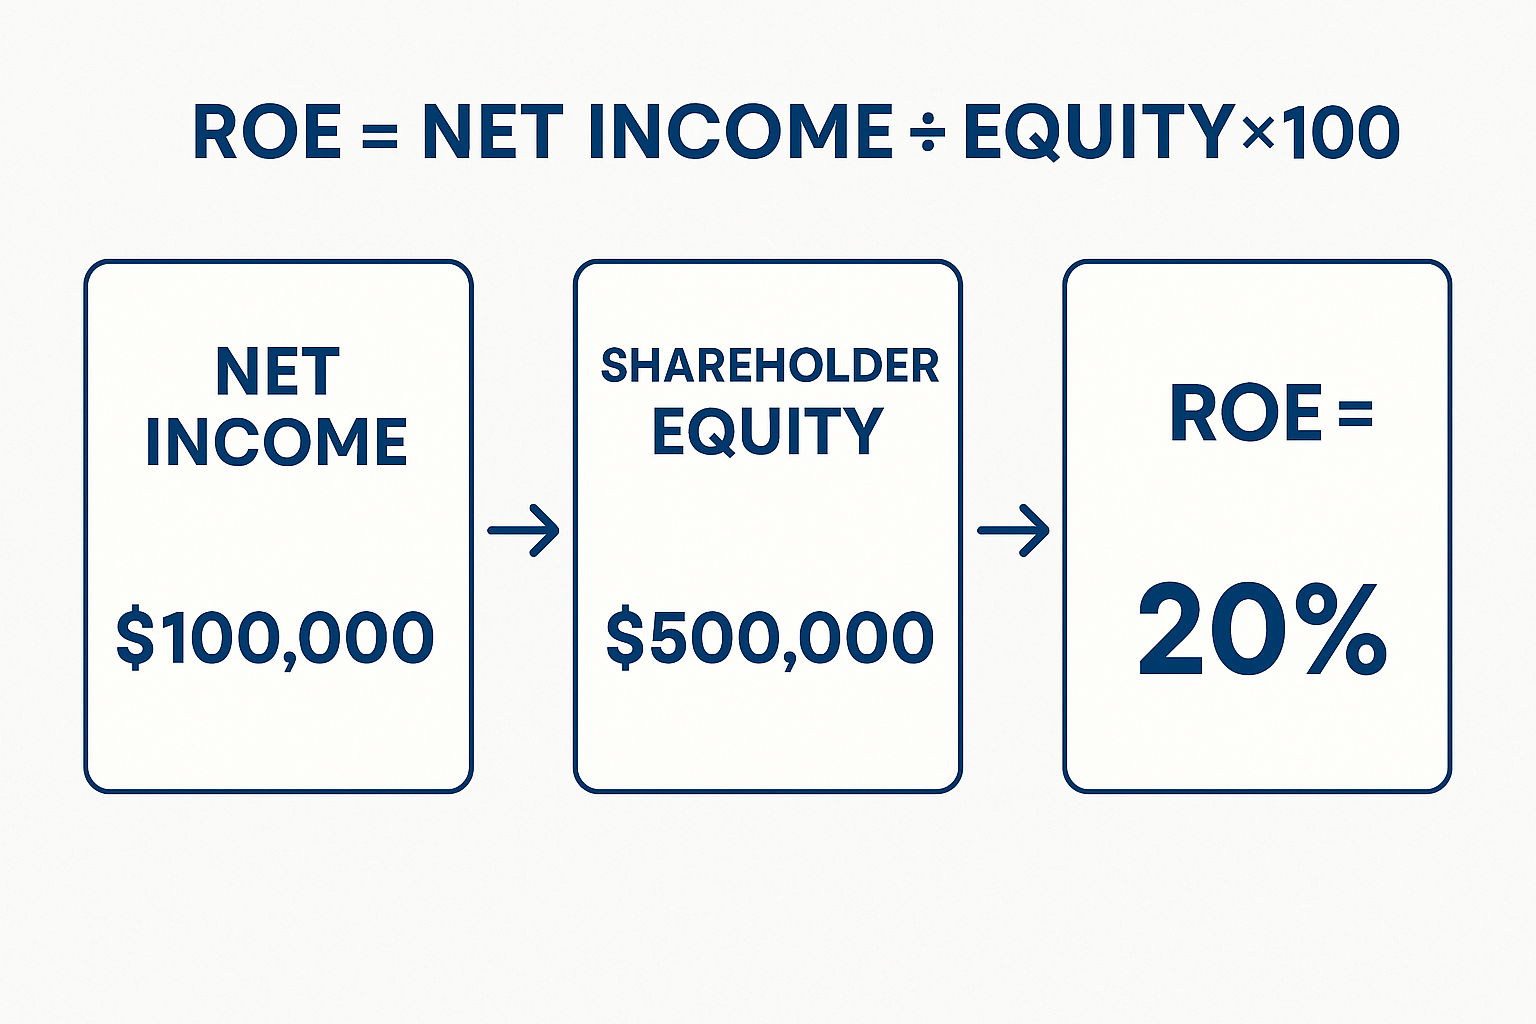
Return on Equity calculates the return generated on shareholder equity, measuring how effectively management uses invested capital.
Formula:
ROE = Net Income / Shareholder Equity × 100If a company earns $100,000 with $500,000 in equity, its ROE is 20%. Warren Buffett frequently cites ROE as a key metric for identifying quality businesses—companies that consistently deliver return on equity (ROE) above 15% demonstrate strong competitive advantages.
Caution: High leverage can artificially inflate ROE. A company with minimal equity and substantial debt may show impressive ROE despite elevated financial risk. Always examine ROE alongside debt ratios.
Takeaway: Profitability ratios reveal whether a business generates attractive returns on sales, assets, and equity—the foundation of long-term investment value.
Liquidity Ratios: Assessing Short-Term Financial Health
Liquidity ratios measure a company’s ability to meet immediate financial obligations without selling long-term assets or raising additional capital. These metrics matter because even profitable companies can fail if they cannot pay bills when due.
Current Ratio
Current Ratio compares current assets to current liabilities, indicating whether a company can cover short-term obligations.
Formula:
Current Ratio = Current Assets / Current LiabilitiesA business with $200,000 in current assets and $100,000 in current liabilities has a current ratio of 2.0, meaning it holds $2 in liquid assets for every $1 of near-term debt.
Interpretation:
- Below 1.0: Potential liquidity crisis—insufficient assets to cover liabilities
- 1.0 to 2.0: Generally acceptable, depending on industry norms
- Above 2.0: Strong liquidity cushion, though excessively high ratios may indicate inefficient capital use
Quick Ratio (Acid-Test Ratio)
Quick Ratio provides a more conservative liquidity measure by excluding inventory from current assets.
Formula:
Quick Ratio = (Current Assets - Inventory) / Current LiabilitiesInventory can be difficult to liquidate quickly without discounting, so the quick ratio focuses on cash, marketable securities, and receivables. A quick ratio above 1.0 indicates strong immediate liquidity.
Example: A retailer with $150,000 in current assets (including $60,000 in inventory) and $100,000 in current liabilities has a current ratio of 1.5 but a quick ratio of 0.9—suggesting potential short-term pressure if inventory doesn’t convert to cash quickly.
Cash Ratio
Cash Ratio represents the most stringent liquidity test, measuring only cash and cash equivalents against current liabilities.
Formula:
Cash Ratio = (Cash + Cash Equivalents) / Current LiabilitiesThis ratio shows how much of the current debt load could be paid immediately using only cash on hand. While a cash ratio below 1.0 is common, companies facing economic uncertainty benefit from maintaining higher cash reserves.
Insight: Liquidity ratios protect against short-term financial distress, ensuring a business can operate smoothly through revenue fluctuations or unexpected expenses.
Leverage Ratios: Quantifying Debt and Financial Risk
Leverage ratios measure the extent to which a company finances operations through debt versus equity. While debt can amplify returns during growth periods, excessive leverage increases bankruptcy risk during downturns.
Debt-to-Equity Ratio
Debt-to-Equity Ratio compares total debt to shareholder equity, showing the balance between borrowed and owned capital.
Formula:
Debt-to-Equity Ratio = Total Debt / Shareholder EquityA company with $300,000 in debt and $600,000 in equity has a debt-to-equity ratio of 0.5, meaning it uses $0.50 of debt for every $1 of equity.
Interpretation:
- Below 0.5: Conservative capital structure with low financial risk
- 0.5 to 1.5: Moderate leverage, typical for many industries
- Above 2.0: High leverage, increasing vulnerability to economic downturns
Industry Variation: Utilities and real estate companies often operate with higher debt ratios due to stable cash flows, while technology firms typically maintain lower leverage.
Debt Ratio
Debt Ratio measures total debt as a percentage of total assets.
Formula:
Debt Ratio = Total Debt / Total Assets × 100A debt ratio of 40% means debt finances 40% of assets, while equity funds the remaining 60%. Lower ratios indicate less financial risk.
Interest Coverage Ratio
Interest Coverage Ratio assesses a company’s ability to pay interest expenses from operating income.
Formula:
Interest Coverage Ratio = EBIT / Interest ExpenseIf a business generates $500,000 in earnings before interest and taxes (EBIT) and owes $100,000 in annual interest, its coverage ratio is 5.0—meaning it earns five times the required interest payment.
Risk Assessment:
- Below 1.5: Danger zone—earnings barely cover interest costs.
- 1.5 to 3.0: Adequate but limited margin for error
- Above 3.0: Comfortable cushion, indicating low default risk
According to Moody’s credit rating methodology, interest coverage ratios significantly influence corporate credit ratings, with higher coverage supporting better borrowing terms.
Understanding market volatility becomes particularly important when evaluating leveraged companies, as economic downturns can quickly erode earnings and stress debt obligations.
Takeaway: Leverage ratios reveal financial risk by measuring debt levels relative to equity, assets, and earnings—critical information for assessing long-term solvency.
Efficiency Ratios: Evaluating Operational Effectiveness
Efficiency ratios measure how well management uses assets and manages working capital to generate revenue. These metrics reveal operational quality beyond simple profitability.
Asset Turnover Ratio
Asset Turnover Ratio measures how efficiently a company uses assets to generate sales.
Formula:
Asset Turnover Ratio = Revenue / Total AssetsA retailer with $2 million in revenue and $1 million in assets has an asset turnover of 2.0, meaning it generates $2 in sales for every $1 of assets.
Industry Context: Retailers and restaurants typically show high asset turnover (2.0+), while capital-intensive manufacturers may operate below 1.0. Higher turnover generally indicates better asset utilization.
Inventory Turnover Ratio
Inventory Turnover Ratio shows how many times inventory is sold and replaced during a period.
Formula:
Inventory Turnover = Cost of Goods Sold / Average InventoryA company with $600,000 in COGS and $100,000 in average inventory has a turnover of 6.0, meaning it cycles through inventory six times annually.
Implications:
- High turnover: Efficient inventory management, less capital tied up in stock
- Low turnover: Excess inventory, potential obsolescence risk, or slow-moving products
Days Inventory Outstanding (DIO) converts this ratio into days:
DIO = 365 / Inventory TurnoverAn inventory turnover of 6.0 equals approximately 61 days of inventory on hand.
Accounts Receivable Turnover
Accounts Receivable Turnover measures how quickly a company collects payment from customers.
Formula:
Receivables Turnover = Revenue / Average Accounts ReceivableHigher turnover indicates faster collection, improving cash flow, and reducing bad debt risk.
Days Sales Outstanding (DSO) expresses this in days:
DSO = 365 / Receivables TurnoverA DSO of 45 days means the average customer pays within 45 days of purchase. Tracking DSO trends reveals whether credit policies are tightening or loosening.
Cash Conversion Cycle
Cash Conversion Cycle measures how long cash remains tied up in operations before converting back to cash through sales.
Formula:
Cash Conversion Cycle = DIO + DSO - Days Payable Outstanding (DPO)Shorter cycles indicate more efficient working capital management. Companies that collect receivables quickly, turn inventory rapidly, and delay payables (without damaging supplier relationships) optimize cash flow.
Insight: Efficiency ratios expose operational strengths and weaknesses that profitability metrics alone cannot reveal, showing how effectively management converts assets into revenue.
Valuation Ratios: Connecting Price to Fundamentals
Valuation ratios compare a company’s market price to fundamental financial metrics, helping investors determine whether a stock trades at a reasonable, expensive, or discounted level.
Price-to-Earnings Ratio (P/E)
Price-to-Earnings Ratio compares the stock price to earnings per share.
Formula:
P/E Ratio = Stock Price / Earnings Per ShareA stock trading at $50 with $5 in annual earnings per share has a P/E of 10, meaning investors pay $10 for every $1 of earnings.
Interpretation:
- Low P/E (below 15): Potentially undervalued or facing growth challenges
- Moderate P/E (15-25): Typical for mature, stable companies
- High P/E (above 25): Growth expectations or potential overvaluation
Context Matters: Technology companies often trade at P/E ratios above 30 due to growth prospects, while utilities average 12-15. Comparing P/E ratios within the same industry provides more meaningful insights than cross-sector comparisons.
Price-to-Book Ratio (P/B)
Price-to-Book Ratio compares market capitalization to book value (shareholder equity).
Formula:
P/B Ratio = Market Price Per Share / Book Value Per ShareA P/B below 1.0 suggests the market values the company below its accounting net worth, potentially indicating undervaluation or concerns about asset quality.
Application: P/B ratios work best for asset-heavy businesses like banks and manufacturers. For asset-light technology companies, book value may significantly understate true economic value.
Dividend Yield
Dividend Yield measures annual dividend income relative to the stock price.
Formula:
Dividend Yield = Annual Dividend Per Share / Stock Price × 100A stock priced at $100 paying $4 annually in dividends offers a 4% yield. Investors seeking passive income through dividend investing prioritize yield alongside dividend growth and sustainability.
Caution: Extremely high yields (above 8-10%) may signal dividend cuts ahead rather than attractive opportunities. Always examine payout ratios and cash flow coverage before assuming high yields are sustainable.
For those interested in generating a regular income, researching high dividend stocks provides exposure to companies with strong cash flow and shareholder-friendly policies.
Takeaway: Valuation ratios bridge market price and financial fundamentals, helping investors identify mispriced opportunities and avoid overpaying for assets.
How to Use Financial Ratios in Investment Analysis
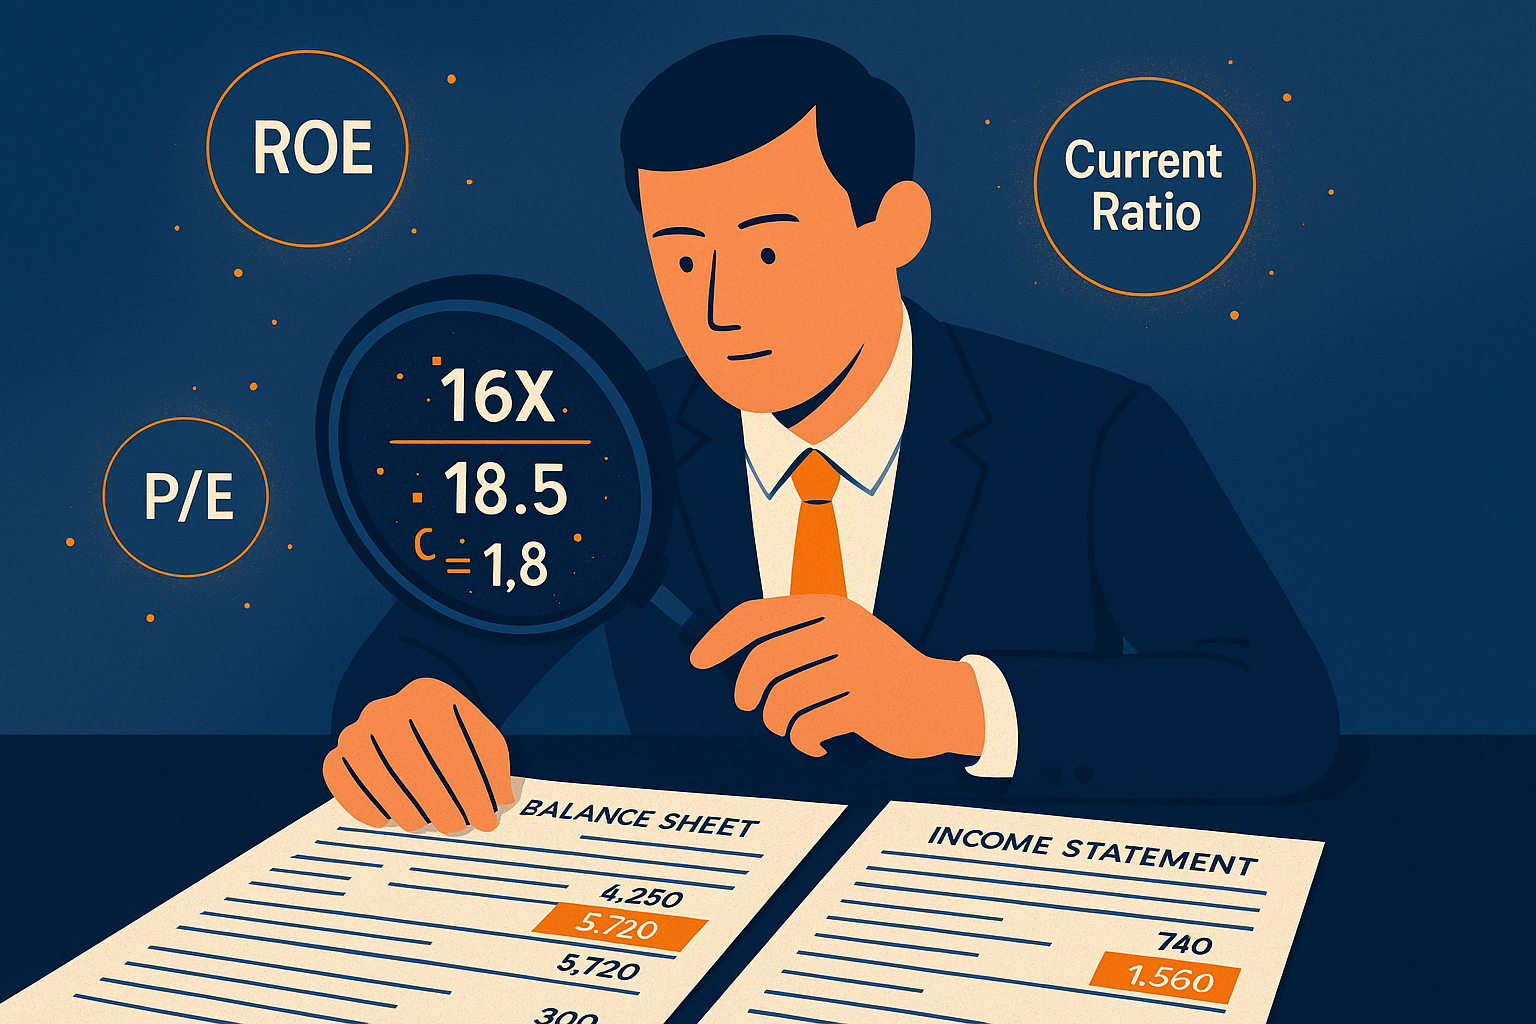
Understanding individual ratios provides value, but comprehensive analysis requires systematic application across multiple dimensions:
1. Compare Within Industries
Financial ratios vary dramatically across sectors due to different business models, capital requirements, and competitive dynamics. A grocery retailer with 2% net margins operates successfully, while a software company with 2% margins likely faces serious problems.
Always benchmark ratios against industry peers rather than absolute standards. The Federal Reserve publishes industry financial data through its quarterly reports, while services like Morningstar and S&P Capital IQ provide detailed peer comparisons.
2. Analyze Trends Over Time
Single-period ratios offer snapshots; multi-year trends reveal patterns. A company with declining ROE over five years signals a deteriorating competitive position, even if current profitability appears adequate.
Track key ratios quarterly and annually to identify:
- Improving efficiency (rising asset turnover, falling inventory days)
- Margin expansion or compression (changing profit margins)
- Leverage trends (increasing or decreasing debt ratios)
- Liquidity changes (strengthening or weakening current ratios)
3. Combine Multiple Ratios
No single ratio tells the complete story. A high ROE might result from excessive leverage rather than operational excellence. Strong profit margins mean little if the company cannot collect receivables or manage inventory efficiently.
Example Framework:
- Profitability: Net margin, ROE, ROA
- Financial Health: Current ratio, debt-to-equity, interest coverage
- Efficiency: Asset turnover, inventory turnover, cash conversion cycle
- Valuation: P/E ratio, P/B ratio, dividend yield
Analyzing these categories together provides comprehensive insight into business quality and investment potential.
4. Understand Limitations
Financial ratios rely on accounting data, which can be manipulated through aggressive revenue recognition, capitalization policies, or off-balance-sheet financing. Ratios also reflect historical performance rather than future potential.
Key Limitations:
- Accounting differences across companies (LIFO vs. FIFO inventory, depreciation methods)
- Non-recurring items that distort single-period results
- Industry-specific factors that make cross-sector comparisons meaningless
- Qualitative factors like management quality, brand value, or competitive moats that ratios cannot capture
Supplement ratio analysis with qualitative research, competitive analysis, and forward-looking assessments. Understanding what moves the stock market requires integrating quantitative metrics with broader economic and market context.
Insight: Effective financial analysis combines ratio calculations with industry knowledge, trend analysis, and qualitative judgment to build comprehensive investment theses.
Practical Example: Analyzing a Company Using Financial Ratios
Consider analyzing two hypothetical companies in the retail sector:
Company A:
- Revenue: $10 million
- Net Income: $800,000
- Total Assets: $5 million
- Current Assets: $2 million
- Current Liabilities: $1 million
- Total Debt: $1.5 million
- Shareholder Equity: $3.5 million
- Stock Price: $40
- Shares Outstanding: 100,000
- Annual Dividend: $2 per share
Company B:
- Revenue: $10 million
- Net Income: $500,000
- Total Assets: $8 million
- Current Assets: $3 million
- Current Liabilities: $2.5 million
- Total Debt: $4 million
- Shareholder Equity: $4 million
- Stock Price: $30
- Shares Outstanding: 100,000
- Annual Dividend: $1 per share
Calculating Key Ratios
| Ratio | Company A | Company B |
|---|---|---|
| Net Profit Margin | 8.0% | 5.0% |
| ROE | 22.9% | 12.5% |
| ROA | 16.0% | 6.3% |
| Current Ratio | 2.0 | 1.2 |
| Debt-to-Equity | 0.43 | 1.0 |
| P/E Ratio | 5.0 | 6.0 |
| Dividend Yield | 5.0% | 3.3% |
Analysis
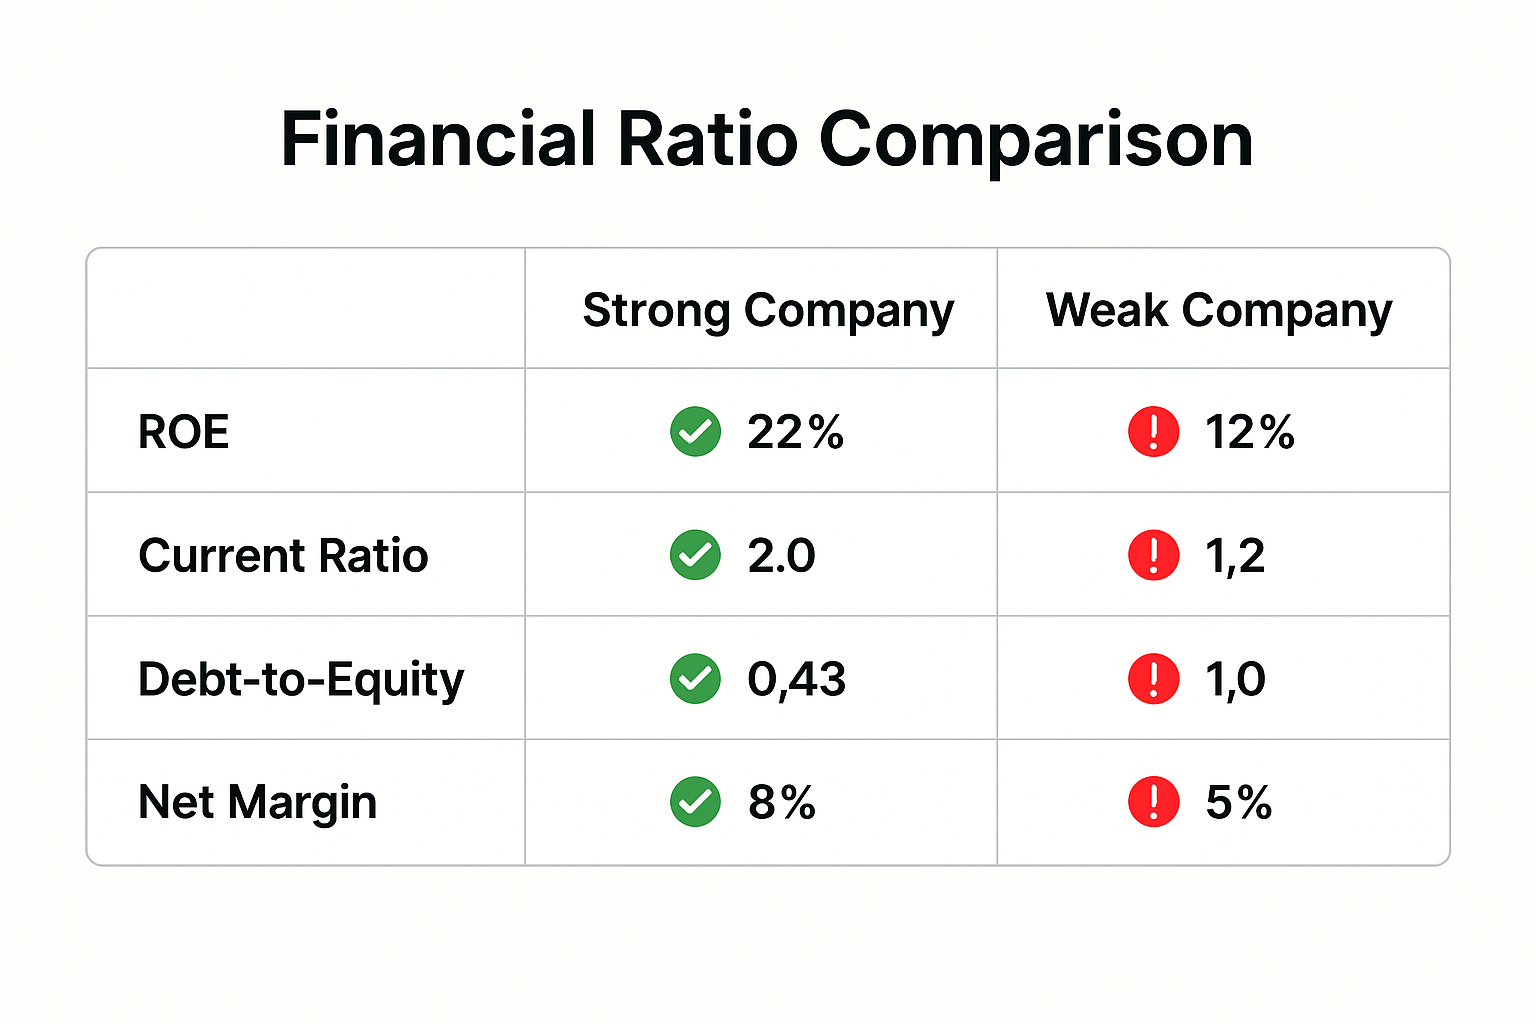
Company A demonstrates superior profitability (higher margins, ROE, and ROA), stronger liquidity (current ratio of 2.0), and lower financial risk (debt-to-equity of 0.43). It trades at a lower P/E ratio despite better fundamentals and offers a higher dividend yield.
Company B shows weaker profitability, marginal liquidity, and higher leverage. While its P/E ratio appears only slightly higher, the inferior fundamentals suggest less value per dollar invested.
Conclusion: Based purely on financial ratios, Company A presents a more attractive investment opportunity—stronger operational performance, lower risk, and better valuation. Further research would examine competitive positioning, growth prospects, and management quality before making final investment decisions.
Investors exploring growth opportunities benefit from this type of systematic ratio analysis to identify companies with strong fundamentals trading at reasonable valuations.
Common Mistakes When Using Financial Ratios
Ignoring Industry Context
Applying universal ratio standards across all sectors leads to faulty conclusions. A debt-to-equity ratio of 1.5 might be conservative for a utility but aggressive for a technology startup.
Solution: Always compare ratios to industry averages and peer companies operating in similar markets.
Relying on Single-Period Data
One quarter’s results can be distorted by seasonal factors, one-time charges, or temporary disruptions.
Solution: Analyze multi-year trends to identify persistent patterns rather than temporary fluctuations.
Overlooking Accounting Quality
Companies use different accounting methods that affect reported numbers. Aggressive revenue recognition or capitalization policies can inflate profitability metrics artificially.
Solution: Read financial statement footnotes, examine cash flow statements, and watch for discrepancies between reported earnings and actual cash generation.
Focusing Solely on Quantitative Metrics
Financial ratios cannot measure management competence, brand strength, competitive positioning, or innovation capability—all critical factors in long-term success.
Solution: Combine ratio analysis with qualitative research, competitive analysis, and strategic assessment.
Misunderstanding Ratio Relationships
High ROE might result from excessive leverage rather than operational excellence. Strong revenue growth might mask deteriorating margins.
Solution: Examine ratios in combination, understanding how leverage, margins, and efficiency interact to produce overall returns.
Takeaway: Effective ratio analysis requires context, consistency, and comprehensive evaluation rather than mechanical calculation and comparison.
Building a Financial Analysis Routine
Developing systematic habits for financial analysis improves investment decision-making over time:
1. Create a Ratio Dashboard
Track 10-15 key ratios for companies in your portfolio or watchlist, updating quarterly. Monitor trends and flag significant changes for deeper investigation.
Suggested Dashboard Metrics:
- Net profit margin
- ROE and ROA
- Current ratio
- Debt-to-equity ratio
- Interest coverage
- Asset turnover
- Inventory turnover
- P/E ratio
- Dividend yield
2. Establish Industry Benchmarks
Research typical ratio ranges for industries you invest in. Understand why software companies show different metrics than manufacturers or retailers.
3. Read Financial Statements Regularly
Ratios derive from financial statements. Reading balance sheets, income statements, and cash flow statements builds intuition for how business operations translate into financial results.
The SEC provides free access to all public company filings through EDGAR, making primary source research accessible to individual investors.
4. Study Historical Examples
Examine financial ratios for companies that succeeded (Amazon, Microsoft) and failed (Enron, Lehman Brothers) to understand what warning signs ratios revealed before outcomes became obvious.
5. Integrate with Investment Strategy
Use ratio analysis to support specific investment approaches—value investors emphasize P/B and P/E ratios, income investors focus on dividend yield and payout ratios, while growth investors track ROE and revenue growth rates.
For those building wealth through smart passive income strategies, financial ratios help identify sustainable dividend payers and quality businesses capable of long-term compounding.
Insight: Consistent financial analysis builds pattern recognition skills that improve investment judgment and risk assessment over time.
Advanced Ratio Applications
DuPont Analysis
DuPont Analysis decomposes ROE into three components to identify drivers of shareholder returns:
ROE = Net Profit Margin × Asset Turnover × Equity MultiplierWhere:
- Net Profit Margin = Net Income / Revenue
- Asset Turnover = Revenue / Total Assets
- Equity Multiplier = Total Assets / Shareholder Equity
This framework reveals whether high ROE results from operational efficiency (margin), asset productivity (turnover), or financial leverage (multiplier). Companies generating high ROE through leverage face greater risk than those achieving similar returns through superior margins or efficiency.
Altman Z-Score
The Altman Z-Score combines multiple ratios to predict bankruptcy probability:
Z = 1.2(Working Capital/Total Assets) + 1.4(Retained Earnings/Total Assets) + 3.3(EBIT/Total Assets) + 0.6(Market Value of Equity/Total Liabilities) + 1.0(Sales/Total Assets)Interpretation:
- Above 2.99: Safe zone—low bankruptcy risk
- 1.81 to 2.99: Gray zone—moderate risk
- Below 1.81: Distress zone—high bankruptcy probability
While originally developed for manufacturing companies, modified versions apply to service businesses and private companies.
Piotroski F-Score
The Piotroski F-Score uses nine binary criteria (each worth 0 or 1 point) to assess financial strength:
Profitability (4 criteria):
- Positive net income
- Positive operating cash flow
- Increasing ROA
- Operating cash flow exceeds net income
Leverage/Liquidity (3 criteria):
- Decreasing long-term debt ratio
- Increasing current ratio
- No new share issuance
Operating Efficiency (2 criteria):
- Increasing gross margin
- Increasing asset turnover
Scores range from 0-9, with higher scores indicating stronger financial health. Research shows portfolios of high F-Score value stocks outperform low F-Score stocks significantly over time.
Takeaway: Advanced ratio frameworks combine multiple metrics into comprehensive scoring systems that streamline comparative analysis and risk assessment.
Financial Ratios and Market Performance
Understanding financial ratios matters because they correlate with long-term market returns. Academic research consistently demonstrates that companies with strong fundamentals—measured through profitability, efficiency, and financial stability ratios—outperform weaker competitors over extended periods.
A Journal of Finance study found that stocks with high ROE, low debt, and strong cash flow generation delivered superior risk-adjusted returns compared to companies with poor fundamentals. This relationship persists across market cycles, though short-term price movements often disconnect from underlying fundamentals.
Investors who understand why the stock market goes up over long periods recognize that sustainable price appreciation ultimately reflects earnings growth and return on capital—both measurable through financial ratios.
Market Efficiency Considerations:
While markets generally price securities efficiently, temporary mispricings occur when:
- Information asymmetry exists between management and investors
- Behavioral biases drive excessive optimism or pessimism
- Market structure creates temporary supply/demand imbalances
- Complexity obscures the true financial condition from casual observers
Investors who systematically analyze financial ratios can identify these mispricings before markets correct, generating excess returns through superior fundamental analysis.
Insight: Financial ratios provide the analytical foundation for identifying quality businesses trading at reasonable valuations—the core principle of successful long-term investing.
Conclusion: From Numbers to Investment Decisions
Financial ratios transform accounting complexity into analytical clarity. They convert balance sheets, income statements, and cash flow statements into comparable metrics that reveal profitability, liquidity, leverage, and operational efficiency. These tools enable investors to evaluate businesses systematically rather than relying on intuition or market sentiment.
Mastering financial ratio analysis requires practice, pattern recognition, and contextual understanding. No single ratio tells the complete story—comprehensive evaluation demands examining multiple metrics across categories, tracking trends over time, and comparing results to industry benchmarks. The most successful investors combine quantitative ratio analysis with qualitative research about competitive positioning, management quality, and industry dynamics.
Key Actions for Readers:
- Select 3-5 companies in industries that interest you and calculate their core profitability, liquidity, leverage, and efficiency ratios
- Track these ratios quarterly for at least one year to identify trends and patterns
- Compare peer companies within the same sector to understand relative strengths and weaknesses
- Read annual reports and quarterly filings to understand the business context behind the numbers
- Build a ratio dashboard using spreadsheet software to automate calculations and visualize trends
Financial statement analysis represents a learnable skill that improves with deliberate practice. Each company analyzed deepens the understanding of how business models translate into financial results. Over time, ratio analysis becomes intuitive—patterns emerge quickly, warning signs become obvious, and investment opportunities reveal themselves through systematic evaluation.
The path from financial statement novice to confident analyst follows a clear progression: learn ratio formulas, practice calculations, understand industry context, recognize patterns, and integrate insights into investment decisions. This progression transforms investing from speculation into evidence-based decision-making grounded in mathematical relationships and business fundamentals.
For those committed to building wealth through informed investing, financial ratio analysis provides the foundation for evaluating opportunities, managing risk, and constructing portfolios of quality businesses trading at reasonable valuations. The numbers tell stories—learning to read them accurately separates successful long-term investors from those who rely on hope and market timing.
Start with the basics: calculate ROE, current ratio, debt-to-equity, and asset turnover for companies you already own or follow. Compare results to competitors—track changes over time. Ask why ratios improve or deteriorate. This systematic approach builds the analytical skills that compound into investment expertise.
About the Author
Written by Max Fonji, founder of TheRichGuyMath.com—a finance educator and investor who explains the “math behind money” in simple, actionable terms. With experience in investment strategy, personal finance, and wealth-building systems, Max helps readers understand how financial decisions create lasting results. His approach combines rigorous analysis with clear communication, making complex financial concepts accessible to investors at all levels of experience.
Disclaimer
Disclaimer: The content on TheRichGuyMath.com is for educational purposes only and does not constitute financial or investment advice. Financial ratio analysis involves interpretation and judgment that vary based on individual circumstances, risk tolerance, and investment objectives. Always consult a qualified financial professional before making investment decisions. Past performance and financial metrics do not guarantee future results. All investments carry risk, including potential loss of principal
Frequently Asked Questions
What are financial ratios?
Financial ratios are mathematical relationships between figures from financial statements that standardize data for comparison across companies, time periods, and industries. They measure profitability, liquidity, leverage, efficiency, and valuation.
Why do financial ratios matter for investors?
Financial ratios convert complex accounting data into actionable insights about business quality, financial health, and operational efficiency. They enable objective comparison of investment opportunities and help identify risks before they become crises. Research shows companies with strong fundamental ratios outperform weaker competitors over long periods.
How can someone apply financial ratio analysis?
Start by calculating 5–10 core ratios (ROE, net margin, current ratio, debt-to-equity, P/E ratio) for companies you’re researching. Compare these metrics to industry peers and track trends over multiple quarters. Use ratio analysis to screen investment candidates, monitor portfolio holdings, and identify warning signs of deteriorating financial health.
What’s the most important financial ratio?
No single ratio captures complete business quality. Return on Equity (ROE) measures overall profitability and capital efficiency, making it valuable for initial screening. However, comprehensive analysis requires examining profitability, liquidity, leverage, and efficiency ratios together to understand the full financial picture.
How often should investors calculate financial ratios?
Calculate ratios quarterly when companies release earnings reports. Track key metrics over at least 3–5 years to identify meaningful trends rather than temporary fluctuations. Annual deep dives into complete financial statements provide comprehensive understanding, while quarterly updates monitor ongoing performance.
Can financial ratios predict stock price movements?
Financial ratios measure fundamental business quality rather than short-term price movements. While strong fundamentals correlate with long-term outperformance, quarterly stock prices reflect market sentiment, economic conditions, and countless other factors. Ratios help identify quality businesses trading at reasonable valuations—the foundation of long-term investment success.


