Ever wondered how much money a business actually brings in before any deductions? That’s where gross revenue comes into play—and understanding it might just change how you evaluate companies and make investment decisions. Whether you’re analyzing potential stock picks or simply trying to understand financial statements, gross revenue is the foundational metric that tells the story of a company’s earning power.
Key Takeaways
- Gross revenue is the total amount of money a business earns from sales before any deductions, discounts, or expenses are subtracted
- The basic formula is: Gross Revenue = Price per Unit × Number of Units Sold (for product-based businesses) or the sum of all sales transactions
- Gross revenue differs from net revenue (which subtracts returns and discounts) and net income (which subtracts all expenses)
- Understanding gross revenue helps investors assess a company’s market demand, growth trajectory, and overall business performance
- While important, gross revenue alone doesn’t tell the complete financial story—profitability metrics matter just as much
What Is Gross Revenue? A Simple Definition
In simple terms, gross revenue means the total income a business generates from all sales activities before any costs, expenses, or deductions are removed.
Think of gross revenue as the “top line” of a company’s income statement; it’s literally the first number you see when examining how much money flows into a business. This metric represents the raw earning power of a company without considering what it costs to generate those sales.
For example, if a coffee shop sells 1,000 lattes at $5 each in a month, its gross revenue for lattes alone would be $5,000. That’s before accounting for the cost of coffee beans, milk, employee wages, rent, or any other expenses. It’s simply the total cash coming through the door from sales. Investopedia – Gross Revenue
Why Gross Revenue Matters
Understanding gross revenue is crucial for several reasons:
Market Validation: High gross revenue indicates strong market demand for a company’s products or services
Growth Tracking: Comparing gross revenue across periods reveals whether a business is expanding or contracting
Investment Analysis: When evaluating stocks, gross revenue trends help investors understand a company’s competitive position
Business Health: It’s the starting point for understanding a company’s complete financial picture
For anyone interested in investing, gross revenue provides essential context about a company’s scale and market presence. However, as you’ll learn throughout this guide, it’s just one piece of the puzzle.
The Gross Revenue Formula Explained
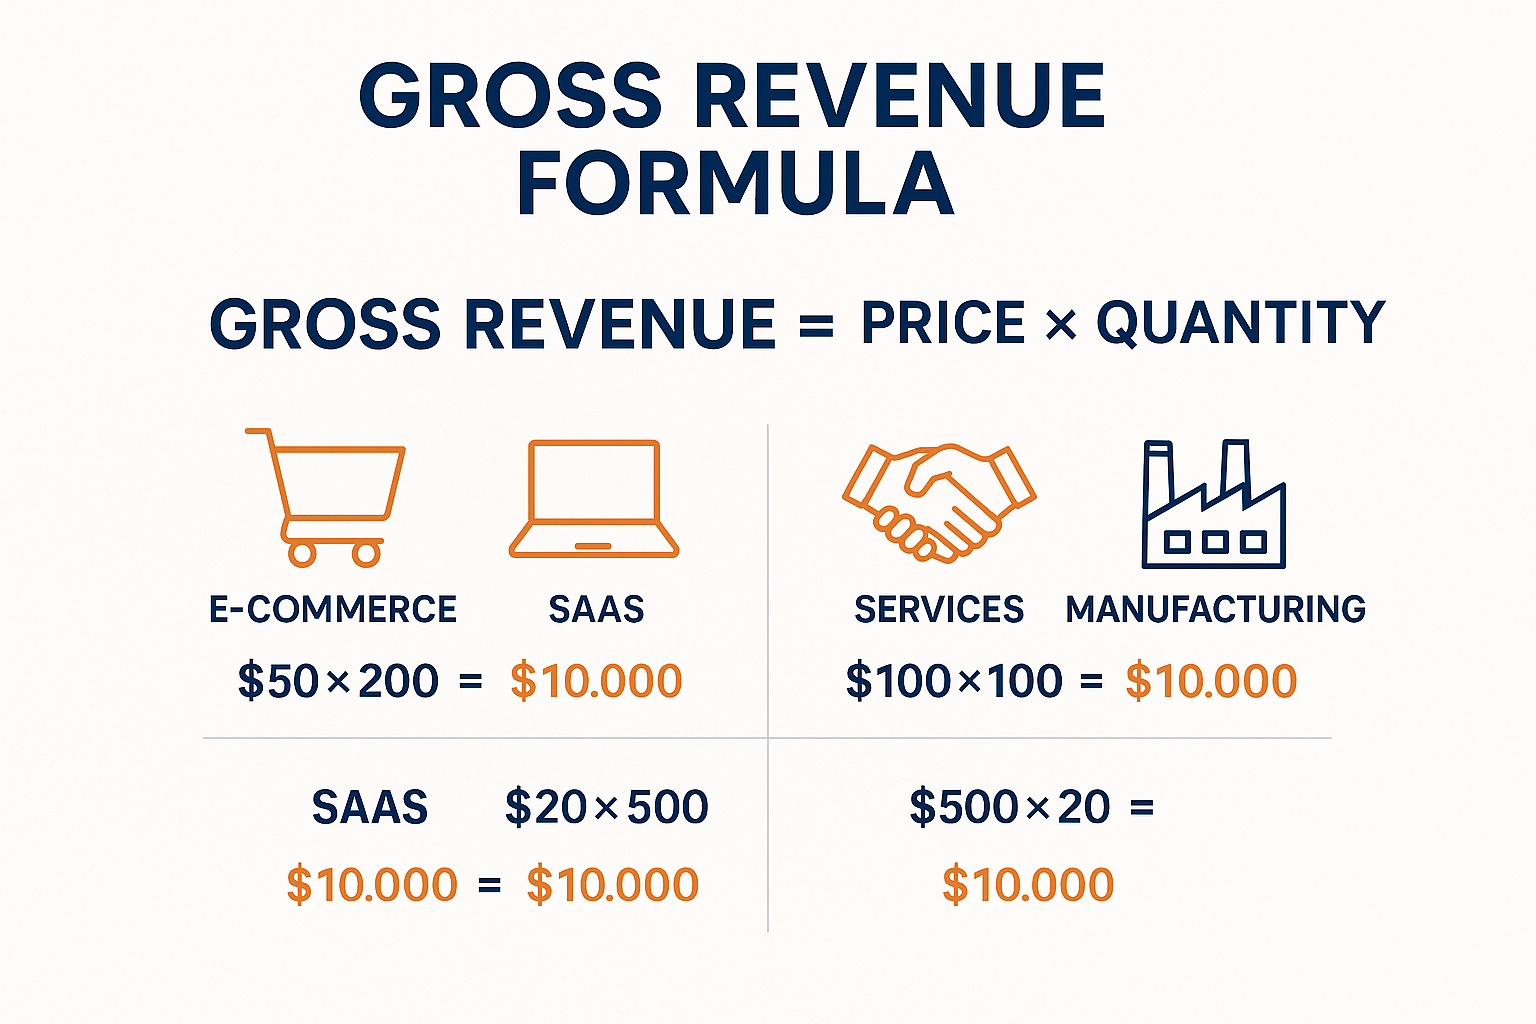
The formula for calculating gross revenue depends on the type of business, but the most common approaches are straightforward:
Basic Product-Based Formula
Gross Revenue = Price per Unit × Number of Units SoldExample: A smartphone manufacturer sells 500,000 phones at $800 each.
- Gross Revenue = $800 × 500,000 = $400,000,000
Service-Based Formula
Gross Revenue = Number of Customers × Average Transaction ValueExample: A consulting firm serves 200 clients with an average project value of $15,000.
- Gross Revenue = 200 × $15,000 = $3,000,000
Multi-Product Formula
For businesses selling multiple products or services:
Gross Revenue = Sum of (Price₁ × Quantity₁) + (Price₂ × Quantity₂) + ... + (Priceₙ × Quantityₙ)Example: An online retailer sells:
- 1,000 books at $20 each = $20,000
- 500 notebooks at $10 each = $5,000
- 300 pens at $5 each = $1,500
- Total Gross Revenue = $26,500
Subscription-Based Formula
Gross Revenue = Number of Subscribers × Subscription Price × Billing PeriodsExample: A streaming service has 100,000 subscribers paying $12.99 per month.
- Monthly Gross Revenue = 100,000 × $12.99 = $1,299,000
- Annual Gross Revenue = $1,299,000 × 12 = $15,588,000
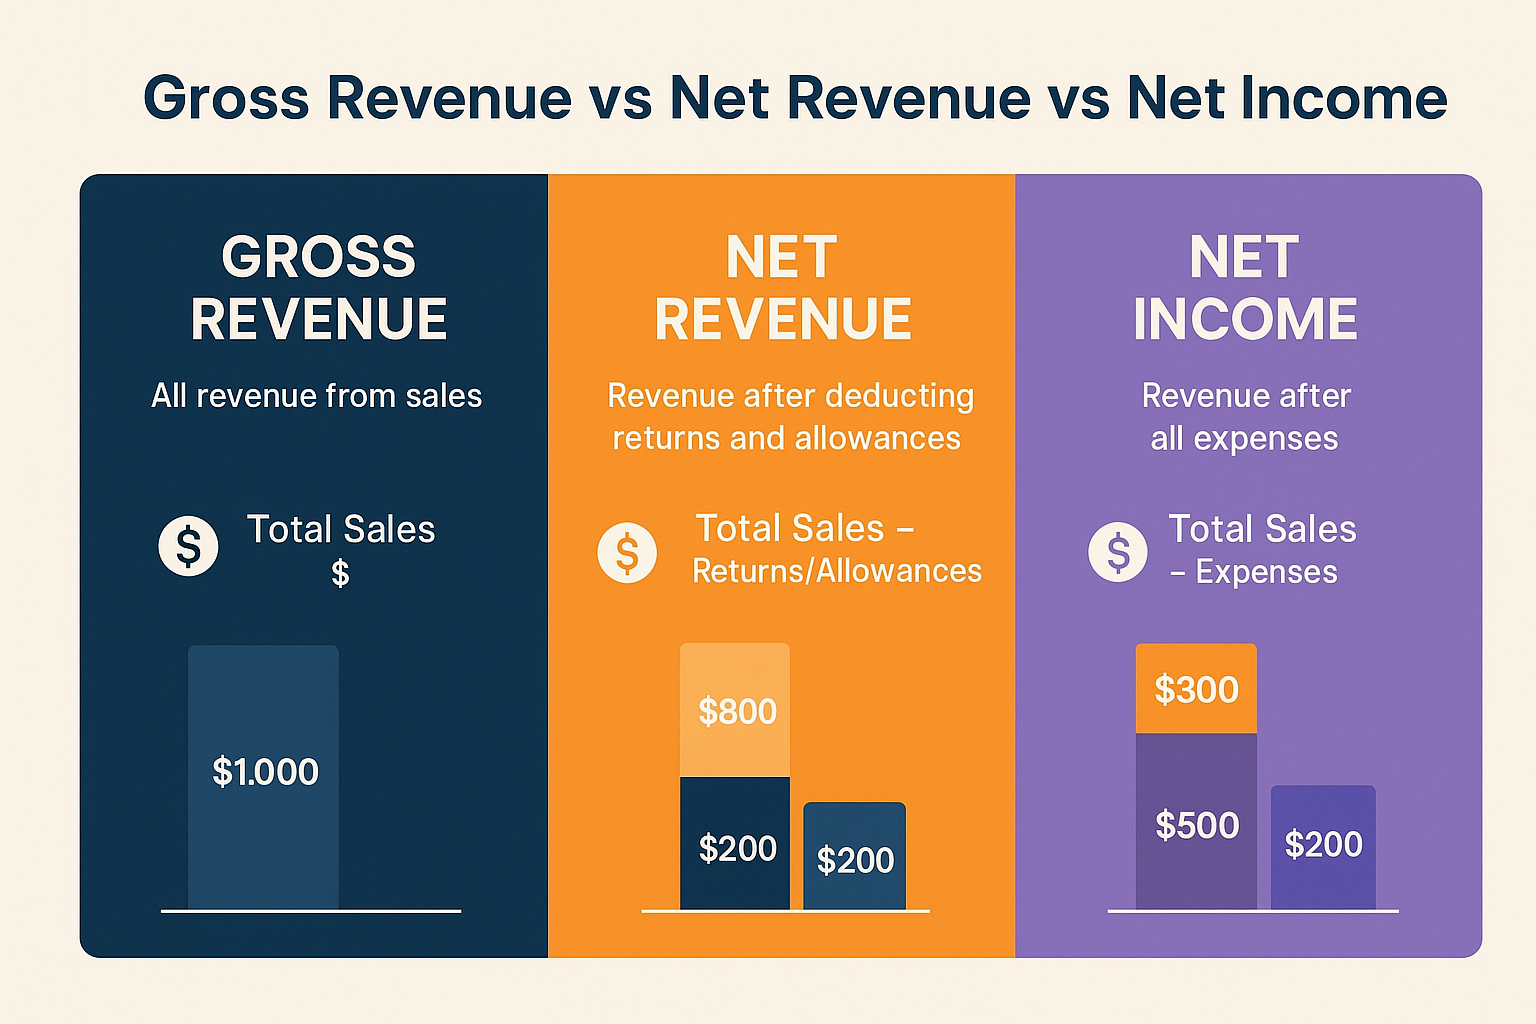
Gross Revenue vs Net Revenue: What’s the Difference?
Many people confuse gross revenue with net revenue, but they’re distinctly different metrics. Let’s break down the key differences:
| Metric | Definition | What It Includes | What It Excludes |
|---|---|---|---|
| Gross Revenue | Total sales before any deductions | All sales transactions, regardless of returns or discounts | Nothing—it’s the raw total |
| Net Revenue | Revenue after sales-related deductions | Actual revenue the company keeps from sales | Returns, refunds, discounts, allowances |
Corporate Finance Institute – Revenue Guide
The Calculation Path
Here’s how you get from gross to net revenue:
Gross Revenue
- Sales Returns
- Discounts Given
- Allowances
= Net Revenue
Real-World Example
Let’s say an electronics retailer has the following for the month:
- Total sales transactions: $500,000 (Gross Revenue)
- Customer returns: $25,000
- Promotional discounts: $15,000
- Damaged goods allowances: $5,000
Net Revenue Calculation:
$500,000 – $25,000 – $15,000 – $5,000 = $455,000
The retailer’s gross revenue is $500,000, but its net revenue is only $455,000—a difference of $45,000 or 9%.
Key Insight: Net revenue gives a more accurate picture of actual sales performance, which is why it’s often called “net sales” on income statements.
Gross Revenue vs Gross Profit vs Net Income
Understanding the relationship between these three metrics is essential for anyone analyzing company financials or making investment decisions. Let’s clarify the distinctions:
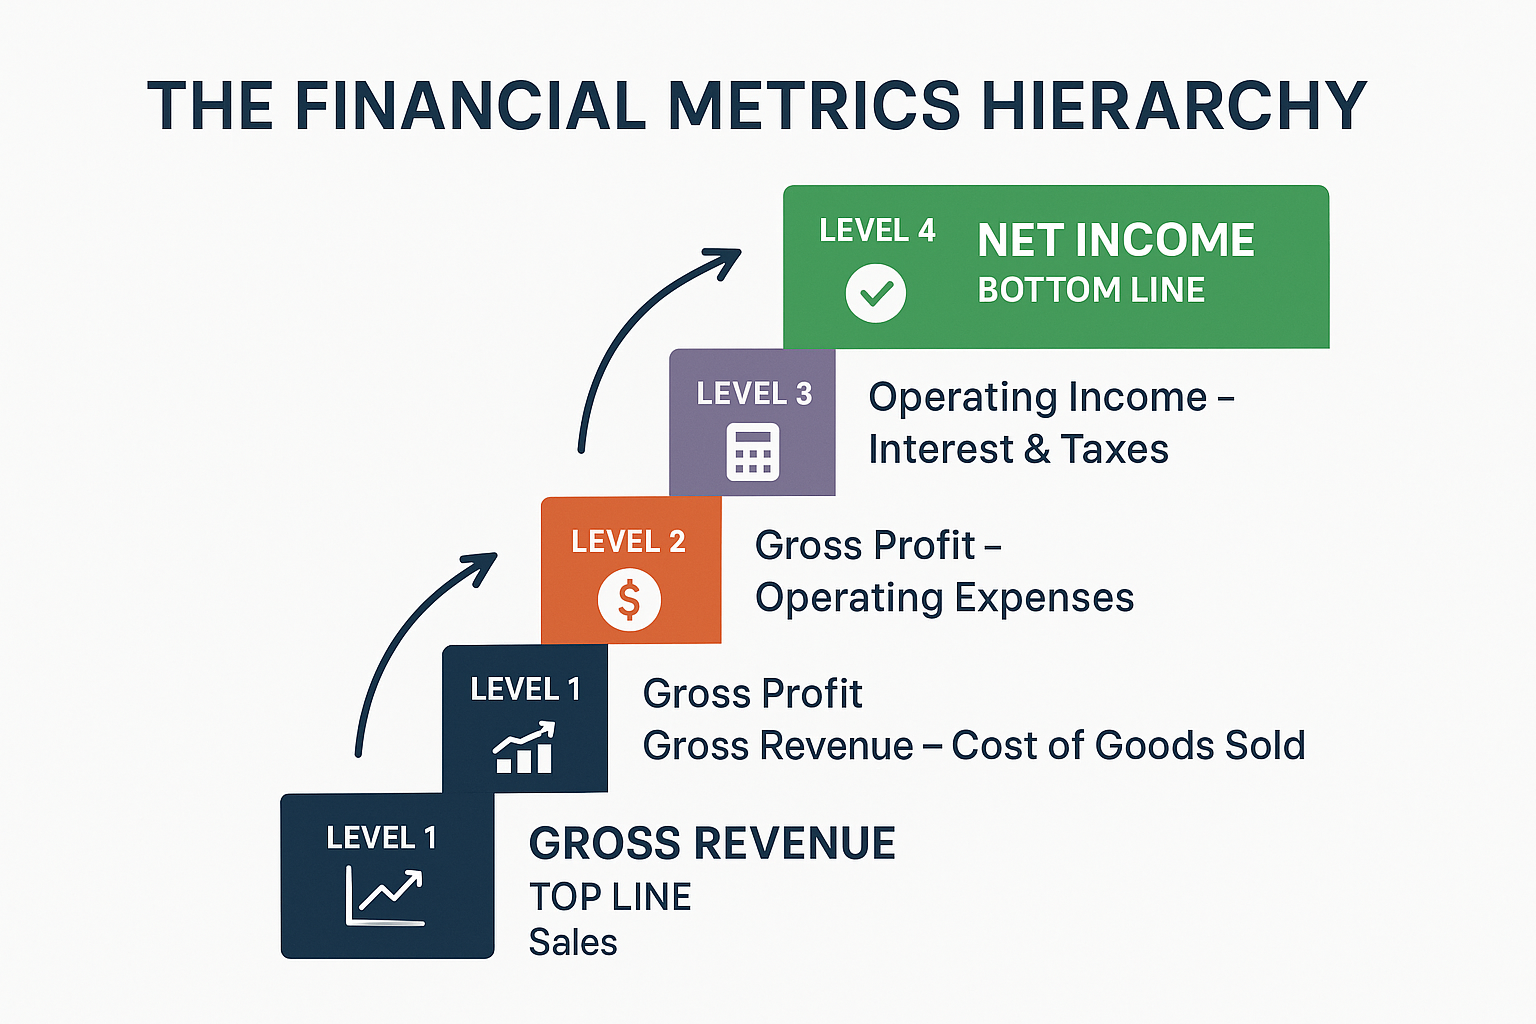
The Financial Hierarchy
Gross Revenue (Top Line)
    ↓
- Returns, Discounts, Allowances
    ↓
= Net Revenue
    ↓
- Cost of Goods Sold (COGS)
    ↓
= Gross Profit
    ↓
- Operating Expenses
- Interest & Taxes
    ↓
= Net Income (Bottom Line)
Detailed Comparison Table
| Metric | Formula | What It Measures | Why It Matters |
|---|---|---|---|
| Gross Revenue | Total Sales | Raw earning power | Market demand and business scale |
| Net Revenue | Gross Revenue – Returns/Discounts | Actual sales kept | True sales performance |
| Gross Profit | Net Revenue – COGS | Production efficiency | How well a company manages direct costs |
| Net Income | Gross Profit – All Expenses | Overall profitability | The actual profit available to shareholders |
Comprehensive Example
Let’s follow a manufacturing company through all these metrics:
ABC Manufacturing Company – Q1 2025
- Gross Revenue: $10,000,000
- Total sales of widgets
- Net Revenue: $9,500,000
- Gross Revenue ($10,000,000)
- Less: Returns and discounts ($500,000)
- Gross Profit: $5,700,000
- Net Revenue ($9,500,000)
- Less: Cost of Goods Sold ($3,800,000)
- Net Income: $1,200,000
- Gross Profit ($5,700,000)
- Less: Operating expenses ($3,000,000)
- Less: Interest ($300,000)
- Less: Taxes ($1,200,000)
What This Tells Us:
- The company generated $10M in total sales (gross revenue)
- It kept 95% after returns and discounts (net revenue)
- It achieved a 60% gross margin ($5.7M ÷ $9.5M)
- Final profitability was 12% of net revenue ($1.2M ÷ $9.5M)
For investors researching stock market opportunities, understanding this progression helps evaluate whether a company’s revenue growth translates into actual profits.
How to Calculate Gross Revenue: Step-by-Step Examples
Let’s walk through practical calculations for different business types to solidify your understanding.
Example 1: E-Commerce Retail Store
Scenario: An online clothing store wants to calculate its monthly gross revenue.
Sales Data for March 2025:
- T-shirts: 2,000 units at $25 each
- Jeans: 800 units at $60 each
- Shoes: 500 units at $80 each
- Accessories: 1,500 units at $15 each
Calculation:
T-shirts:      2,000 × $25 = $50,000
Jeans:         800 × $60 = $48,000
Shoes:         500 × $80 = $40,000
Accessories: 1,500 × $15 = $22,500
────────────────────────────────────
Total Gross Revenue = $160,500Result: The e-commerce store’s gross revenue for March 2025 is $160,500.
Example 2: Software-as-a-Service (SaaS) Company
Scenario: A SaaS company offers three subscription tiers and wants to calculate annual gross revenue.
Subscription Data:
- Basic Plan: 5,000 subscribers at $9.99/month
- Professional Plan: 2,000 subscribers at $29.99/month
- Enterprise Plan: 300 subscribers at $99.99/month
Monthly Calculation:
Basic:        5,000 × $9.99  = $49,950
Professional: 2,000 × $29.99 = $59,980
Enterprise:     300 × $99.99 = $29,997
─────────────────────────────────────
Monthly Gross Revenue     = $139,927
Annual Calculation:
Annual Gross Revenue = $139,927 × 12 = $1,679,124Result: The SaaS company’s gross revenue is approximately $139,927 monthly or $1.68 million annually.
Example 3: Restaurant Business
Scenario: A restaurant tracks daily sales across different revenue streams.
Weekly Sales Data:
- Dine-in sales: $45,000
- Takeout orders: $18,000
- Delivery orders: $12,000
- Catering services: $8,000
- Bar/beverage sales: $15,000
Calculation:
Dine-in:    $45,000
Takeout:    $18,000
Delivery:   $12,000
Catering:    $8,000
Bar:        $15,000
──────────────────────
Weekly Gross Revenue = $98,000
Monthly Projection:
Monthly Gross Revenue = $98,000 × 4.33 = $424,340Result: The restaurant’s gross revenue is approximately $98,000 weekly or $424,340 monthly.
Example 4: Freelance Consultant
Scenario: A freelance marketing consultant wants to calculate quarterly gross revenue.
Q1 2025 Projects:
- Client A: 40 hours at $150/hour
- Client B: 60 hours at $150/hour
- Client C: 25 hours at $150/hour
- Workshop facilitation: 3 sessions at $2,000 each
- One-time strategy audit: $5,000
Calculation:
Client A:     40 × $150 = $6,000
Client B:     60 × $150 = $9,000
Client C:     25 × $150 = $3,750
Workshops:     3 × $2,000 = $6,000
Strategy audit:           $5,000
────────────────────────────────────
Q1 Gross Revenue = $29,750Result: The consultant’s Q1 2025 gross revenue is $29,750.
Advantages and Limitations of Gross Revenue
Like any financial metric, gross revenue has both strengths and weaknesses. Understanding these helps you use them appropriately in your analysis.
Advantages of Tracking Gross Revenue
1. Simplicity and Clarity
- Easy to calculate and understand
- Requires minimal financial knowledge
- Provides a quick snapshot of business activity
2. Growth Measurement
- Excellent for tracking year-over-year or quarter-over-quarter growth
- Helps identify seasonal trends and patterns
- Shows market expansion clearly
3. Market Position Indicator
- Demonstrates market share and competitive standing
- Reflects customer demand and brand strength
- Useful for comparing companies in the same industry
4. Business Valuation
- Often used in valuation multiples (e.g., Price-to-Sales ratio)
- Important for early-stage companies without profits
- Helps determine business scale and potential
5. Investor Communication
- Commonly reported in earnings announcements
- Easy for stakeholders to understand
- Shows top-line momentum
Limitations of Gross Revenue
1. Incomplete Financial Picture
- Doesn’t account for costs or profitability
- It can be misleading if expenses are high
- Doesn’t show operational efficiency
2. Quality vs. Quantity Issue
- High revenue doesn’t guarantee profitability
- May hide unsustainable business practices
- Doesn’t reflect customer retention or satisfaction
3. Manipulation Potential
- Can be inflated through aggressive sales tactics
- Doesn’t account for future returns
- May include non-recurring or one-time sales
4. Industry Comparison Challenges
- Different industries have different margin structures
- Not useful for comparing across diverse sectors
- Doesn’t account for business model differences
5. Ignores Cash Flow
- Revenue recognition doesn’t equal cash received
- Accounts receivable may not be collected
- Timing differences can be significant
When to Prioritize Gross Revenue Analysis
Gross revenue is most useful when:
Comparing companies within the same industry
Tracking growth trends over time
Evaluating early-stage or high-growth companies
Assessing market demand and competitive position
Looking at top-line momentum in earnings reports
When to Look Beyond Gross Revenue
You should focus on other metrics when:
Evaluating profitability and sustainability
Comparing companies across different industries
Assessing operational efficiency
Understanding cash flow and liquidity
Making investment decisions based on returns
For investors exploring dividend investing, remember that dividends come from profits, not revenue—making net income and cash flow more critical than gross revenue.
How Investors Use Gross Revenue in Stock Analysis
Understanding how to interpret gross revenue in the context of stock analysis can significantly improve your investment decision-making. Here’s how savvy investors leverage this metric:
1. Revenue Growth Rate Analysis
The formula for revenue growth:
Revenue Growth Rate = ((Current Period Revenue - Previous Period Revenue) / Previous Period Revenue) × 100Example Analysis:
Company XYZ’s quarterly gross revenue:
- Q1 2024: $500 million
- Q2 2024: $525 million
- Q3 2024: $560 million
- Q4 2024: $600 million
- Q1 2025: $630 million
Q1 2025 Year-over-Year Growth:
(($630M - $500M) / $500M) × 100 = 26% growthWhat This Means:
- Strong 26% YoY growth suggests expanding market share
- Consistent quarter-over-quarter increases show momentum
- Investors typically reward consistent revenue growth with higher valuations
2. Price-to-Sales (P/S) Ratio
The Price-to-Sales ratio formula:
P/S Ratio = Market Capitalization / Annual Gross Revenueor per share:
P/S Ratio = Stock Price / Revenue per ShareExample:
- Company ABC stock price: $50
- Annual revenue per share: $25
- P/S Ratio = $50 / $25 = 2.0
Interpretation:
- A P/S ratio of 2.0 means investors pay $2 for every $1 of revenue
- Lower P/S ratios may indicate undervaluation (or poor profitability)
- Higher P/S ratios suggest growth expectations or premium valuations
- Industry comparison is essential—tech companies often have higher P/S ratios than retailers
3. Revenue Quality Assessment
Smart investors don’t just look at the number—they assess revenue quality:
High-Quality Revenue Indicators:
- Recurring revenue (subscriptions, contracts)
- Diversified customer base
- Long-term contracts
- Organic growth (not from acquisitions)
- Consistent growth patterns
Low-Quality Revenue Red Flags:
- Concentrated customer base (high dependency)
- One-time sales spikes
- Aggressive accounting practices
- Heavy discounting to drive sales
- Revenue from discontinued operations
4. Sector-Specific Revenue Benchmarks
Different industries have different revenue characteristics:
| Industry | Typical P/S Range | Revenue Growth Expectations | Key Considerations |
|---|---|---|---|
| Technology/SaaS | 5-15+ | 20-40%+ annually | Recurring revenue, scalability |
| Retail | 0.3-1.5 | 5-15% annually | Seasonal patterns, margins |
| Healthcare | 1-5 | 10-20% annually | Regulatory factors, R&D |
| Financial Services | 1-4 | 5-12% annually | Interest rate sensitivity |
| Consumer Goods | 1-3 | 3-10% annually | Brand strength, distribution |
5. Combining Gross Revenue with Other Metrics
Experienced investors use gross revenue alongside other metrics for comprehensive analysis:
The Complete Picture:
Gross Revenue Growth → Shows market demand
        +
Gross Margin Trend → Shows pricing power and cost management
        +
Operating Margin → Shows operational efficiency
        +
Free Cash Flow → Shows cash generation ability
        =
Complete Investment Thesis
Example Scenario:
Company DEF Analysis:
- Gross Revenue Growth: +30% YoY
- Gross Margin: Declining from 70% to 65%
- Operating Margin: Flat at 15%
- Free Cash Flow: Growing +15% YoY
Interpretation: While revenue growth is strong, declining gross margins suggest increased competition or pricing pressure. The company is growing but facing margin compression—a mixed signal requiring deeper investigation.
6. Red Flags in Revenue Reporting
Watch for these warning signs:
Revenue recognition changes – Companies altering how they count revenue
Channel stuffing – Pushing excess inventory to distributors to inflate sales
Acquisition-driven growth – Revenue growth only from buying other companies
Inconsistent growth – Wild fluctuations without clear seasonal patterns
Revenue without cash flow – Growing revenue but declining cash collections
Understanding these nuances helps when evaluating opportunities in the stock market and protects against value traps.
Common Mistakes When Analyzing Gross Revenue
Even experienced investors and business owners sometimes misinterpret gross revenue. Avoid these common pitfalls:
Mistake #1: Confusing Revenue with Profit
The Error:
Assuming high revenue automatically means high profits.
The Reality:
A company can have massive revenue but still lose money if expenses exceed income.
Example:
- Company A: $1 billion revenue, $50 million profit (5% margin)
- Company B: $500 million revenue, $100 million profit (20% margin)
Company B is more profitable despite lower revenue.
The Fix: Always examine profit margins and net income alongside revenue.
Mistake #2: Ignoring Revenue Quality
The Error:
Treating all revenue as equal regardless of source or sustainability.
The Reality:
Recurring subscription revenue is more valuable than one-time sales.
Example:
- Business A: $10M from long-term contracts
- Business B: $10M from one-time project sales
Business A has more predictable, valuable revenue.
The Fix: Analyze revenue composition, customer retention, and contract duration.
Mistake #3: Overlooking Industry Context
The Error:
Comparing revenue metrics across different industries without context.
The Reality:
A 10% revenue growth rate might be excellent for a utility company but concerning for a tech startup.
Example:
- Utility company: 3% growth (good for the sector)
- SaaS startup: 15% growth (below 30-50% expectation)
The Fix: Compare companies within the same industry and consider sector norms.
Mistake #4: Neglecting Timing and Seasonality
The Error:
Not accounting for seasonal patterns or revenue timing.
The Reality:
Many businesses have predictable seasonal fluctuations.
Example:
A retail company’s Q4 revenue (holiday season) might be 40% of annual revenue. Comparing Q4 to Q1 without context would be misleading.
The Fix: Use year-over-year comparisons and understand industry seasonality.
Mistake #5: Falling for “Vanity Metrics”
The Error:
Focusing on impressive revenue numbers while ignoring underlying problems.
The Reality:
Companies can boost revenue through unsustainable tactics like deep discounting or channel stuffing.
Example:
A company doubles revenue by cutting prices 60%, destroying margins and long-term viability.
The Fix: Examine how revenue growth is achieved and its impact on profitability.
Mistake #6: Ignoring Cash Flow
The Error:
Not recognizing that revenue doesn’t equal cash in hand.
The Reality:
Revenue is often recognized before cash is collected (accounts receivable).
Example:
A company reports $10M revenue but only collects $6M in cash, with $4M in unpaid invoices that may never be collected.
The Fix: Review cash flow statements and days sales outstanding (DSO) metrics.
Mistake #7: Missing Revenue Recognition Changes
The Error:
Not noticing when companies change their revenue recognition policies.
The Reality:
Accounting changes can artificially inflate or deflate revenue without actual business changes.
Example:
A software company switches from recognizing revenue over contract life to upfront recognition, creating a one-time revenue spike.
The Fix: Read footnotes in financial statements and watch for accounting policy changes.
Gross Revenue in Different Business Models
Different business models calculate and interpret gross revenue differently. Understanding these nuances is crucial for accurate analysis.
E-Commerce & Retail
Revenue Characteristics:
- High volume, lower margins
- Significant returns and refunds
- Seasonal fluctuations
Calculation Focus:
Gross Revenue = Total Orders × Average Order ValueKey Metrics to Track:
- Average Order Value (AOV)
- Conversion rate
- Customer acquisition cost vs. revenue
Example:
An online retailer with 50,000 monthly orders at $75 AOV generates:
- Monthly Gross Revenue = 50,000 × $75 = $3,750,000
Software-as-a-Service (SaaS)
Revenue Characteristics:
- Recurring monthly/annual subscriptions
- High gross margins (70-90%)
- Predictable revenue streams
Calculation Focus:
Gross Revenue = Monthly Recurring Revenue (MRR) × 12
or
Annual Recurring Revenue (ARR)
Key Metrics to Track:
- MRR growth rate
- Customer churn rate
- Customer Lifetime Value (LTV)
Example:
A SaaS company with $500,000 MRR:
- Annual Gross Revenue = $500,000 × 12 = $6,000,000
Manufacturing
Revenue Characteristics:
- Dependent on production capacity
- Inventory considerations
- B2B relationships and contracts
Calculation Focus:
Gross Revenue = Units Produced × Selling Price per UnitKey Metrics to Track:
- Production capacity utilization
- Inventory turnover
- Contract backlog
Example:
A manufacturer producing 100,000 units at $150 each:
- Gross Revenue = 100,000 × $150 = $15,000,000
Professional Services
Revenue Characteristics:
- Time-based billing
- Project-based revenue
- Limited scalability
Calculation Focus:
Gross Revenue = Billable Hours × Hourly Rate
or
Number of Projects × Average Project Value
Key Metrics to Track:
- Utilization rate
- Realization rate (billed vs. collected)
- Average project size
Example:
A consulting firm billing 10,000 hours at $200/hour:
- Gross Revenue = 10,000 × $200 = $2,000,000
Marketplace Platforms
Revenue Characteristics:
- Commission-based or transaction fees
- Gross Merchandise Value (GMV) vs. actual revenue
Important Distinction:
Marketplaces report GMV (total transaction value) separately from revenue (their commission).
Calculation Focus:
Platform Gross Revenue = GMV × Commission RateExample:
An online marketplace with $100M GMV and 15% commission:
- Gross Revenue = $100,000,000 × 0.15 = $15,000,000
- (Not $100M—that’s GMV)
Advertising-Based Models
Revenue Characteristics:
- Based on impressions, clicks, or conversions
- Highly dependent on user engagement
- Variable pricing
Calculation Focus:
Gross Revenue = Total Impressions × CPM / 1,000
or
Total Clicks × CPC
Key Metrics to Track:
- User engagement rates
- Average revenue per user (ARPU)
- Ad inventory fill rates
Example:
A media platform with 50 million impressions at $5 CPM:
- Gross Revenue = (50,000,000 / 1,000) × $5 = $250,000
Understanding these differences helps when evaluating investment opportunities across various sectors and when researching what moves the stock market.
Real-World Gross Revenue Examples from Major Companies
Let’s examine how actual publicly-traded companies report and use gross revenue:
Example 1: Amazon (E-Commerce & Cloud Services)
2024 Annual Gross Revenue: ~$575 billion
Revenue Breakdown:
- Online stores: ~$220 billion
- Third-party seller services: ~$140 billion
- AWS (cloud services): ~$90 billion
- Subscription services: ~$40 billion
- Advertising: ~$47 billion
- Physical stores: ~$20 billion
Key Insights:
- Diversified revenue streams reduce risk
- AWS has lower revenue but higher margins than retail
- Year-over-year growth of approximately 11%
Investor Takeaway: Amazon’s gross revenue growth has slowed from 20-30% historically to single digits, but profitability has improved as AWS and advertising grow.
Example 2: Apple (Consumer Electronics)
2024 Annual Gross Revenue: ~$385 billion
Revenue Breakdown:
- iPhone: ~$200 billion (52%)
- Services: ~$85 billion (22%)
- Mac: ~$29 billion (7.5%)
- iPad: ~$28 billion (7%)
- Wearables/Home/Accessories: ~$40 billion (10%)
Key Insights:
- Heavy dependence on iPhone (over 50% of revenue)
- The services segment is growing faster than the products
- Gross margin approximately 44%
Investor Takeaway: While iPhone revenue dominates, the shift toward higher-margin services revenue improves overall profitability and reduces cyclicality.
Example 3: Netflix (Subscription Streaming)
2024 Annual Gross Revenue: ~$33 billion
Revenue Model:
- Subscription-based recurring revenue
- Multiple pricing tiers across global markets
- Recently added advertising-supported tier
Key Metrics:
- ~260 million subscribers globally
- Average revenue per member: ~$11-12/month
- Revenue growth: ~10% year-over-year
Investor Takeaway: Netflix’s revenue is highly predictable due to its subscription model, making it easier to forecast than transaction-based businesses. For those interested in high dividend stocks, note that Netflix doesn’t pay dividends, reinvesting all profits in content.
Example 4: Walmart (Retail)
2024 Annual Gross Revenue: ~$648 billion
Revenue Characteristics:
- Massive scale, thin margins (~25% gross margin)
- Consistent low-single-digit revenue growth
- Mix of in-store and e-commerce
Key Insights:
- Revenue growth of 5-6% annually
- E-commerce is growing 20%+ while stores grow 2-3%
- Gross revenue doesn’t reflect profitability challenges
Investor Takeaway: Walmart demonstrates that massive gross revenue doesn’t automatically mean massive profits—net margin is only about 2.5%.
Example 5: Salesforce (SaaS)
2024 Annual Gross Revenue: ~$34 billion
Revenue Characteristics:
- Subscription and support: ~90% of revenue
- Professional services: ~10% of revenue
- High gross margins (75%+)
Key Metrics:
- Revenue growth: 10-12% annually
- Remaining performance obligation: $49+ billion (future contracted revenue)
- Customer retention rate: >90%
Investor Takeaway: SaaS companies like Salesforce trade at higher P/S ratios (8-10x) than retailers (0.5-1x) because of recurring revenue, high margins, and predictability.
Interactive Gross Revenue Calculator
💰 Gross Revenue Calculator
Calculate your business’s gross revenue based on your business model
💡 Remember: Gross revenue is your total sales before any deductions. To get net revenue, you’ll need to subtract returns, discounts, and allowances. To get net income, you’ll also subtract all business expenses.
Key Risks and Considerations
When analyzing or relying on gross revenue data, be aware of these important risks and limitations:
Revenue Recognition Risks
The Challenge: Different accounting methods can dramatically affect reported revenue timing.
What to Watch:
- Companies switching from cash to accrual accounting (or vice versa)
- Changes in revenue recognition policies (especially after ASC 606 implementation)
- Aggressive revenue recognition practices
- Revenue recognized before cash is collected
Example: A software company might recognize 100% of a 3-year contract upfront instead of spreading it over the contract period, creating a misleading revenue spike.
Quality vs Quantity Issues
The Challenge: Not all revenue is created equal in terms of sustainability and value.
Red Flags:
- Heavy reliance on one-time sales vs. recurring revenue
- Customer concentration (one customer representing >10% of revenue)
- Revenue from discontinued products or services
- Sales are driven primarily by deep discounting
Better Alternative: Look for businesses with diversified, recurring, high-margin revenue streams.
Cash Flow Disconnect
The Challenge: Revenue doesn’t equal cash in the bank.
Key Metrics to Monitor:
- Days Sales Outstanding (DSO) – how long it takes to collect payment
- Accounts receivable aging – how much revenue is still unpaid
- Cash conversion cycle – time from spending cash to collecting it
Warning Sign: Growing revenue but declining or negative operating cash flow often indicates collection problems or unsustainable growth.
Channel Stuffing and Manipulation
The Challenge: Companies can artificially inflate revenue through questionable practices.
Common Tactics:
- Shipping excess inventory to distributors near quarter-end
- Offering extended payment terms to boost sales
- Recording revenue from bill-and-hold arrangements
- Recognizing revenue from barter transactions
How to Detect: Look for unusual spikes in accounts receivable, inventory buildup at distributors, or revenue that significantly outpaces industry growth.
Currency and International Considerations
The Challenge: For multinational companies, currency fluctuations can distort revenue trends.
What to Understand:
- Reported revenue vs. constant currency revenue
- Impact of foreign exchange hedging
- Geographic revenue concentration risks
- Different accounting standards across countries
Investor Tip: Many companies report both “as reported” and “constant currency” revenue growth to show underlying business performance.
Cyclicality and Seasonality
The Challenge: Many businesses have predictable revenue patterns that can mislead if not understood.
Industries with High Seasonality:
- Retail (holiday season concentration)
- Tourism and hospitality (summer/winter peaks)
- Agriculture (harvest cycles)
- Tax preparation services (tax season)
Best Practice: Always compare year-over-year performance for the same period rather than sequential quarters.
Understanding these nuances becomes especially important when researching market volatility and how revenue surprises can impact stock prices.
How Gross Revenue Fits Into Financial Analysis
To truly understand a company’s financial health, you need to see how gross revenue connects with other key metrics. Here’s the complete picture:
The Financial Metrics Hierarchy
Level 1: Top Line (Revenue Metrics)
- Gross Revenue → Shows total market demand
- Net Revenue → Shows actual sales kept
- Revenue Growth Rate → Shows business momentum
Level 2: Profitability Metrics
- Gross Profit Margin → Shows production efficiency
- Operating Margin → Shows operational efficiency
- Net Profit Margin → Shows overall profitability
Level 3: Efficiency Metrics
- Return on Assets (ROA) → Shows asset utilization
- Return on Equity (ROE) → Shows shareholder returns
- Asset Turnover → Shows revenue generation efficiency
Level 4: Cash Flow Metrics
- Operating Cash Flow → Shows actual cash generated
- Free Cash Flow → Shows cash available after investments
- Cash Conversion Rate → Shows how revenue becomes cash
Comprehensive Analysis Framework
When evaluating a company, use this framework:
Step 1: Revenue Analysis
What is the gross revenue trend? (Growing, stable, declining?)
What is the revenue growth rate compared to competitors?
Is growth organic or acquisition-driven?
What is the revenue quality? (Recurring vs. one-time)
Step 2: Profitability Analysis
What are the gross, operating, and net margins?
Are margins improving or declining?
How do margins compare to industry averages?
Is revenue growth translating to profit growth?
Step 3: Efficiency Analysis
How efficiently does the company convert revenue to cash?
What is the return on invested capital?
Are working capital needs increasing or decreasing?
How does revenue per employee compare to peers?
Step 4: Risk Assessment
Is revenue concentrated in a few customers or products?
Are there signs of aggressive accounting?
How stable is the revenue stream?
What external factors could impact future revenue?
Example: Complete Financial Analysis
Company XYZ – 2025 Analysis
Revenue Metrics:
- Gross Revenue: $500M (up 20% YoY)
- Net Revenue: $475M (95% of gross)
- Revenue Growth: 20% vs. industry average of 12%
Profitability Metrics:
- Gross Margin: 65% (stable)
- Operating Margin: 22% (up from 20%)
- Net Margin: 15% (up from 13%)
Efficiency Metrics:
- ROE: 18% (above 15% threshold)
- Cash Conversion: 95% (excellent)
- DSO: 45 days (industry average)
Risk Factors:
- Top customer = 8% of revenue (acceptable)
- Recurring revenue = 75% of total (strong)
- Geographic diversification: 60% US, 40% international
Conclusion: Strong investment candidate with healthy revenue growth, improving margins, and a low risk profile.
This type of comprehensive analysis helps when making smart investment moves and building a diversified portfolio.
Best Practices for Tracking and Reporting Gross Revenue
Whether you’re a business owner, investor, or analyst, following these best practices ensures accurate revenue tracking and meaningful analysis:
For Business Owners
1. Implement Robust Accounting Systems
- Use professional accounting software (QuickBooks, Xero, NetSuite)
- Set up proper revenue recognition rules
- Automate revenue tracking where possible
- Maintain detailed transaction records
2. Establish Clear Revenue Recognition Policies
- Define when revenue is recognized (delivery, payment, contract signing)
- Document policies in writing
- Train staff on proper procedures
- Ensure compliance with accounting standards (GAAP or IFRS)
3. Track Revenue by Multiple Dimensions
- By product/service line
- By customer segment
- By geographic region
- By sales channel
- By time period (daily, weekly, monthly, quarterly)
4. Monitor Key Revenue Metrics
- Revenue growth rate (MoM, QoQ, YoY)
- Average transaction value
- Customer acquisition cost vs. revenue
- Revenue per customer
- Revenue concentration ratios
5. Reconcile Regularly
- Match revenue records with bank deposits
- Reconcile accounts receivable monthly
- Review and investigate discrepancies immediately
- Conduct quarterly revenue audits
For Investors and Analysts
1. Look Beyond the Headline Number
- Read the complete financial statements, not just press releases
- Review the notes to the financial statements
- Compare reported vs. constant currency revenue
- Analyze revenue composition and quality
2. Use Comparative Analysis
- Compare to prior periods (YoY, QoQ)
- Benchmark against competitors
- Evaluate against industry averages
- Consider market conditions and economic factors
3. Verify Revenue Quality
- Check accounts receivable trends
- Review customer concentration
- Assess revenue recognition policies
- Look for one-time vs. recurring revenue
4. Calculate Key Ratios
- Price-to-Sales (P/S) ratio
- Revenue per share
- Revenue growth rate
- Revenue to operating cash flow ratio
5. Watch for Warning Signs
- Revenue growing faster than receivables (potential issue)
- Frequent changes in accounting policies
- Unusual quarter-end revenue spikes
- Declining revenue quality metrics
Common Reporting Formats
Monthly Revenue Report Template:
COMPANY NAME - Monthly Revenue Report
Month: [Month Year]

GROSS REVENUE SUMMARY
Current Month:        $XXX,XXX
Previous Month:       $XXX,XXX
Month-over-Month:     +/- X%
Same Month Last Year: $XXX,XXX
Year-over-Year:       +/- X%

REVENUE BY CATEGORY
Product Line A:       $XXX,XXX (XX%)
Product Line B:       $XXX,XXX (XX%)
Product Line C:       $XXX,XXX (XX%)

YEAR-TO-DATE
YTD Revenue:          $XXX,XXX
YTD Target:           $XXX,XXX
Variance:             +/- X%

KEY METRICS
Average Order Value:  $XXX
Number of Transactions: XXX
Revenue per Customer: $XXX
This structured approach helps maintain accuracy and provides actionable insights for decision-making.
Industry-Specific Gross Revenue Benchmarks (2025)
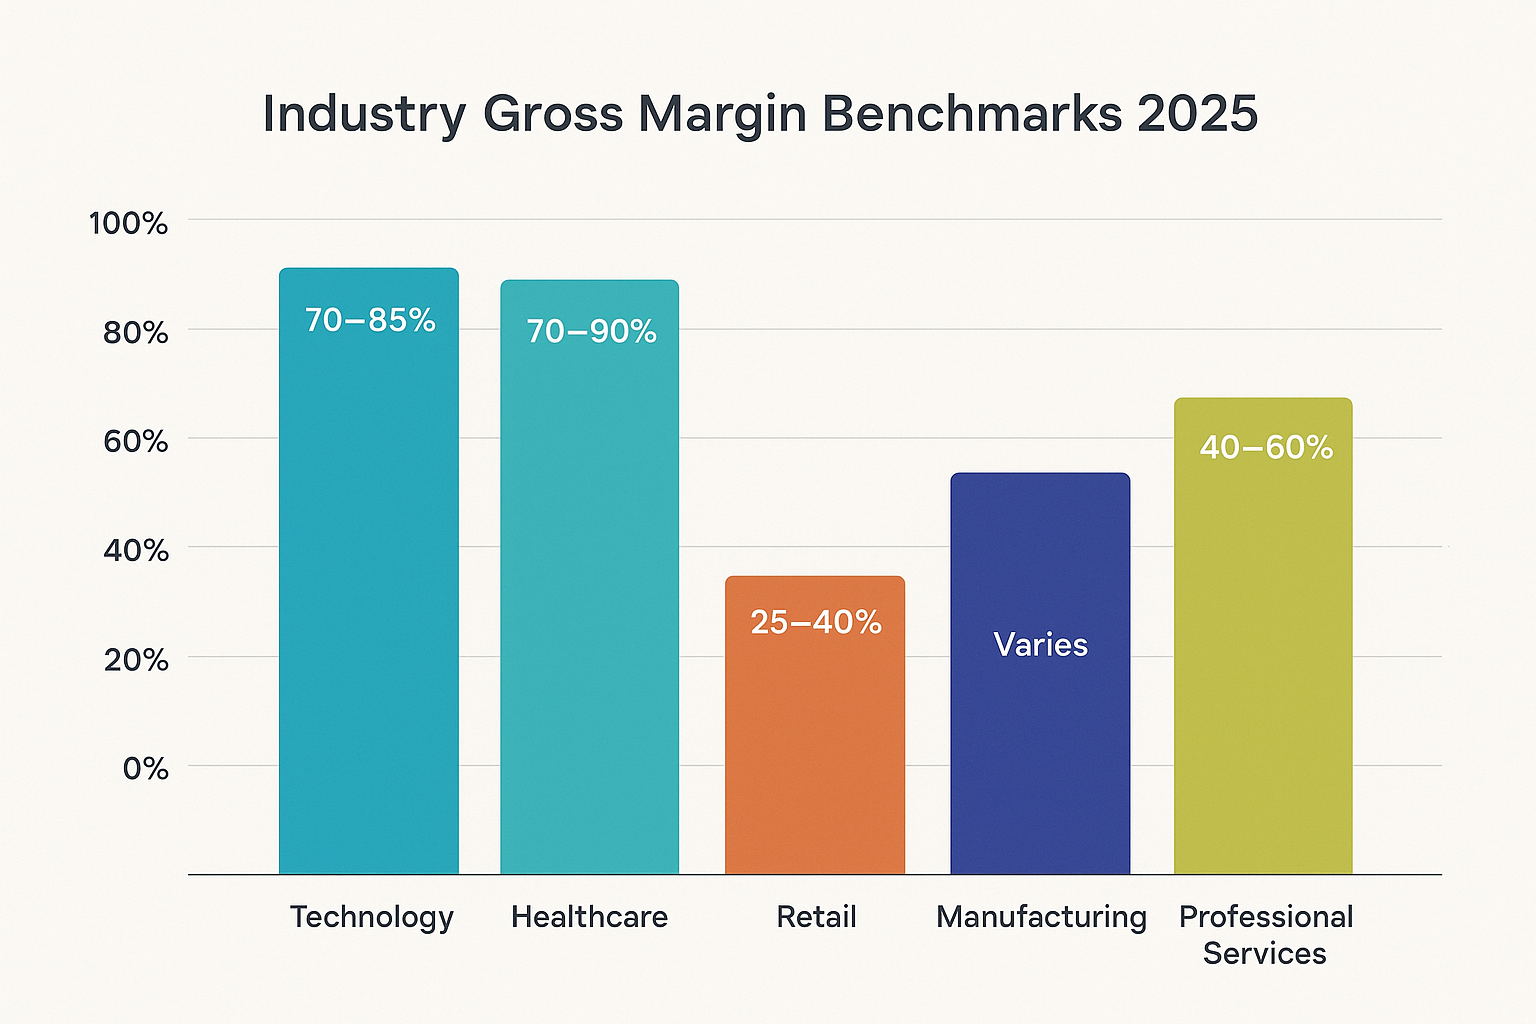
Understanding industry benchmarks helps contextualize whether a company’s gross revenue performance is strong, average, or weak. Here are 2025 benchmarks across major sectors:
Technology & Software
SaaS Companies:
- Expected annual growth: 25-40% for early stage, 15-25% for mature
- Typical gross margin: 70-85%
- Revenue concentration: Ideally, <10% from any single customer
- Churn impact: 5-7% annual churn is acceptable
E-Commerce Platforms:
- Expected annual growth: 20-30%
- Typical gross margin: 40-60%
- Average order value trends: Should increase 5-10% annually
- Customer acquisition cost: Should be <30% of customer lifetime value
Retail & Consumer
Traditional Retail:
- Expected annual growth: 3-8%
- Typical gross margin: 25-40%
- Same-store sales growth: 2-5% considered healthy
- E-commerce percentage: Should be growing 15-25% annually
E-Commerce Retail:
- Expected annual growth: 15-25%
- Typical gross margin: 30-50%
- Return rates: 15-30% (varies by category)
- Repeat customer revenue: Should exceed 40% of total
Healthcare & Pharmaceuticals
Pharmaceutical Companies:
- Expected annual growth: 5-12%
- Typical gross margin: 70-90%
- R&D as % of revenue: 15-25%
- Patent cliff risk: Monitor expiring patents
Healthcare Services:
- Expected annual growth: 8-15%
- Typical gross margin: 35-55%
- Payer mix: Diversification is important for stability
- Regulatory compliance costs: 5-10% of revenue
Financial Services
Banks:
- Expected annual growth: 3-8%
- Net interest margin: 3-4%
- Non-interest income: Should be 30-40% of total revenue
- Loan growth: Should align with GDP growth + 2-3%
Insurance Companies:
- Expected annual growth: 5-10%
- Combined ratio: <100% indicates profitability
- Premium growth: 5-8% annually
- Investment income: Critical secondary revenue source
Manufacturing & Industrial
Industrial Manufacturing:
- Expected annual growth: 5-10%
- Typical gross margin: 25-40%
- Capacity utilization: 75-85% optimal
- Order backlog: 3-6 months is considered healthy
Consumer Goods Manufacturing:
- Expected annual growth: 3-7%
- Typical gross margin: 35-50%
- Brand premium: Strong brands command a 10-20% price premium
- Distribution efficiency: Key to margin improvement
Professional Services
Consulting Firms:
- Expected annual growth: 10-20%
- Typical gross margin: 40-60%
- Utilization rate: 70-80% target
- Revenue per consultant: $200K-$500K annually
Legal Services:
- Expected annual growth: 5-10%
- Typical gross margin: 35-50%
- Billable hours: 1,600-1,900 hours per attorney annually
- Realization rate: 85-95% (billed vs. collected)
Quick Reference Table
| Industry | Growth Rate | Gross Margin | Key Metric |
|---|---|---|---|
| SaaS | 25-40% | 70-85% | MRR growth |
| E-Commerce | 15-25% | 30-50% | AOV trends |
| Retail | 3-8% | 25-40% | Comp sales |
| Pharma | 5-12% | 70-90% | Pipeline value |
| Banking | 3-8% | 3-4% NIM | Loan growth |
| Manufacturing | 5-10% | 25-40% | Capacity utilization |
| Consulting | 10-20% | 40-60% | Utilization rate |
Note: These are general benchmarks for 2025. Individual company performance should be evaluated within the specific context of their market position, competitive landscape, and strategic initiatives.
Gross Revenue Trends and Future Outlook (2025)
The business landscape is evolving rapidly, and understanding current trends helps predict how gross revenue dynamics may change:
Emerging Revenue Trends
1. Subscription Economy Expansion
The shift from one-time purchases to recurring subscriptions continues accelerating:
- Expected to reach $1.5 trillion globally by 2026
- SaaS adoption growing 18% annually
- Even traditional products (cars, software, appliances) are moving to subscription models
- Investor Impact: Higher valuations for predictable recurring revenue
2. Direct-to-Consumer (DTC) Growth
Brands bypassing traditional retail channels:
- DTC revenue expected to exceed $200 billion in 2025
- Higher margins (30-50% vs. 20-30% wholesale)
- Better customer data and relationships
- Challenge: Customer acquisition costs rising 15-20% annually
3. Platform and Marketplace Dominance
Multi-sided platforms capturing increasing market share:
- Marketplace GMV growing 20%+ annually
- Platform businesses are valued at 2-5x higher multiples than traditional businesses
- Network effects create winner-take-most dynamics
- Key Metric: GMV growth and take rate (commission percentage)
4. Artificial Intelligence Revenue Impact
AI is creating new revenue streams and efficiencies:
- AI-driven personalization is increasing revenue 10-30%
- Automated pricing optimization improving margins 5-15%
- AI products and services are creating entirely new revenue categories
- Consideration: Implementation costs vs. revenue benefits
5. Sustainability and ESG Revenue
Environmental and social factors influencing purchasing:
- Consumers are willing to pay a 5-10% premium for sustainable products
- ESG-focused companies showing 10-20% higher revenue growth
- Regulatory requirements creating new compliance revenue streams
- Trend: Sustainability becoming revenue driver, not just cost center
2025 Economic Factors Affecting Revenue
Macroeconomic Considerations:
Interest Rate Environment:
- Higher rates are reducing consumer spending by 3-5%
- B2B sales cycles are extending by 20-30%
- Subscription renewals under pressure
- Strategy: Focus on customer retention and value demonstration
Inflation Impact:
- Input costs rising 4-6% annually
- Pricing power is crucial for maintaining margins
- Consumer price sensitivity is increasing
- Approach: Strategic pricing with clear value communication
Labor Market Dynamics:
- Service business revenue constrained by talent availability
- Wage inflation is affecting service delivery costs
- Automation is becoming a revenue enabler
- Solution: Technology-enabled service delivery models
Global Trade Patterns:
- Supply chain diversification is affecting revenue recognition timing
- Tariffs and trade policies impacting cross-border revenue
- Regionalization is creating new market opportunities
- Adaptation: Multi-region revenue strategies
Future Revenue Model Predictions
Next 3-5 Years:
1. Hybrid Revenue Models
- Combining subscriptions, transactions, and advertising
- Example: Base subscription + usage fees + premium features
- Optimizes customer lifetime value
- Provides revenue stability with growth upside
2. Outcome-Based Pricing
- Shift from selling products/time to selling results
- Revenue tied to customer success metrics
- Requires sophisticated tracking and attribution
- Higher margins for proven value delivery
3. Embedded Finance Revenue
- Non-financial companies offering financial services
- Payment processing, lending, and insurance are integrated into core offerings
- An additional 10-30% revenue from financial services
- Examples: Shopify Capital, Tesla Insurance
4. Data Monetization
- First-party data is becoming a significant revenue source
- Privacy-compliant data products and insights
- B2B data services growing 25%+ annually
- Requires robust data infrastructure and governance
5. Community and Creator Economy
- Platform fees from creator transactions
- Community membership revenue models
- User-generated content driving engagement and revenue
- Decentralized revenue-sharing models
Investment Implications
For those exploring passive income opportunities, understanding these revenue trends helps identify companies positioned for sustainable growth:
High-Potential Characteristics:
Recurring revenue models (70%+ of total revenue)
Strong gross margins (60%+ for software, 40%+ for products)
Diversified revenue streams (no single source >30%)
Positive unit economics (LTV: CAC ratio >3:1)
Growing market with tailwinds
Pricing power demonstrated through margin stability
Warning Signs:
Revenue growth without margin improvement
Increasing customer acquisition costs
Declining customer retention rates
Heavy dependence on one-time sales
Margin compression despite revenue growth
Inability to pass costs to customers
Conclusion: Mastering Gross Revenue Analysis
Understanding gross revenue is fundamental to financial literacy, whether you’re analyzing investment opportunities, running a business, or simply trying to make sense of company earnings reports. Let’s recap the essential points:
Key Principles to Remember
1. Gross Revenue Is Just the Starting Point
While gross revenue tells you how much a business sells, it’s only the first chapter of the financial story. True business health requires examining profitability, cash flow, and operational efficiency alongside revenue metrics.
2. Context Matters Enormously
A $10 million revenue company in the SaaS industry has very different implications than a $10 million retail business. Always consider industry norms, business models, and competitive landscapes when interpreting revenue data.
3. Quality Trumps Quantity
$100 million in recurring subscription revenue from diverse customers is far more valuable than $100 million from one-time sales to a handful of clients. Revenue quality, sustainability, and predictability matter as much as the absolute number.
4. Trends Reveal More Than Snapshots
A single quarter’s gross revenue number has limited value. Tracking trends over multiple periods, comparing year-over-year growth, and understanding seasonal patterns provides genuine insight into the business trajectory.
5. Revenue Must Convert to Value
For investors, revenue only matters if it eventually translates into profits and cash flow that can be returned to shareholders through dividends or reinvested for growth. For those interested in dividend investing, remember that dividends come from profits, not revenue.
Actionable Next Steps
For Investors:
Develop a Revenue Analysis Checklist
- Revenue growth rate (YoY, QoQ)
- Revenue quality indicators
- Price-to-Sales ratio vs. industry
- Revenue concentration risks
- Cash conversion metrics
Practice Comparative Analysis
- Compare companies within the same sector
- Track revenue trends over 3-5 years
- Benchmark against industry leaders
- Identify revenue growth catalysts
Integrate with Complete Financial Analysis
- Never evaluate revenue in isolation
- Examine margins, cash flow, and returns
- Assess competitive positioning
- Consider macroeconomic factors
For Business Owners:
Implement Robust Tracking Systems
- Set up proper accounting software
- Track revenue by multiple dimensions
- Monitor key revenue metrics weekly/monthly
- Establish clear revenue recognition policies
Focus on Revenue Quality
- Build recurring revenue streams
- Diversify customer base
- Improve customer retention
- Increase customer lifetime value
Benchmark and Optimize
- Compare your metrics to industry standards
- Identify revenue growth opportunities
- Improve conversion rates and pricing
- Optimize sales and marketing efficiency
For Everyone:
Continue Learning
- Stay updated on accounting standards
- Understand industry-specific metrics
- Follow market and economic trends
- Read financial statements regularly
Ask Better Questions
- Where does this revenue come from?
- Is it sustainable and growing?
- What’s the quality of this revenue?
- How does it compare to competitors?
- What drives revenue changes?
Final Thoughts
Gross revenue is one of the most fundamental yet frequently misunderstood financial metrics. It’s the starting point for understanding business performance, but it’s never the complete story. By combining gross revenue analysis with profitability metrics, cash flow assessment, and qualitative business evaluation, you develop a comprehensive understanding that leads to better investment decisions and business strategies.
Whether you’re evaluating stocks, running a business, or simply trying to understand the financial news, the principles covered in this guide provide a solid foundation. Remember that financial analysis is both an art and a science—the numbers tell you what happened, but understanding why and what it means for the future requires judgment, experience, and continuous learning.
The businesses that consistently grow high-quality revenue while maintaining healthy margins and strong cash flow are the ones that create lasting value for shareholders and stakeholders. By focusing on these fundamentals, you position yourself to identify opportunities and avoid pitfalls in an ever-changing business landscape.
Keep learning, stay curious, and always look beyond the headline numbers to understand the complete financial picture.
FAQ
Gross revenue is the total amount of money a business earns from all sales before any deductions, expenses, or costs are subtracted. It represents the raw income generated from selling products or services, without accounting for returns, discounts, cost of goods sold, operating expenses, or taxes. Think of it as the “top line” on an income statement.
The basic formula is: Gross Revenue = Price per Unit × Number of Units Sold. For businesses with multiple products, you add up the revenue from each product line. For subscription businesses, multiply the number of subscribers by the subscription price and billing period. For service businesses, multiply billable hours by the hourly rate.
Gross revenue is total sales before any deductions, while net revenue is what remains after subtracting sales returns, discounts, and allowances. For example, if a company has $1 million in gross revenue but $100,000 in returns and $50,000 in discounts, its net revenue would be $850,000. Net revenue is also called “net sales.”
No, gross revenue is not profit. Gross revenue only represents total sales, while profit (net income) is what remains after subtracting all costs and expenses from revenue. A company can have high gross revenue but still operate at a loss if its expenses exceed its income. Profit = Revenue – All Costs and Expenses.
A “good” growth rate varies significantly by industry and company stage. Early-stage tech companies might target 30-50%+ annual growth, while mature retail companies might see 3-10% as healthy. Generally, consistent growth above 15-20% annually is considered strong for most industries. However, sustainable growth with improving profitability is more important than pure revenue growth.
Investors use gross revenue to assess market demand, business scale, competitive position, and growth trajectory. It helps them understand how much a company is selling and whether demand for its products or services is increasing. Combined with profitability metrics, gross revenue helps investors evaluate a company’s overall health and future potential.
Yes, absolutely. Many companies generate significant revenue but fail due to unsustainable business models, excessive expenses, poor cash flow management, or an inability to achieve profitability. Revenue without profit is not sustainable long-term. This is why investors examine both revenue and profitability metrics when evaluating companies.
Most businesses track gross revenue monthly, with detailed analysis quarterly and annually. However, the frequency depends on business type and size. E-commerce businesses might track it daily or weekly, while B2B companies with longer sales cycles might focus on quarterly trends. Regular tracking helps identify patterns, seasonal trends, and growth opportunities.
Disclaimer
This article is for educational purposes only and does not constitute financial, investment, tax, or legal advice. The information provided is based on general principles and publicly available data as of 2025. Financial metrics, industry benchmarks, and examples are illustrative and may not reflect current market conditions or specific company circumstances.
Before making any investment decisions, please:
- Conduct your own thorough research
- Consult with qualified financial advisors
- Review official company filings and financial statements
- Consider your personal financial situation, risk tolerance, and investment objectives
Past performance does not guarantee future results. All investments carry risk, including the potential loss of principal. The author and publisher are not responsible for any financial decisions made based on information in this article.
References to specific companies, stocks, or securities are for illustrative purposes only and do not constitute recommendations to buy or sell. Always verify information from authoritative sources, including the SEC, company investor relations, and certified financial professionals.
About The Author
Max Fonji brings over a decade of experience in financial analysis, investment strategy, and personal finance education. As the founder of TheRichGuyMath.com, Max is dedicated to making complex financial concepts accessible to everyone, from beginners taking their first steps in investing to experienced investors refining their strategies.
With a background in financial modeling and equity research, Max has helped thousands of readers understand the fundamentals of investing, from analyzing financial statements to building diversified portfolios. His clear, data-backed approach demystifies topics like gross revenue, valuation metrics, and market dynamics.
Connect with Max:
- Website: TheRichGuyMath.com
- More investing guides: Blog
Your go-to source for clear, data-backed investing education.