Ever wonder how investors know whether a company is crushing it or quietly bleeding cash? The secret lies in three powerful documents that tell the complete financial story of any business, and once you learn to read them, you’ll never look at companies (or your own finances) the same way again.
Financial statements are formal records that show the financial activities and position of a business, organization, or individual. In simple terms, financial statements are the report cards of the business world, revealing everything from how much money a company makes to how much debt it carries. For beginner investors, understanding these documents is the difference between making informed decisions and gambling with your hard-earned money.
Whether you’re evaluating stock market investments, analyzing high dividend stocks, or simply trying to understand how businesses operate, mastering financial statements is your gateway to financial literacy and smarter investing decisions.
TL;DR
Quick Facts About Financial Statements:
- Financial statements consist of three core documents: the income statement (shows profitability), the balance sheet (shows financial position), and the cash flow statement (shows money movement)
- These statements work together to provide a complete picture of a company’s financial health—no single statement tells the whole story
- The income statement reveals whether a company is profitable, the balance sheet shows what it owns versus owes, and the cash flow statement proves whether it’s generating actual cash
- Public companies must release audited financial statements quarterly and annually, making them freely available to investors through SEC filings
- Learning to read financial statements empowers you to make data-driven investment decisions rather than relying on tips, hype, or emotions
What Are Financial Statements?
Financial statements are standardized documents that communicate the financial performance, position, and cash flows of a business over a specific period. Think of them as the financial DNA of a company; they contain all the critical information you need to evaluate whether a business is healthy, growing, struggling, or headed for trouble.
The Three Core Financial Statements
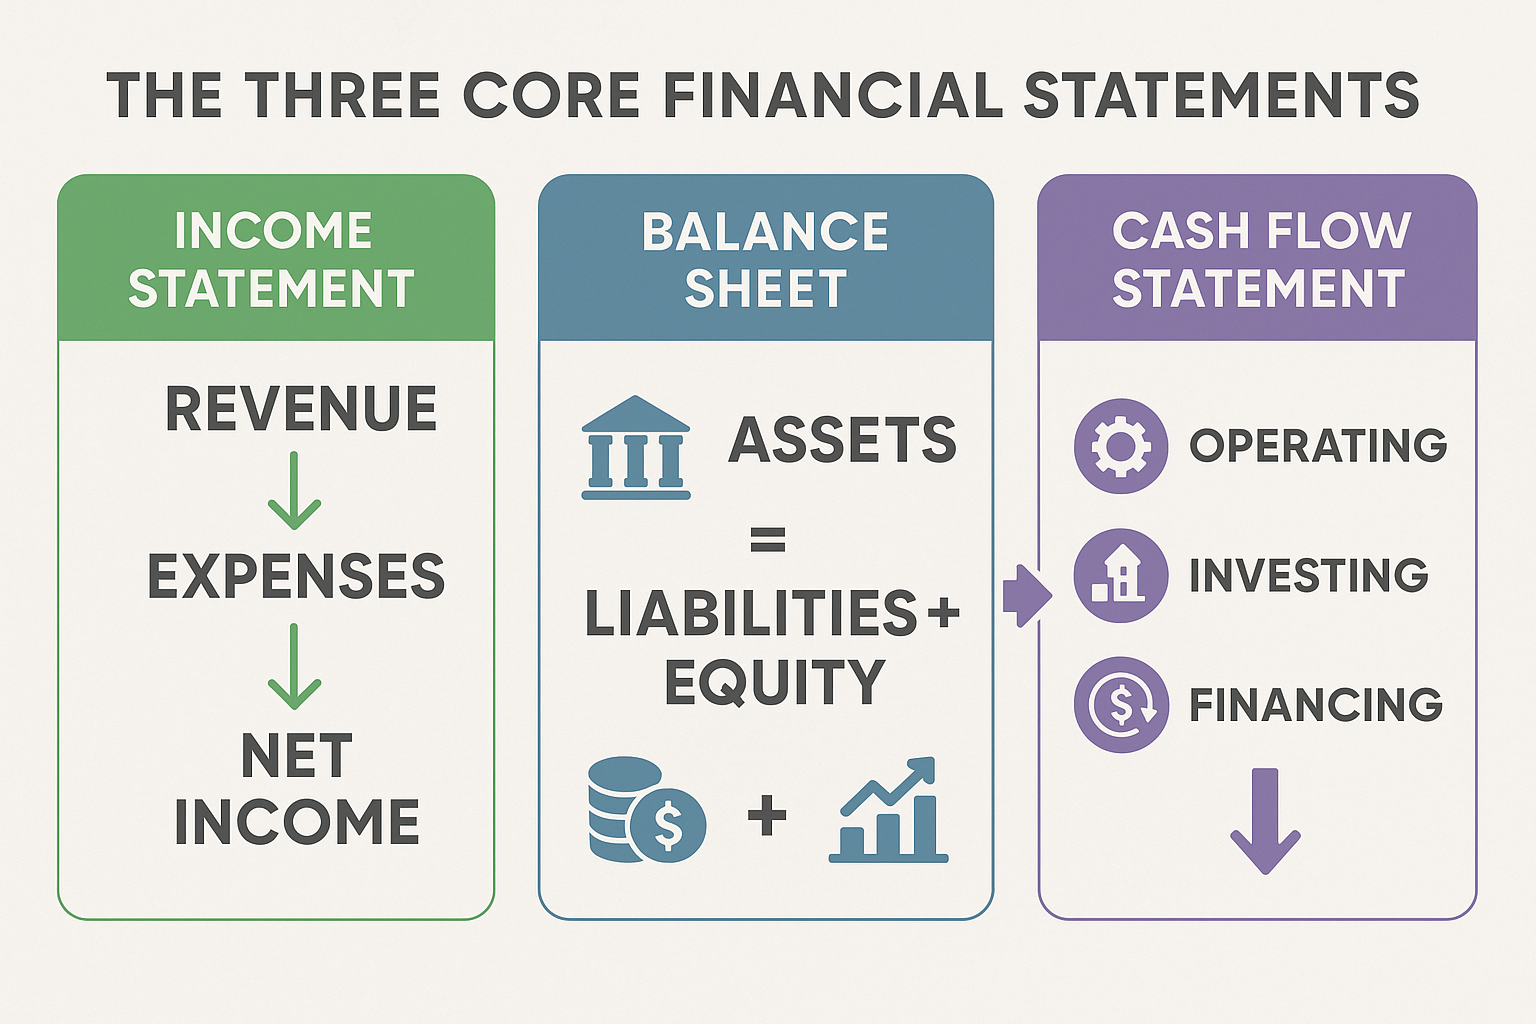
Every complete set of financial statements includes three primary documents:
- Income Statement (also called Profit & Loss Statement or P&L)
- Balance Sheet (also called Statement of Financial Position)
- Cash Flow Statement (also called Statement of Cash Flows)
These three statements are interconnected and complement each other. The income statement shows profitability, the balance sheet shows financial position at a point in time, and the cash flow statement reconciles the two by tracking actual money movement.
Who Uses Financial Statements?
Financial statements serve multiple audiences:
- Investors use them to decide whether to buy, hold, or sell stocks
- Creditors and lenders evaluate creditworthiness before extending loans
- Management uses them to make strategic business decisions
- Regulators ensure compliance with financial reporting standards
- Analysts forecast future performance and provide recommendations
- Employees assess company stability before accepting job offers
Understanding these documents gives you the same analytical power that professional investors use when evaluating opportunities in the stock market.
The Income Statement: Measuring Profitability
The income statement shows a company’s revenues, expenses, and profits over a specific period (usually a quarter or year). It answers the fundamental question: “Is this company making money?”
Key Components of the Income Statement
| Component | What It Means | Why It Matters |
|---|---|---|
| Revenue (Sales) | Total money earned from selling products/services | Shows business growth and market demand |
| Cost of Goods Sold (COGS) | Direct costs to produce products/services | Reveals operational efficiency |
| Gross Profit | Revenue minus COGS | Indicates pricing power and production efficiency |
| Operating Expenses | Costs to run the business (salaries, rent, marketing) | Shows how well management controls costs |
| Operating Income | Gross profit minus operating expenses | Measures profit from core business operations |
| Net Income | Bottom line profit after all expenses and taxes | The ultimate measure of profitability |
The Income Statement Formula
The basic structure follows this logic:
Revenue – Expenses = Net Income
More specifically:
Revenue
- Cost of Goods Sold
= Gross Profit
- Operating Expenses
= Operating Income
- Interest & Taxes
= Net Income
Real-World Example: Reading an Income Statement
Let’s examine a simplified income statement for a fictional company, TechGrowth Inc.:
TechGrowth Inc. Income Statement (Year Ended Dec 31, 2025)
- Revenue: $10,000,000
- Cost of Goods Sold: $4,000,000
- Gross Profit: $6,000,000 (60% gross margin)
- Operating Expenses: $3,500,000
- Operating Income: $2,500,000
- Interest Expense: $200,000
- Taxes: $460,000
- Net Income: $1,840,000
This tells us TechGrowth generated $10 million in sales, kept $6 million after production costs, and ultimately earned $1.84 million in profit—an 18.4% net profit margin, which is solid for most industries.
What to Look For in an Income Statement
Positive signs:
- Consistent revenue growth year-over-year
- Stable or improving profit margins
- Operating income growth outpacing revenue growth
- Controlled operating expenses
Warning signs:
- Declining revenues
- Shrinking profit margins
- Operating losses (negative operating income)
- Net income declining while revenue grows (profit squeeze)
The Balance Sheet: Snapshot of Financial Position
While the income statement shows performance over time, the balance sheet provides a snapshot of what a company owns and owes at a specific moment, like taking a financial photograph on December 31st.
The Fundamental Accounting Equation
The balance sheet is built on this ironclad formula:
Assets = Liabilities + Shareholders’ Equity
This equation must always balance (hence the name). Everything a company owns (assets) is financed either by borrowing (liabilities) or by owner investment and retained profits (equity).
Key Components of the Balance Sheet
Assets (What the company owns):
- Current Assets: Cash, accounts receivable, inventory (convertible to cash within one year)
- Non-Current Assets: Property, equipment, intellectual property, long-term investments
Liabilities (What the company owes):
- Current Liabilities: Accounts payable, short-term debt, accrued expenses (due within one year)
- Non-Current Liabilities: Long-term debt, pension obligations, deferred taxes
Shareholders’ Equity (Owners’ stake):
- Common stock
- Retained earnings (accumulated profits reinvested in the business)
- Additional paid-in capital
Real-World Example: Reading a Balance Sheet
TechGrowth Inc. Balance Sheet (As of Dec 31, 2025)
Assets:
- Cash: $2,000,000
- Accounts Receivable: $1,500,000
- Inventory: $800,000
- Total Current Assets: $4,300,000
- Property & Equipment: $3,200,000
- Total Assets: $7,500,000
Liabilities:
- Accounts Payable: $600,000
- Short-term Debt: $400,000
- Total Current Liabilities: $1,000,000
- Long-term Debt: $2,000,000
- Total Liabilities: $3,000,000
Shareholders’ Equity:
- Common Stock: $1,000,000
- Retained Earnings: $3,500,000
- Total Equity: $4,500,000
Check: $7,500,000 (Assets) = $3,000,000 (Liabilities) + $4,500,000 (Equity) ✓
This balance sheet tells us TechGrowth has $7.5 million in total assets, owes $3 million to creditors, and the owners’ stake is worth $4.5 million. The company has more equity than debt, generally a healthy sign.
Important Balance Sheet Ratios
Current Ratio = Current Assets ÷ Current Liabilities
- TechGrowth: $4,300,000 ÷ $1,000,000 = 4.3
- Measures the ability to pay short-term obligations
- Generally, 1.5 or higher is healthy
Debt-to-Equity Ratio = Total Liabilities ÷ Shareholders’ Equity
- TechGrowth: $3,000,000 ÷ $4,500,000 = 0.67
- Measures financial leverage
- Lower is generally safer; it varies by industry
What to Look For in a Balance Sheet
Positive signs:
- Strong cash position
- Current ratio above 1.5
- Low debt-to-equity ratio (below 1.0 for most industries)
- Growing shareholders’ equity over time
- More assets than liabilities
Warning signs:
- Declining cash reserves
- Current ratio below 1.0 (liquidity crisis)
- High debt levels relative to equity
- Negative shareholders’ equity (liabilities exceed assets)
- Rapidly growing accounts receivable (customers not paying)
The Cash Flow Statement: Following the Money
The cash flow statement tracks the actual movement of cash in and out of the business. This is critical because a company can show profits on the income statement while running out of cash, and cash, not accounting profits, pays the bills.
“Profits are an opinion, but cash is a fact.” — Anonymous
The Three Sections of Cash Flow
The cash flow statement divides money movement into three categories:
- Operating Activities: Cash from core business operations
- Investing Activities: Cash spent on or received from investments (equipment, acquisitions)
- Financing Activities: Cash from or paid to investors and creditors (loans, dividends, stock buybacks)
Real-World Example: Reading a Cash Flow Statement
TechGrowth Inc. Cash Flow Statement (Year Ended Dec 31, 2025)
Operating Activities:
- Net Income: $1,840,000
- Depreciation: $320,000
- Changes in Working Capital: -$160,000
- Net Cash from Operations: $2,000,000
Investing Activities:
- Purchase of Equipment: -$800,000
- Net Cash from Investing: -$800,000
Financing Activities:
- Debt Repayment: -$300,000
- Dividends Paid: -$400,000
- Net Cash from Financing: -$700,000
Net Change in Cash: $500,000
- Beginning Cash: $1,500,000
- Ending Cash: $2,000,000 ✓
This statement reveals that TechGrowth generated $2 million in operating cash flow, invested $800,000 in equipment, and returned $700,000 to investors and creditors, resulting in a net cash increase of $500,000.
Why Operating Cash Flow Matters Most
Operating cash flow is the most important section because it shows whether the core business generates cash. A company can survive temporarily with negative investing or financing cash flows, but a negative operating cash flow is a red flag.
Free Cash Flow = Operating Cash Flow – Capital Expenditures
- TechGrowth: $2,000,000 – $800,000 = $1,200,000
- This is cash available for growth, dividends, or debt reduction
- Companies with strong free cash flow can fund dividend investing strategies
What to Look For in a Cash Flow Statement
Positive signs:
- Positive and growing operating cash flow
- Operating cash flow exceeds net income (high-quality earnings)
- Strong free cash flow generation
- Cash flow growth matching or exceeding revenue growth
Warning signs:
- Negative operating cash flow
- Net income is positive, but operating cash flow is negative (earnings quality issue)
- Consistently negative free cash flow
- Heavy reliance on financing activities to fund operations
How the Three Statements Connect
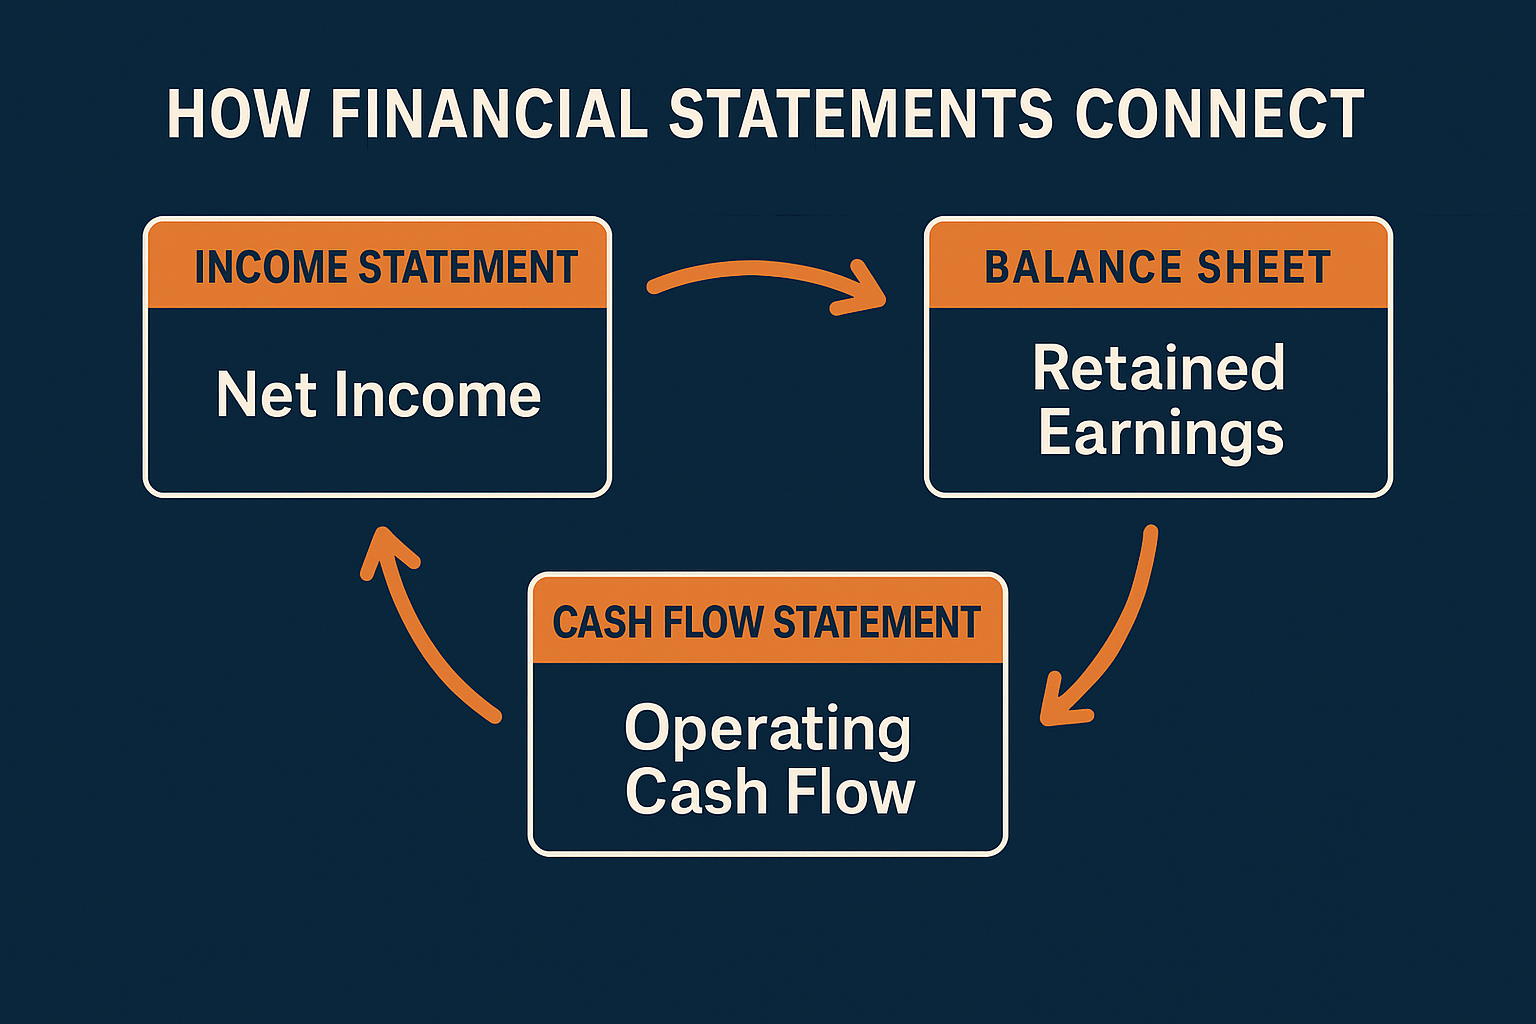
Understanding how financial statements interconnect gives you the complete picture:
- Net Income from the income statement flows into Retained Earnings on the balance sheet
- Net Income is the starting point for Operating Cash Flow on the cash flow statement
- Changes in Balance Sheet accounts (like inventory and accounts receivable) explain differences between net income and operating cash flow
- Ending Cash on the cash flow statement equals Cash on the balance sheet
This interconnection ensures consistency and helps detect errors or manipulation. When analyzing companies for smart investing decisions, always review all three statements together.
Common Financial Statement Ratios & Metrics
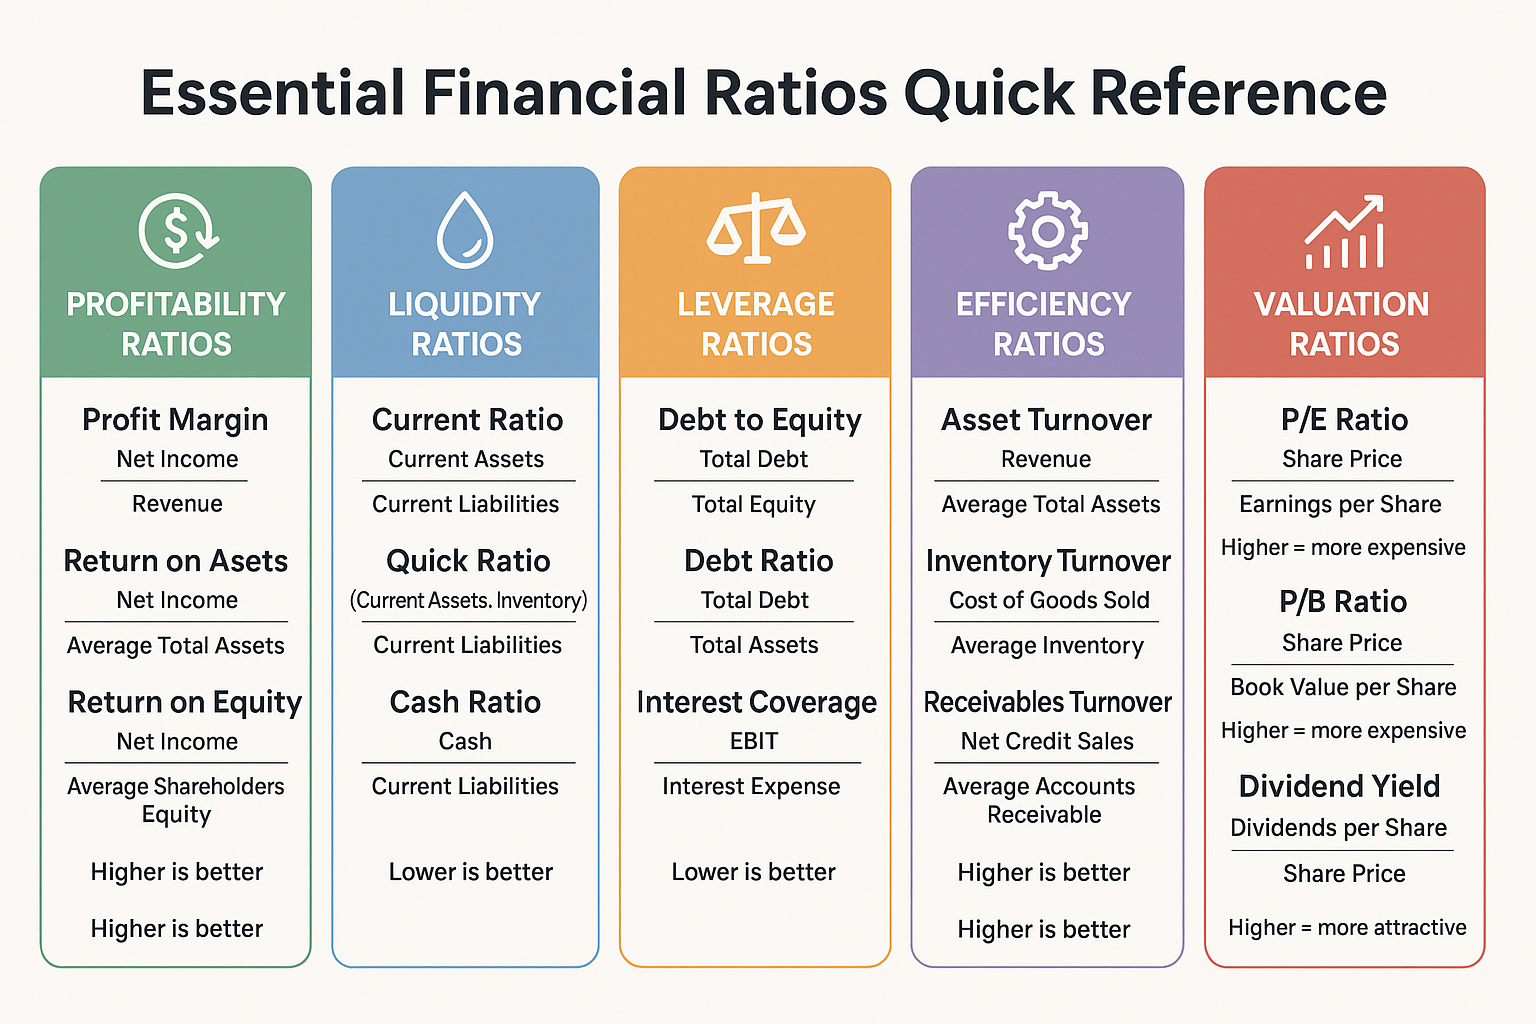
Investors use various ratios to quickly assess financial health and compare companies:
Profitability Ratios
Profitability ratios are financial metrics that measure a company’s ability to generate profit relative to its revenue, assets, or equity.
Gross Profit Margin = (Gross Profit ÷ Revenue) × 100
- Measures pricing power and production efficiency
- Higher is better; it varies widely by industry
Net Profit Margin = (Net Income ÷ Revenue) × 100
- Shows overall profitability after all expenses
- TechGrowth: ($1,840,000 ÷ $10,000,000) × 100 = 18.4%
Return on Equity (ROE) = (Net Income ÷ Shareholders’ Equity) × 100
- Measures how effectively the company uses shareholder money
- TechGrowth: ($1,840,000 ÷ $4,500,000) × 100 = 40.9% (excellent)
Liquidity Ratios
Current Ratio = Current Assets ÷ Current Liabilities
- Measures short-term financial health
- TechGrowth: 4.3 (very strong)
Quick Ratio = (Current Assets – Inventory) ÷ Current Liabilities
- More conservative than the current ratio
- TechGrowth: ($4,300,000 – $800,000) ÷ $1,000,000 = 3.5
Leverage Ratios
Debt-to-Equity Ratio = Total Liabilities ÷ Shareholders’ Equity
- Measures financial leverage and risk
- TechGrowth: 0.67 (moderate, healthy)
Interest Coverage Ratio = Operating Income ÷ Interest Expense
- Shows ability to pay interest obligations
- TechGrowth: $2,500,000 ÷ $200,000 = 12.5× (very safe)
Efficiency Ratios
Asset Turnover = Revenue ÷ Total Assets
- Measures how efficiently assets generate sales
- TechGrowth: $10,000,000 ÷ $7,500,000 = 1.33
Inventory Turnover = Cost of Goods Sold ÷ Average Inventory
- Shows how quickly inventory sells
- Higher is generally better (less capital tied up)
How to Interpret Financial Statements for Investing Decisions
When evaluating investment companies, follow this systematic approach:
Step 1: Assess the Trend
Don’t just look at one year, analyze at least 3-5 years of financial statements to identify trends:
- Is revenue growing consistently?
- Are profit margins improving or declining?
- Is debt increasing or decreasing?
- Is cash flow strengthening or weakening?
Step 2: Compare to Competitors
Context matters. A 10% net profit margin might be excellent in retail but poor in software. Compare the company’s metrics to:
- Direct competitors
- Industry averages
- Historical performance
Step 3: Look for Red Flags
Warning signs that should trigger deeper investigation:
- Revenue growth without corresponding cash flow growth
- Rapidly increasing accounts receivable (customers not paying)
- Declining gross margins (losing pricing power)
- Increasing debt levels
- Negative or declining operating cash flow
- Frequent accounting restatements
- Significant differences between GAAP and non-GAAP earnings
Step 4: Evaluate Quality of Earnings
High-quality earnings are sustainable and backed by cash. Low-quality earnings rely on accounting tricks or one-time events.
High-quality earnings indicators:
- Operating cash flow > Net income
- Consistent revenue and profit growth
- Conservative accounting policies
- Minimal reliance on non-recurring items
Step 5: Consider the Business Model
Financial statements make more sense when you understand the business:
- Capital-intensive businesses (manufacturing) need strong balance sheets
- Subscription businesses should show recurring revenue growth
- Retailers need efficient inventory management
- Tech companies often prioritize growth over current profitability
Understanding why the stock market goes up helps contextualize how financial performance drives stock prices over time.
Common Mistakes When Reading Financial Statements
Even experienced investors make these errors:
Mistake #1: Focusing Only on the Income Statement
The problem: Profitability doesn’t guarantee cash generation or financial stability.
The solution: Always review all three statements together. A profitable company can still fail if it runs out of cash or carries too much debt.
Mistake #2: Ignoring Footnotes
The problem: The most important information often hides in the footnotes and “Management Discussion & Analysis” sections.
The solution: Read the footnotes, especially regarding accounting policies, pending litigation, and significant events.
Mistake #3: Not Adjusting for One-Time Items
The problem: Non-recurring gains or losses distort the true operational performance.
The solution: Identify and adjust for one-time items like asset sales, restructuring charges, or legal settlements to see the underlying business performance.
Mistake #4: Comparing Apples to Oranges
The problem: Different industries have different financial characteristics.
The solution: Compare companies within the same industry and understand industry-specific metrics.
Mistake #5: Believing Everything You Read
The problem: Financial statements can be manipulated within legal bounds, and sometimes beyond.
The solution: Look for consistency across statements, verify with third-party sources, and watch for aggressive accounting policies.
Many investors lose money in the stock market because they don’t properly analyze financial statements before investing.
Where to Find Financial Statements
For Public Companies (U.S.)
SEC EDGAR Database (SEC EDGAR)
- Official source for all public company filings
- Search by company name or ticker symbol
- Key documents:
- 10-K: Annual report (comprehensive)
- 10-Q: Quarterly report
- 8-K: Current events report
Company Investor Relations Pages
- Usually under the “Investors” or “IR” section of company websites
- Often more user-friendly than SEC filings
- May include presentations and supplementary materials
Financial Data Platforms
- Yahoo Finance
- Google Finance
- Morningstar (https://www.morningstar.com)
- Bloomberg
- FactSet
For Private Companies
Private companies aren’t required to disclose financial statements publicly, but you might access them through:
- Direct request (if you’re an investor or potential investor)
- Credit agencies (if you have a business relationship)
- Industry databases (limited information)
Advanced Concepts: Beyond the Basics
Non-GAAP Earnings
Companies often report “adjusted” or “non-GAAP” earnings alongside official GAAP (Generally Accepted Accounting Principles) numbers. These adjustments remove items that management considers non-recurring or non-operational.
Be cautious: While non-GAAP metrics can provide insight, some companies abuse them to make performance look better than it is. Always compare GAAP to non-GAAP and understand what’s being adjusted.
Accounting Methods Impact
Different accounting choices affect financial statements:
Revenue Recognition: When should revenue be recorded?
- At the time of sale?
- When cash is received?
- Over the contract period?
Inventory Valuation: FIFO vs LIFO affects the cost of goods sold and inventory values
Depreciation Methods: Straight-line vs. accelerated impacts expenses and asset values
Segment Reporting
Large companies operate multiple business segments. Segment reporting breaks down revenue, profit, and assets by division, geography, or product line, providing deeper insight than consolidated statements alone.
Cash vs Accrual Accounting
Most financial statements use accrual accounting, which records revenues when earned and expenses when incurred (not when cash changes hands). This creates timing differences between reported profits and actual cash flow, which is why the cash flow statement is essential.
Practical Exercise: Analyzing a Real Company
Let’s apply what you’ve learned. Here’s how to analyze a company’s financial statements:
Step-by-step process:
- Download the latest 10-K from SEC.gov
- Read the business description (Item 1) to understand what the company does
- Review Management’s Discussion (Item 7) for management’s perspective
- Examine the three financial statements:
- Income Statement: Is the company profitable? Are margins improving?
- Balance Sheet: Is the financial position strong? How much debt?
- Cash Flow Statement: Is the company generating cash from operations?
- Calculate key ratios (profitability, liquidity, leverage)
- Compare to previous years (look for trends)
- Compare to competitors (industry context)
- Read the footnotes (look for risks and accounting policies)
- Form a conclusion: Is this a company worth investing in?
This systematic approach helps you make informed decisions rather than following emotional market cycles that lead to poor investment outcomes.
Financial Statements for Personal Finance
The principles of financial statements apply to personal finance, too. You can create your own:
Personal Income Statement (Monthly/Annual)
Income:
- Salary
- Investment income
- Side business revenue
- Other income
Expenses:
- Housing
- Transportation
- Food
- Insurance
- Entertainment
- Debt payments
Net Income = Income – Expenses
Personal Balance Sheet
Assets:
- Cash and savings
- Investment accounts
- Retirement accounts
- Real estate
- Personal property
Liabilities:
- Mortgage
- Student loans
- Credit card debt
- Auto loans
Net Worth = Assets – Liabilities
Personal Cash Flow Statement
Track where your money actually goes each month:
- Cash from work (operating activities)
- Cash from investments (investing activities)
- Cash from loans or debt payments (financing activities)
Creating personal financial statements helps you manage money like a business and build wealth systematically. This foundation supports strategies for creating passive income and achieving financial independence.
Tools and Resources for Learning More

Educational Resources
SEC’s Guide to Financial Statements
- Free, authoritative resource from the regulator
- https://www.sec.gov/investor
Investopedia Financial Statements Section
- Comprehensive definitions and examples
- https://www.investopedia.com
CFA Institute Resources
- Professional-level financial analysis education
- https://www.cfainstitute.org
Analysis Tools
Financial Modeling Software:
- Microsoft Excel (most versatile)
- Google Sheets (free, collaborative)
- Specialized platforms (Bloomberg, FactSet)
Stock Screeners:
- Finviz
- Yahoo Finance Screener
- Morningstar Stock Screener
Ratio Calculators:
- Various online calculators automate ratio calculations
- Most financial websites provide pre-calculated ratios
Practice Platforms
Paper Trading Accounts:
- Practice analyzing and investing without real money
- TD Ameritrade’s thinkorswim
- Interactive Brokers Paper Trading
Conclusion: Your Next Steps to Financial Statement Mastery
Understanding financial statements transforms you from a passive investor into an informed analyst capable of making data-driven decisions. The income statement, balance sheet, and cash flow statement work together to reveal the complete financial story of any business—showing profitability, financial position, and cash generation.
Here’s your action plan to master financial statement analysis:
- Start practicing today: Download a 10-K from a company you’re interested in and work through the three financial statements using the framework in this guide
- Create comparison spreadsheets: Track 3-5 companies in the same industry over 3-5 years to see how financial metrics evolve and compare
- Calculate key ratios: Practice computing profitability, liquidity, and leverage ratios until it becomes second nature
- Read the footnotes: Force yourself to read the “boring” parts of financial statements, where critical information hides
- Apply to personal finance: Create your own personal income statement, balance sheet, and cash flow statement to manage your finances like a business
- Stay consistent: Review financial statements of any company before investing, and make it a non-negotiable habit
- Keep learning: Financial statement analysis is a skill that deepens with practice and experience
Remember, even professional investors started as beginners. The difference between those who build wealth through smart investing strategies and those who don’t often comes down to fundamental analysis skills.
Financial statements are your window into business reality. They cut through marketing hype, media narratives, and market emotions to show what’s actually happening with a company’s money. Master this skill, and you’ll have a competitive advantage that serves you for life, whether you’re evaluating stocks, running a business, or managing your personal finances.
The companies that consistently generate profits, maintain strong balance sheets, and produce positive cash flow are the ones that create long-term shareholder value. By learning to identify these companies through financial statement analysis, you position yourself to benefit from their success.
Start today. Pick one company. Download its 10-K. And begin your journey toward financial statement literacy. Your future self and your investment portfolio will thank you.
FAQ
No single statement is most important—you need all three for a complete picture. The income statement shows profitability, the balance sheet shows financial position, and the cash flow statement shows actual money movement. However, if forced to choose, many investors prioritize the cash flow statement because “cash is king”—a company can manipulate earnings but can’t fake cash.
Public companies in the U.S. must release financial statements quarterly (10-Q filings) and annually (10-K filings). The 10-K provides the most comprehensive information, including audited financial statements. Private companies have no public reporting requirements unless they have debt covenants or investor agreements requiring it.
GAAP (Generally Accepted Accounting Principles) is the accounting standard used in the United States, while IFRS (International Financial Reporting Standards) is used in most other countries. The main differences involve revenue recognition, inventory valuation, and expense treatment. Understanding which standard a company uses matters when comparing international companies.
Yes, within limits. Companies have discretion in choosing accounting methods, timing of revenue recognition, depreciation methods, and other estimates. While outright fraud is illegal, “aggressive accounting” can make financial performance appear better than economic reality. This is why comparing GAAP to non-GAAP earnings, reading footnotes, and analyzing cash flow is critical.
It varies dramatically by industry. Software companies might have 20-40% net profit margins, while grocery stores operate on 1-3% margins. Instead of absolute benchmarks, compare a company’s margins to competitors and historical performance. Consistent or improving margins are generally positive signs regardless of the absolute percentage.
Evaluate debt levels using the debt-to-equity ratio and interest coverage ratio. Generally, a debt-to-equity ratio below 1.0 is conservative, but capital-intensive industries often operate with higher leverage. More importantly, check if operating income covers interest expenses by at least 3-5 times. Also consider debt maturity, when do loans come due, and can the company refinance or repay them?
Revenue (or sales) is the total money a company receives from selling products or services before any expenses. Profit is what remains after subtracting all expenses from revenue. A company can have high revenue but low or negative profit if expenses are too high. Revenue shows business size; profit shows business success.
References & Further Reading
- U.S. Securities and Exchange Commission (SEC): Official source for public company filings and investor education
- Financial Accounting Standards Board (FASB): Sets GAAP standards for financial reporting
- Investopedia: Comprehensive financial education resource
- Morningstar: Independent investment research and data
- CFA Institute: Professional standards for investment analysis
Disclaimer
This article is for educational purposes only and does not constitute financial advice, investment advice, trading advice, or any other sort of advice. The content is provided for informational purposes to help readers understand financial statements and should not be relied upon as a basis for investment decisions. You should do your own research and consult with qualified financial advisors before making any investment decisions. Past performance does not guarantee future results. All investments carry risk, including the potential loss of principal.
About the Author
Written by Max Fonji — With over a decade of experience in financial analysis and investment education, Max is your go-to source for clear, data-backed investing education. Through TheRichGuyMath.com, Max breaks down complex financial concepts into actionable insights that empower everyday investors to make smarter money decisions. When not analyzing financial statements, Max is passionate about teaching the next generation how to build wealth from an early age.
📊 Financial Statement Calculator
Calculate key financial metrics and ratios instantly
💡 How to use: Enter your company’s financial data to see key profitability metrics. Higher margins generally indicate better profitability and pricing power.
💡 How to use: Enter balance sheet data to calculate key liquidity and leverage ratios. Current ratio above 1.5 and debt-to-equity below 1.0 are generally healthy.
Net Profit Margin
Return on Assets (ROA)
Return on Equity (ROE)
Asset Turnover
Interest Coverage
💡 How to use: Calculate key profitability and efficiency ratios. Higher ROE (>15%), strong interest coverage (>5x), and positive profit margins indicate financial health.
Meta Description (157 characters):
Master financial statements with our beginner’s guide. Learn to read income statements, balance sheets, and cash flow statements to make smarter investments.
