When a company takes on debt, it makes a promise: pay interest on time, every time. But what happens when earnings fall and those interest payments become a burden? This is where the Interest Coverage Ratio becomes one of the most revealing metrics in financial analysis.
The Interest Coverage Ratio measures a company’s ability to meet its debt obligations using its operating earnings. For investors seeking to understand financial health and risk management, this single metric reveals whether a business generates enough profit to comfortably service its debt, or whether it’s headed toward financial distress.
Understanding the math behind this ratio transforms how investors evaluate companies, bonds, and overall investment risk. This guide breaks down the Interest Coverage Ratio with precision, showing exactly how to calculate it, interpret the results, and use it to make data-driven investment decisions in 2025.
Key Takeaways
- The Interest Coverage Ratio measures how many times a company can pay its interest expenses from operating earnings, calculated as EBIT ÷ Interest Expense
- A ratio above 2.5 generally indicates healthy debt management, while ratios below 1.5 signal potential financial distress and increased bankruptcy risk
- Investors use this metric to assess credit risk, compare companies within industries, and identify warning signs before financial trouble becomes visible in stock prices
- The ratio must be analyzed alongside industry benchmarks and historical trends because acceptable coverage varies significantly across sectors
- Combining the Interest Coverage Ratio analysis with other metrics like the debt-to-equity ratio and EBITDA provides a comprehensive financial health assessment
What Is the Interest Coverage Ratio?
The Interest Coverage Ratio is a financial metric that measures a company’s ability to pay interest on its outstanding debt. In plain English, it answers this question: How many times over can a company cover its interest payments with its current earnings?
This ratio belongs to the family of solvency ratios, metrics that evaluate a company’s long-term financial stability and ability to meet ongoing obligations. Unlike liquidity ratios that focus on short-term cash positions, the Interest Coverage Ratio examines the fundamental relationship between operating profitability and debt service requirements.
Why This Ratio Matters
Companies use debt strategically to fund growth, acquisitions, and operations. Debt itself isn’t inherently bad; it’s a tool for capital allocation that can amplify returns when used wisely. However, debt comes with mandatory interest payments regardless of business performance.
The Interest Coverage Ratio reveals the margin of safety between a company’s earnings and its debt obligations. A high ratio indicates comfortable coverage with room for earnings fluctuations. A low ratio signals vulnerability; if earnings decline even slightly, the company may struggle to meet interest payments, potentially leading to default, bankruptcy, or forced asset sales.
For investors, this metric serves as an early warning system. Credit rating agencies use it extensively when assigning bond ratings. Lenders examine it before extending credit. Equity investors analyze it to assess financial risk before committing capital.
The Components Behind the Calculation
The Interest Coverage Ratio uses two key components from a company’s financial statements:
Earnings Before Interest and Taxes (EBIT): This represents operating profit, the earnings generated from core business operations before accounting for interest expenses and tax obligations. EBIT shows the company’s fundamental earning power from its business activities. You’ll find this on the income statement, sometimes labeled as “Operating Income.”
Interest Expense: This is the total cost of servicing all debt obligations during a specific period. It includes interest on bonds, bank loans, credit facilities, and other borrowed capital. Interest expense appears as a line item on the income statement, typically between operating income and pre-tax income.
The relationship between these two numbers tells a powerful story about financial health and risk exposure.
The Interest Coverage Ratio Formula and Calculation
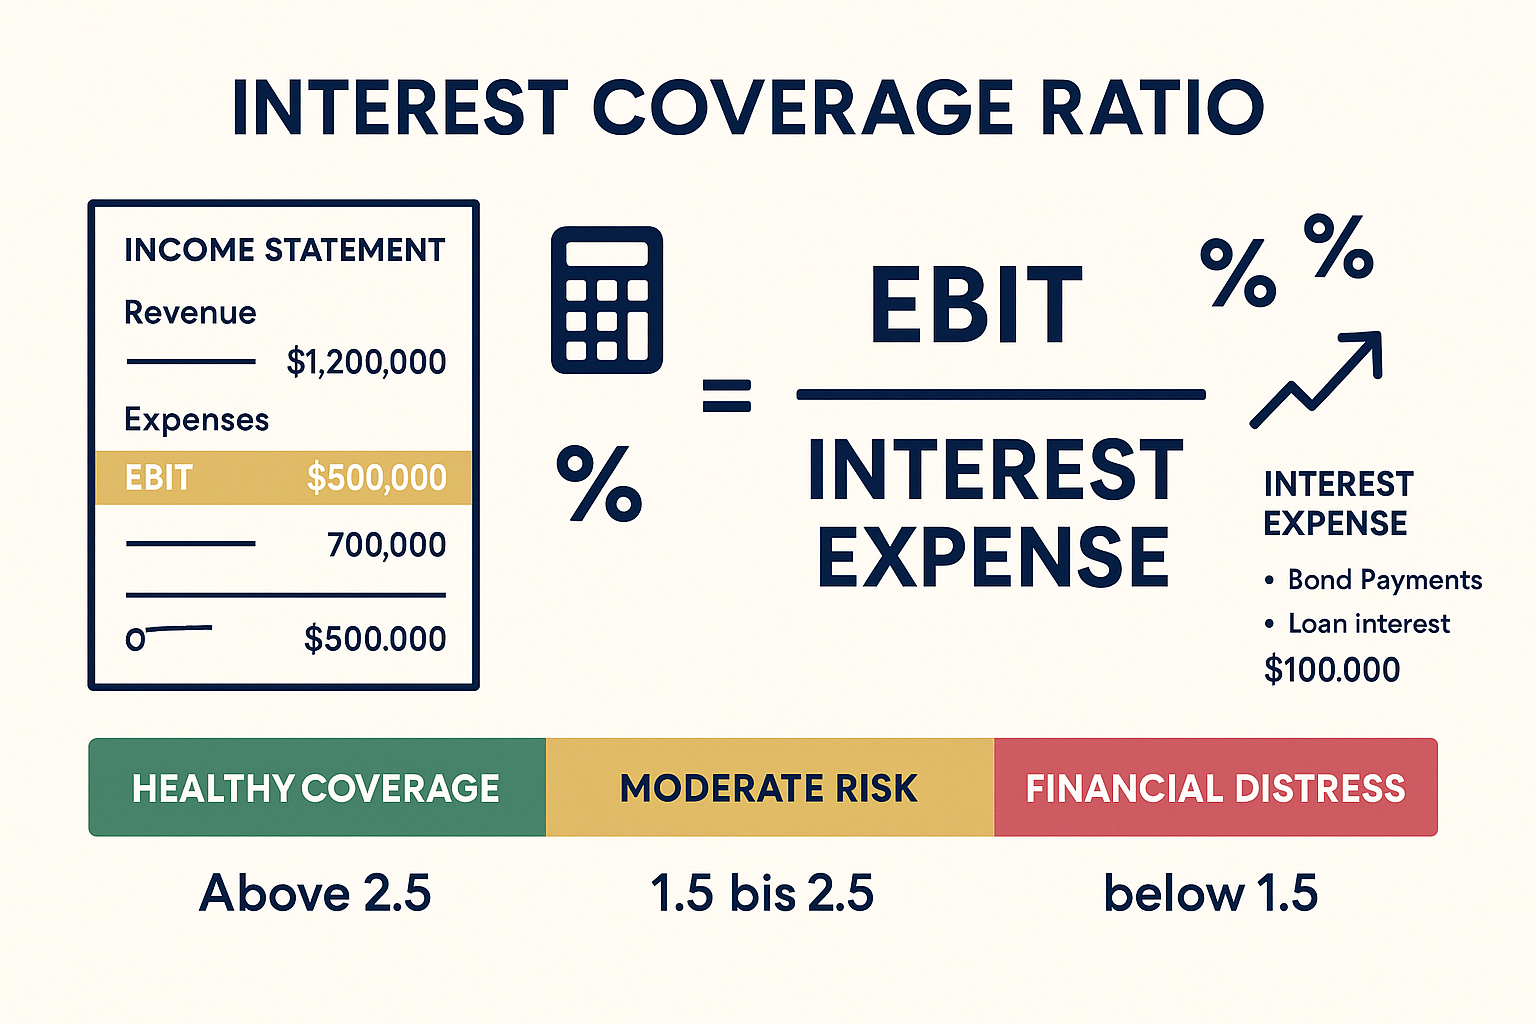
The Interest Coverage Ratio formula is elegantly simple, yet the insights it provides are profound. Here’s the mathematical expression:
Interest Coverage Ratio = EBIT ÷ Interest Expense
Or expressed more formally:
Interest Coverage Ratio = Earnings Before Interest and Taxes ÷ Total Interest Expense
Interest Coverage Ratio Calculation Step-by-Step Process
Let’s walk through a practical example using real numbers to demonstrate exactly how this calculation works.
Example Company Financial Data:
- Revenue: $10,000,000
- Cost of Goods Sold: $6,000,000
- Operating Expenses: $2,500,000
- Interest Expense: $400,000
- Tax Expense: $330,000
Step 1: Calculate EBIT (Operating Income)
- EBIT = Revenue – Cost of Goods Sold – Operating Expenses
- EBIT = $10,000,000 – $6,000,000 – $2,500,000
- EBIT = $1,500,000
Step 2: Identify Interest Expense
- Interest Expense = $400,000 (taken directly from the income statement)
Step 3: Apply the Formula
- Interest Coverage Ratio = $1,500,000 ÷ $400,000
- Interest Coverage Ratio = 3.75
Interpretation: This company can cover its interest payments 3.75 times with its operating earnings. For every dollar of interest owed, the company generates $3.75 in operating profit. This indicates reasonably healthy debt management with a comfortable margin of safety.
Alternative Calculation Methods
While EBIT is the standard numerator, some analysts use variations depending on the analysis context:
EBITDA-Based Calculation:
Some prefer using EBITDA (Earnings Before Interest, Taxes, Depreciation, and Amortization) instead of EBIT. This approach adds back non-cash expenses, providing a view of cash-generating ability.
Interest Coverage Ratio (EBITDA) = EBITDA ÷ Interest Expense
This variation typically produces higher ratios because EBITDA is larger than EBIT. It’s particularly useful for capital-intensive industries with significant depreciation expenses.
Cash Flow-Based Calculation:
The most conservative approach uses operating cash flow:
Interest Coverage Ratio (Cash) = Operating Cash Flow ÷ Interest Expense
This method focuses on actual cash generation rather than accounting earnings, providing the most realistic view of payment capability. However, it can fluctuate significantly due to working capital changes.
Finding the Numbers in Financial Statements
Locating the required data is straightforward when you know where to look:
On the Income Statement:
- Find “Operating Income” or “EBIT” (usually appears after operating expenses)
- Locate “Interest Expense” (appears below operating income, before taxes)
- If EBIT isn’t explicitly stated, calculate it: Revenue – COGS – Operating Expenses
On the Cash Flow Statement:
- Operating Cash Flow appears at the bottom of the “Cash Flow from Operating Activities” section
Most financial data providers (Yahoo Finance, Bloomberg, and company investor relations pages) display these figures clearly in their financial statement presentations. For publicly traded companies, you’ll find detailed breakdowns in 10-K annual reports and 10-Q quarterly reports filed with the SEC.
How to Interpret Interest Coverage Ratio Results
Numbers without context provide limited value. The true power of the Interest Coverage Ratio emerges when you understand what different values actually mean for a company’s financial health and investment risk profile.
General Interpretation Guidelines
Ratio Above 2.5: Healthy Coverage
A company with an Interest Coverage Ratio above 2.5 demonstrates a strong ability to service its debt. This indicates:
- Operating earnings comfortably exceed interest obligations
- Significant buffer against earnings volatility
- Lower bankruptcy risk
- Generally, investment-grade credit quality
- Management has flexibility for additional borrowing if needed
Ratio Between 1.5 and 2.5: Adequate but Monitored
This range represents acceptable but not exceptional coverage:
- The company can meet its obligations under normal conditions
- Limited margin for earnings deterioration
- Requires monitoring for trend changes
- May face challenges during economic downturns
- Additional debt would increase the risk significantly
Ratio Between 1.0 and 1.5: Warning Zone
Companies in this range face elevated risk:
- Minimal safety margin above break-even
- Vulnerable to minor earnings disruptions
- Difficulty obtaining additional financing
- Potential credit rating downgrades
- Increased scrutiny from lenders and investors
Ratio Below 1.0: Financial Distress
When a ratio falls below 1.0, the company cannot cover interest from operating earnings:
- Current earnings are insufficient to pay interest
- Must use cash reserves, sell assets, or refinance
- High probability of default without improvement
- Potential bankruptcy risk
- Equity investment carries substantial risk
Industry-Specific Benchmarks
Context matters enormously when interpreting these ratios. What’s healthy in one industry may signal distress in another.
Capital-Intensive Industries (Utilities, Telecommunications, Real Estate):
- Acceptable Range: 1.5 – 3.0
- These businesses carry naturally higher debt loads due to infrastructure requirements
- Stable, predictable cash flows support lower coverage ratios
- REITs often operate with ratios around 2.0-2.5 successfully
Technology and Software Companies:
- Expected Range: 5.0 – 15.0+
- Typically carry minimal debt relative to earnings
- High margins and asset-light models support strong coverage
- Low ratios in this sector signal unusual financial stress
Retail and Consumer Goods:
- Acceptable Range: 2.5 – 5.0
- Moderate debt levels for inventory and expansion
- Cyclical earnings require higher coverage buffers
- Seasonal businesses may show quarterly fluctuations
Manufacturing and Industrial:
- Expected Range: 3.0 – 6.0
- Equipment financing creates moderate debt loads
- Coverage needs to withstand economic cycles
- Lower ratios are acceptable during expansion phases
Trend Analysis: The Critical Context
A single ratio provides a snapshot. Trend analysis reveals the trajectory, and trajectory often matters more than current position.
Improving Trends (Rising Ratio):
- Growing earnings relative to debt costs
- Successful deleveraging or profit expansion
- Reduced financial risk over time
- Positive signal for credit quality and equity value
Declining Trends (Falling Ratio):
- Earnings pressure or increasing debt burden
- Potential early warning of financial deterioration
- Requires investigation into root causes
- May precede credit rating downgrades
Example Trend Analysis:
Consider a company with these ratios over five years:
- 2021: 4.2
- 2022: 3.8
- 2023: 3.1
- 2024: 2.4
- 2025: 1.8
Even though the 2025 ratio of 1.8 falls within the “acceptable” range, the consistent decline signals deteriorating financial health. This trend demands investigation: Are earnings falling? Is debt increasing? Why is coverage eroding?
Comparing this metric with other solvency indicators like the debt ratio and capitalization ratio provides a more complete financial health picture.
How Investors Use the Interest Coverage Ratio
Professional investors and analysts incorporate the Interest Coverage Ratio into their decision-making processes across multiple investment contexts. Understanding these practical applications transforms this metric from theoretical knowledge into actionable investment intelligence.
Credit Risk Assessment
Bond investors and credit analysts use the Interest Coverage Ratio as a primary tool for evaluating default risk. The logic is straightforward: companies that cannot cover interest payments face an elevated probability of default.
Bond Investment Decisions:
Before purchasing corporate bonds, investors examine the issuer’s Interest Coverage Ratio to assess the safety of their interest payments. A company with a ratio of 6.0 presents substantially lower risk than one with a ratio of 1.5, and bond prices reflect this risk differential.
Credit rating agencies (Moody’s, S&P, Fitch) incorporate Interest Coverage Ratios into their rating methodologies. General guidelines include:
- AAA/AA ratings: Typically require ratios above 8.0-12.0
- A/BBB ratings (Investment Grade): Usually show ratios of 3.0-8.0
- BB/B ratings (High Yield): Often display ratios of 1.5-3.0
- Below B (Distressed): Frequently have ratios under 1.5
These thresholds vary by industry, but the principle remains constant: higher coverage correlates with higher credit quality and lower yields.
Equity Investment Analysis
Stock investors use the Interest Coverage Ratio to evaluate financial stability and risk exposure, even though they don’t directly receive interest payments.
Why Equity Investors Care:
- Bankruptcy Risk: Companies that cannot service debt may face bankruptcy, wiping out equity value
- Financial Flexibility: Strong coverage indicates capacity for growth investments, dividends, and buybacks
- Earnings Quality: High interest burdens reduce earnings available to shareholders
- Valuation Impact: Financial distress compresses valuation multiples
When analyzing potential dividend stocks or dividend growth opportunities, the Interest Coverage Ratio helps assess whether dividend payments are sustainable. A company struggling to cover interest expenses will likely cut dividends before defaulting on debt obligations.
Comparative Analysis Across Companies
The Interest Coverage Ratio enables apples-to-apples comparison between companies in the same industry, revealing which businesses manage debt more effectively.
Example Comparative Analysis:
Consider three retail companies:
| Company | EBIT | Interest Expense | Coverage Ratio | Interpretation |
|---|---|---|---|---|
| Retailer A | $500M | $50M | 10.0 | Excellent coverage, minimal debt burden |
| Retailer B | $400M | $120M | 3.3 | Adequate coverage, moderate debt |
| Retailer C | $300M | $250M | 1.2 | Weak coverage, high financial risk |
This comparison immediately reveals that Retailer A operates with the strongest financial position, while Retailer C faces elevated risk. During an economic downturn, Retailer C would likely experience the most severe financial stress.
Integration with Broader Financial Analysis
Sophisticated investors never rely on a single metric. The Interest Coverage Ratio works most powerfully when combined with complementary financial measures:
Debt Structure Analysis:
- Combine with the debt-to-equity ratio to understand total leverage
- Examine alongside the equity ratio for capital structure insights
- Compare with industry peers to identify outliers
Profitability Assessment:
- Analyze with EBITDA margin to understand operating efficiency
- Review accounting profit versus economic profit for true value creation
- Consider profit trends and sustainability
Valuation Context:
- Strong coverage ratios may justify higher valuation multiples
- Weak coverage increases the required margin of safety
- Factor into expected return calculations
This comprehensive approach, examining multiple metrics in concert, provides the data-driven insights necessary for evidence-based investing decisions.
Warning Signs and Red Flags
Certain patterns in the Interest Coverage Ratio analysis should trigger additional scrutiny:
Rapid Deterioration: A ratio falling by 50% or more over two years signals serious problems
Below Industry Average: Companies with coverage significantly below sector peers face competitive disadvantages
Volatile Fluctuations: Wild swings in coverage indicate unstable earnings or debt management issues
Approaching 1.0: Any ratio trending toward 1.0 requires immediate investigation
Inconsistent with Cash Flow: If cash flow coverage differs dramatically from EBIT-based coverage, investigate accounting quality
These warning signs don’t automatically mean “sell,” but they demand deeper analysis before committing capital.
Limitations and Considerations
Like all financial metrics, the Interest Coverage Ratio has boundaries and blind spots. Understanding these limitations prevents misinterpretation and supports more nuanced analysis.
What the Ratio Doesn’t Capture
Principal Repayment Obligations:
The Interest Coverage Ratio focuses exclusively on interest expenses—it ignores principal repayment requirements. A company might comfortably cover interest while facing a massive debt maturity that requires refinancing or repayment from cash reserves.
Example: A company with $100M in bonds maturing next year might show a healthy Interest Coverage Ratio of 5.0, but if it lacks the cash to repay principal and cannot refinance, it still faces a crisis.
Timing and Liquidity Considerations:
The ratio uses annual or quarterly accounting figures, which don’t reflect cash timing. A company might generate sufficient annual earnings to cover interest but face cash shortfalls during specific months due to seasonal revenue patterns or working capital cycles.
Non-Cash Adjustments:
EBIT includes non-cash items and accounting estimates. Depreciation methods, inventory valuation, and revenue recognition policies can affect EBIT without changing actual cash-generating ability.
Industry-Specific Challenges
Cyclical Industries:
Companies in cyclical sectors (automotive, construction, commodities) show highly variable Interest Coverage Ratios across economic cycles. A ratio calculated during peak earnings may look healthy, while the same company struggles during downturns. Investors must analyze coverage through complete business cycles, not just current conditions.
Growth Companies:
High-growth businesses often intentionally carry higher debt loads to fund expansion. Their current Interest Coverage Ratios may appear weak, but improving earnings trajectories could strengthen coverage rapidly. Static ratio analysis misses this dynamic element.
Financial Services:
Banks and financial institutions use debt (deposits, borrowings) as their core business model. Traditional Interest Coverage Ratio analysis doesn’t apply meaningfully to these entities—alternative metrics like net interest margin and regulatory capital ratios matter more.
Accounting Variations
Different accounting standards and practices can affect comparability:
GAAP vs IFRS:
International Financial Reporting Standards (IFRS) and Generally Accepted Accounting Principles (GAAP) treat certain items differently, potentially affecting EBIT calculations. Cross-border comparisons require adjustments.
One-Time Items:
Companies sometimes report “adjusted EBIT” that excludes restructuring charges, asset impairments, or other non-recurring items. While these adjustments can provide clearer operational views, they also create opportunities for manipulation. Investors should examine both reported and adjusted figures.
Capitalized Interest:
Some companies capitalize interest costs into asset values rather than expensing them immediately. This accounting treatment can artificially inflate Interest Coverage Ratios by understating current interest expense.
Complementary Metrics to Consider
To address these limitations, combine the Interest Coverage Ratio analysis with additional metrics:
Debt Service Coverage Ratio (DSCR):
DSCR = (Net Operating Income) ÷ (Total Debt Service including principal and interest)
This metric captures both interest and principal obligations, providing a more complete view of debt service capability.
Cash Interest Coverage:
Cash Interest Coverage = (Operating Cash Flow + Interest Paid + Taxes Paid) ÷ Interest Paid
This calculation uses actual cash flows rather than accounting earnings, revealing true payment capacity.
Fixed Charge Coverage Ratio:
This expands beyond interest to include lease payments, preferred dividends, and other fixed obligations—particularly relevant for companies with significant operating leases.
Times Interest Earned (TIE):
TIE is simply another name for the Interest Coverage Ratio, sometimes calculated using slightly different numerators (Net Income + Interest + Taxes instead of EBIT).
Understanding these limitations and using complementary analysis tools transforms the Interest Coverage Ratio from a simple calculation into a component of sophisticated financial analysis.
📊 Interest Coverage Ratio Calculator
Calculate how many times a company can cover its interest payments
Real-World Examples and Case Studies
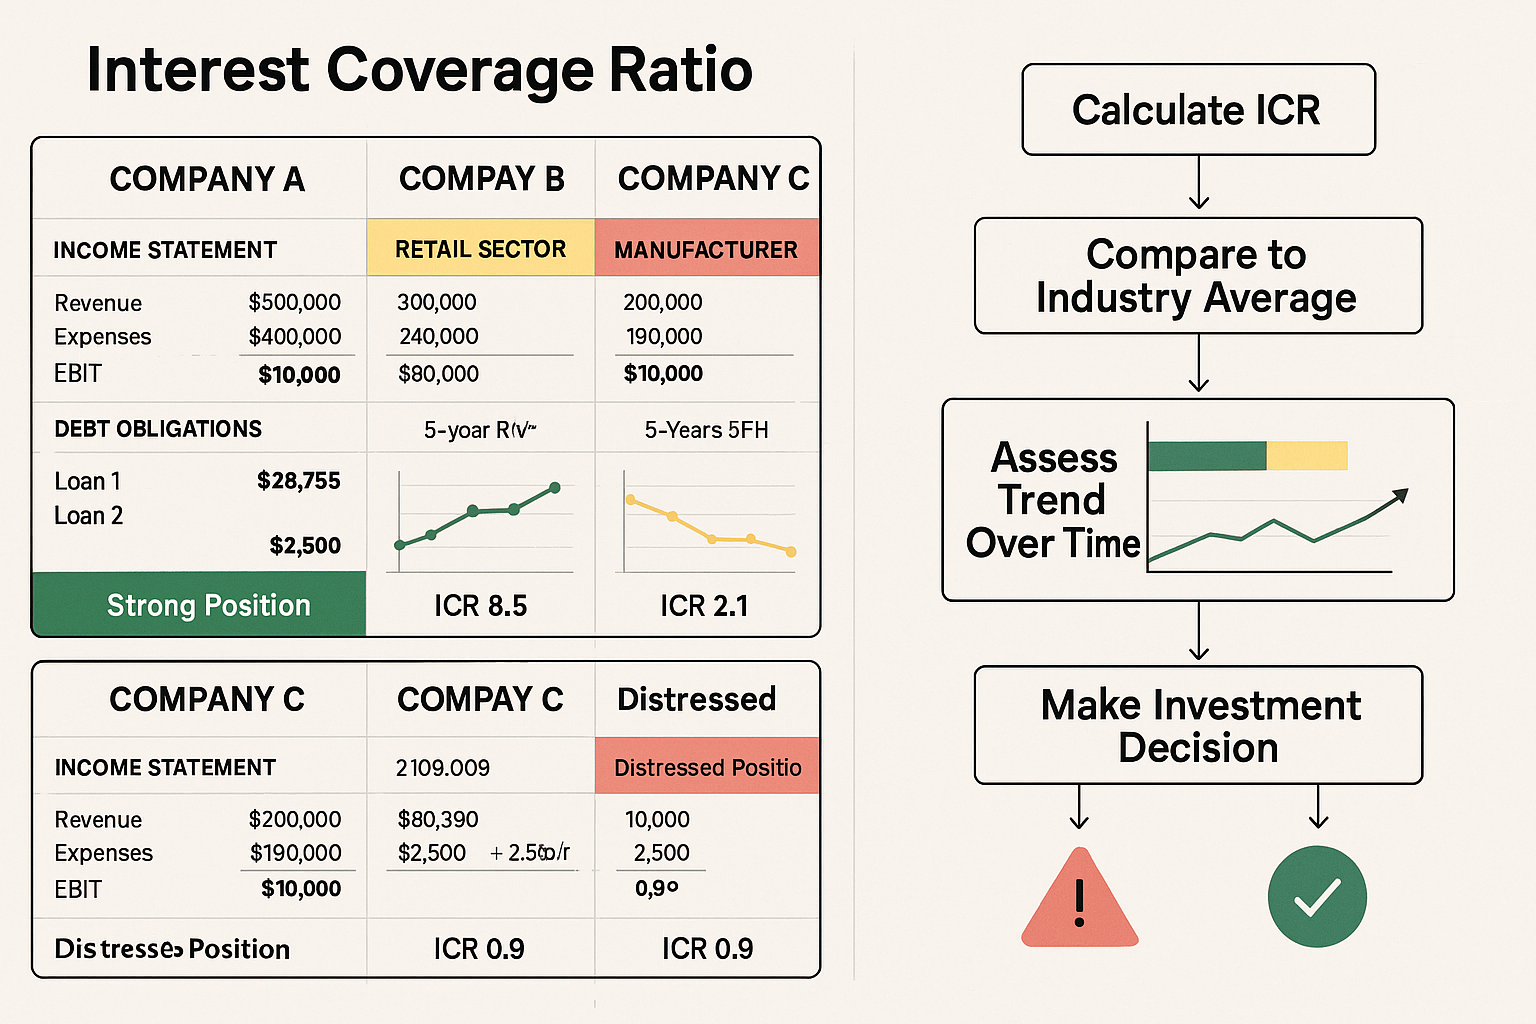
Theory becomes powerful when applied to actual business situations. Examining real-world examples demonstrates how the Interest Coverage Ratio reveals financial health differences across companies and industries.
Example 1: Technology Company with Strong Coverage
Tech Corp Financial Data (Annual):
- Revenue: $5,000,000,000
- Operating Expenses: $3,200,000,000
- EBIT: $1,800,000,000
- Interest Expense: $150,000,000
Calculation:
Interest Coverage Ratio = $1,800,000,000 ÷ $150,000,000 = 12.0x
Analysis:
This technology company demonstrates exceptional debt management. With the ability to cover interest payments 12 times over, the business operates with minimal financial risk from its debt obligations. This strong position provides several advantages:
- Management can pursue growth investments without financial constraint
- The company could raise additional debt if strategically beneficial
- Credit rating likely sits in the AA or A range
- Equity investors face minimal bankruptcy risk
- During economic downturns, earnings could fall 90% before interest coverage becomes problematic
This profile is typical of successful technology companies with high margins, asset-light business models, and conservative debt usage. Similar patterns appear in software, pharmaceutical, and other high-margin sectors.
Example 2: Retail Company with Moderate Coverage
Retail Chain Financial Data (Annual):
- Revenue: $2,000,000,000
- Operating Expenses: $1,750,000,000
- EBIT: $250,000,000
- Interest Expense: $85,000,000
Calculation:
Interest Coverage Ratio = $250,000,000 ÷ $85,000,000 = 2.94x
Analysis:
This retail business shows adequate but not exceptional coverage. The company can comfortably meet interest obligations under normal conditions, but faces several considerations:
- Limited margin for earnings deterioration
- Economic downturns could pressure coverage quickly
- Additional debt would increase the risk substantially
- Credit rating likely in the BBB range (investment grade)
- Management must monitor trends carefully
This scenario is common in retail, where moderate debt finances inventory and store expansion, but competitive pressures and economic sensitivity create earnings volatility. The company remains financially stable but requires ongoing monitoring.
Example 3: Manufacturing Company in Distress
Industrial Manufacturer Financial Data (Annual):
- Revenue: $800,000,000
- Operating Expenses: $780,000,000
- EBIT: $20,000,000
- Interest Expense: $45,000,000
Calculation:
Interest Coverage Ratio = $20,000,000 ÷ $45,000,000 = 0.44x
Analysis:
This manufacturer faces serious financial distress. Current operating earnings cannot cover interest expenses, creating several critical issues:
- The company must use cash reserves to pay interest
- Without improvement, bankruptcy risk is elevated
- Refinancing existing debt will be difficult and expensive
- Equity value is at substantial risk
- Credit rating likely CCC or below (deep junk territory)
- Asset sales or restructuring may be necessary
This situation demands immediate action: cost reduction, revenue growth, debt restructuring, or strategic alternatives. For investors, this profile signals high risk—both for bondholders facing potential default and equity holders facing dilution or wipeout.
Trend Analysis Example: Five-Year Coverage Evolution
Consider a telecommunications company's Interest Coverage Ratio over five years:
| Year | EBIT | Interest Expense | Coverage Ratio | Trend |
|---|---|---|---|---|
| 2021 | $450M | $75M | 6.0x | Baseline |
| 2022 | $480M | $85M | 5.6x | Slight decline |
| 2023 | $420M | $95M | 4.4x | Deteriorating |
| 2024 | $390M | $110M | 3.5x | Concerning |
| 2025 | $350M | $125M | 2.8x | Warning |
Trend Interpretation:
While the 2025 ratio of 2.8x still falls within the "acceptable" range, the consistent five-year decline reveals deteriorating financial health. Investigation reveals:
- EBIT is declining due to competitive pressure and market saturation
- Interest expense rising from new debt taken to fund network upgrades
- Coverage falling 53% over five years despite remaining above 2.0x
- Trajectory suggests continued deterioration without intervention
This trend analysis provides an early warning before the ratio reaches crisis levels. Investors who recognize this pattern can adjust positions before financial distress becomes severe—demonstrating the power of longitudinal analysis versus single-point-in-time metrics.
These real-world examples illustrate how the Interest Coverage Ratio translates abstract numbers into concrete financial health assessments, enabling data-driven investment decisions.
Conclusion
The Interest Coverage Ratio stands as one of the most revealing metrics in financial analysis, distilling complex financial statements into a single number that speaks volumes about debt management and financial stability. This ratio answers the fundamental question every investor must consider: Can this company reliably meet its debt obligations?
The math behind money reveals clear truths: Companies that generate earnings substantially exceeding interest expenses demonstrate financial strength and flexibility. Those struggling to cover interest face an elevated risk that often precedes more visible financial problems. By calculating and interpreting this metric, investors gain data-driven insights into credit quality, bankruptcy risk, and overall financial health.
Key principles to remember:
Calculate the ratio using EBIT ÷ Interest Expense for standard analysis
Interpret results within industry context—acceptable coverage varies significantly across sectors
Analyze trends over time rather than relying on single-point measurements
Combine with complementary metrics like debt-to-equity ratio and cash flow analysis for a comprehensive assessment
Recognize warning signs: ratios below 1.5, deteriorating trends, and significant divergence from industry peers
Actionable next steps for investors:
- Calculate Interest Coverage Ratios for current portfolio holdings using the most recent financial statements
- Compare your companies against industry benchmarks to identify outliers requiring deeper analysis
- Review five-year trends to understand whether financial health is improving or deteriorating
- Integrate this metric into your investment process alongside other fundamental analysis tools
- Monitor quarterly results for companies with borderline coverage ratios or concerning trends
The Interest Coverage Ratio exemplifies evidence-based investing—using quantitative analysis to make rational decisions rather than relying on speculation or emotion. When combined with comprehensive financial analysis, this single metric becomes a powerful tool for risk management and capital preservation.
Financial literacy grows through understanding the relationships between earnings, debt, and financial stability. The Interest Coverage Ratio illuminates these connections with mathematical precision, transforming abstract financial statements into concrete investment intelligence.
For investors committed to building wealth through data-driven insights and disciplined analysis, mastering this metric represents an essential step toward financial sophistication and investment success.
References
[1] CFA Institute. (2024). "Corporate Finance and Portfolio Management." CFA Program Curriculum.
[2] U.S. Securities and Exchange Commission. (2025). "Beginners' Guide to Financial Statements." SEC.gov.
[3] Moody's Investors Service. (2024). "Rating Methodology: Corporate Financial Ratios."
[4] Federal Reserve Bank of St. Louis. (2025). "Corporate Interest Coverage Ratios: Historical Analysis." FRED Economic Data.
[5] Standard & Poor's. (2024). "Corporate Ratings Criteria: Financial Ratio Benchmarks."
[6] Investopedia. (2025). "Interest Coverage Ratio: Definition and Calculation." Investopedia.com.
Frequently Asked Questions
What is a good Interest Coverage Ratio?
A good Interest Coverage Ratio typically exceeds 2.5, indicating the company can cover interest payments at least 2.5 times with operating earnings. Ratios above 5.0 demonstrate excellent financial health with substantial safety margin. However, “good” varies by industry—capital-intensive sectors like utilities may operate successfully with ratios around 2.0–3.0, while technology companies often maintain ratios above 8.0. Context matters more than absolute thresholds.
How is the Interest Coverage Ratio different from the debt-to-equity ratio?
The Interest Coverage Ratio measures a company’s ability to pay interest from current earnings, while the debt-to-equity ratio measures total debt relative to shareholder equity. Interest Coverage focuses on payment capability and cash flow adequacy; debt-to-equity examines capital structure and leverage. Both assess financial risk but from different perspectives—earning power vs. balance sheet strength.
Can a company have a negative Interest Coverage Ratio?
Yes. When EBIT is negative, the Interest Coverage Ratio becomes negative. This indicates the company is losing money from operations before interest expenses—a major financial warning. Negative ratios signal severe distress: the company cannot cover interest with earnings and must use cash reserves, raise capital, or restructure debt.
Why do some industries have lower acceptable Interest Coverage Ratios?
Capital-intensive industries like utilities, telecom, and real estate rely on heavy infrastructure investment funded by debt. These sectors produce stable, predictable cash flows that can support higher leverage and lower coverage ratios. A utility may safely operate with a 2.0× ratio, while a volatile tech company would face significant risk at the same level. Industry stability and asset bases determine acceptable ranges.
How often should investors check a company’s Interest Coverage Ratio?
Review Interest Coverage Ratios quarterly when earnings are released, but prioritize annual trends over quarterly fluctuations. Seasonal businesses naturally vary from quarter to quarter. Increase monitoring if ratios fall below 2.0×, the company operates in a cyclical industry, or financial conditions weaken. Stable blue-chip companies may only require annual review.
What’s the difference between Interest Coverage Ratio and Times Interest Earned?
Interest Coverage Ratio and Times Interest Earned (TIE) are identical metrics, both calculated as EBIT ÷ Interest Expense. TIE emphasizes how many times earnings cover interest, while ICR emphasizes financial coverage. Some analysts use slightly modified formulas, but the standard interpretation is the same.
