In 1987, a young investor named Warren Buffett famously said, “Leverage is the only way a smart person can go broke.” Yet that same investor later used leverage strategically to build one of the world’s most valuable companies. This paradox reveals a fundamental truth: leverage is neither inherently good nor bad; it’s a powerful financial tool that amplifies both gains and losses. Understanding the math behind money is what separates wealth building from financial ruin.
Leverage represents the strategic use of borrowed capital or fixed costs to increase the potential return on investment. When you use leverage, you’re essentially controlling a larger asset base with a smaller amount of your own money. This concept applies across investing, business operations, and real estate, creating opportunities for accelerated growth while simultaneously introducing measurable risk that must be managed with precision and discipline.
For a broader perspective on managing investments and choosing the right assets, see our guide on complete investing framework.
The mathematics of leverage is straightforward but consequential. If you invest $20,000 of your own money and earn a 10% return, you gain $2,000. But if you borrow an additional $80,000 at 5% interest and invest the total $100,000 at that same 10% return, your profit becomes $10,000 minus $4,000 in interest costs, netting $6,000, a 30% return on your original $20,000. This amplification effect works identically in reverse: a 10% loss without leverage costs you $2,000, but with 5:1 leverage, that same percentage decline wipes out $10,000, erasing half your initial capital.
This guide examines leverage through a data-driven lens, explaining the cause-and-effect relationships that determine when leverage accelerates wealth and when it destroys it. The evidence shows that leverage used with proper risk management and mathematical understanding creates genuine competitive advantages, while leverage applied without comprehension of its mechanics consistently leads to catastrophic outcomes.
Key Takeaways
- Leverage amplifies returns and losses equally: A 2:1 leverage ratio doubles both your gains and your losses, making risk management the critical success factor
- Different leverage types serve different purposes: Financial leverage affects investment returns, operating leverage impacts business profitability, and real estate leverage enables property acquisition with minimal capital
- The cost of leverage determines profitability: Borrowed capital only enhances returns when your investment return exceeds the borrowing cost by a margin sufficient to justify the additional risk
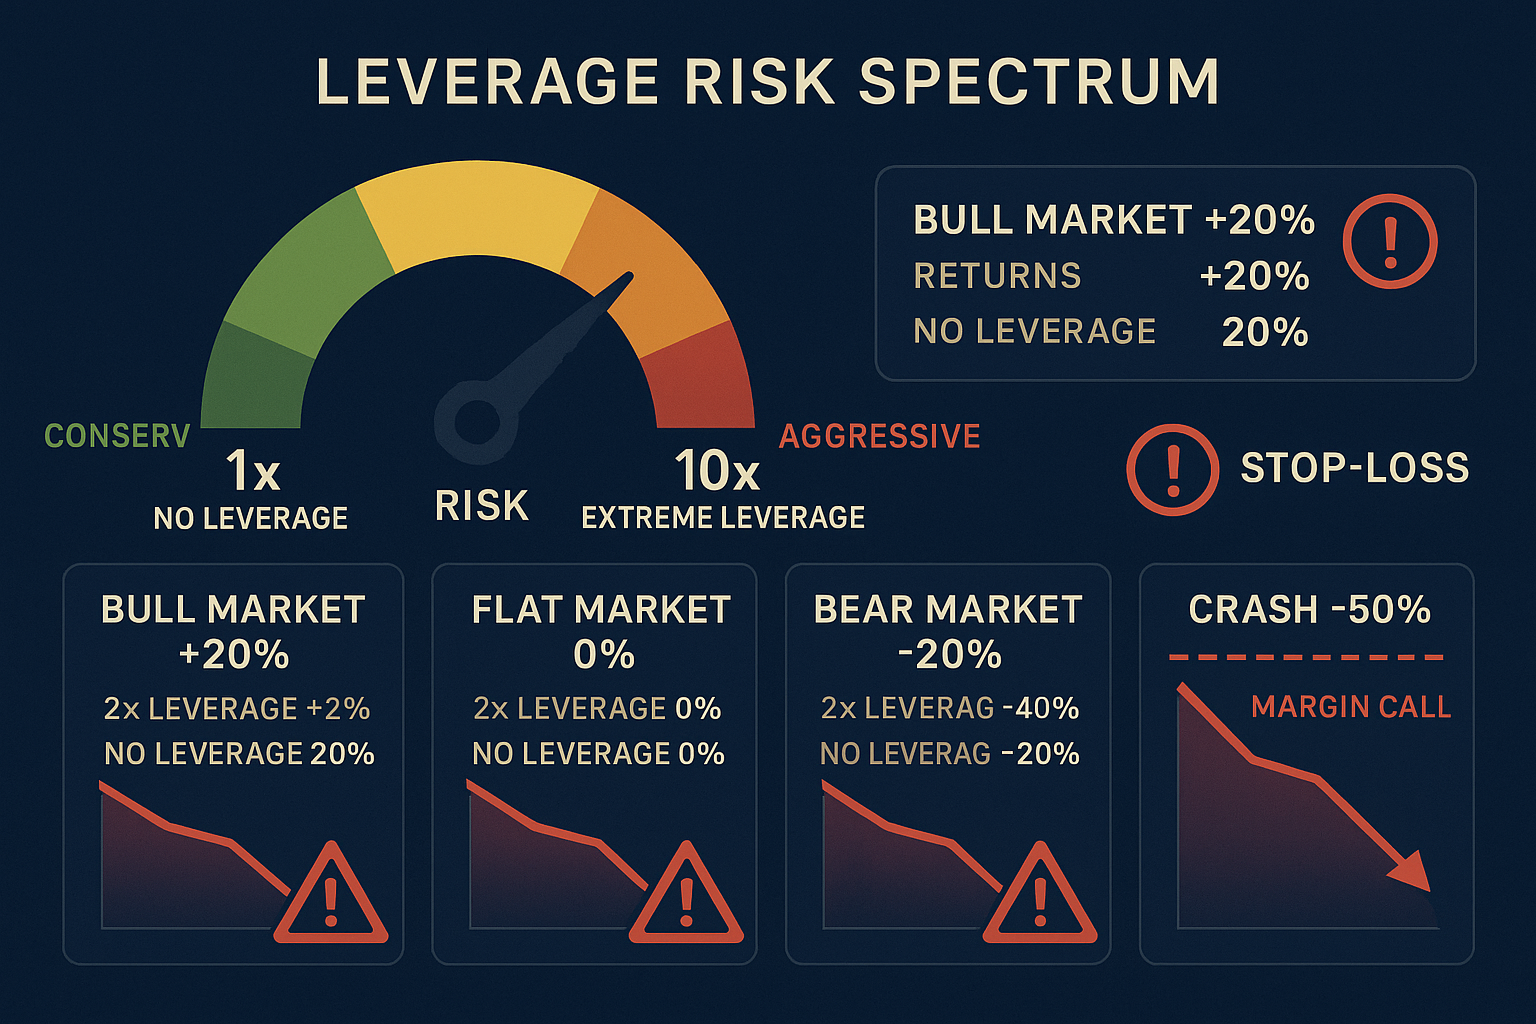
- Optimal leverage ratios vary by asset class and risk tolerance: Conservative investors typically use 1.5:1 to 2:1 ratios, while experienced traders may employ 3:1 to 5:1 under specific conditions
- Leverage requires continuous monitoring and predetermined exit rules: Successful leverage strategies include specific thresholds for reducing exposure and cutting losses before they become catastrophic
Understanding Leverage: The Fundamental Mechanics
Leverage functions as a financial multiplier, allowing investors and businesses to control assets worth more than their available capital. The core principle involves using borrowed funds or fixed obligations to increase exposure to potential gains, accepting proportionally increased exposure to potential losses as the inevitable tradeoff.
The Mathematical Foundation of Leverage
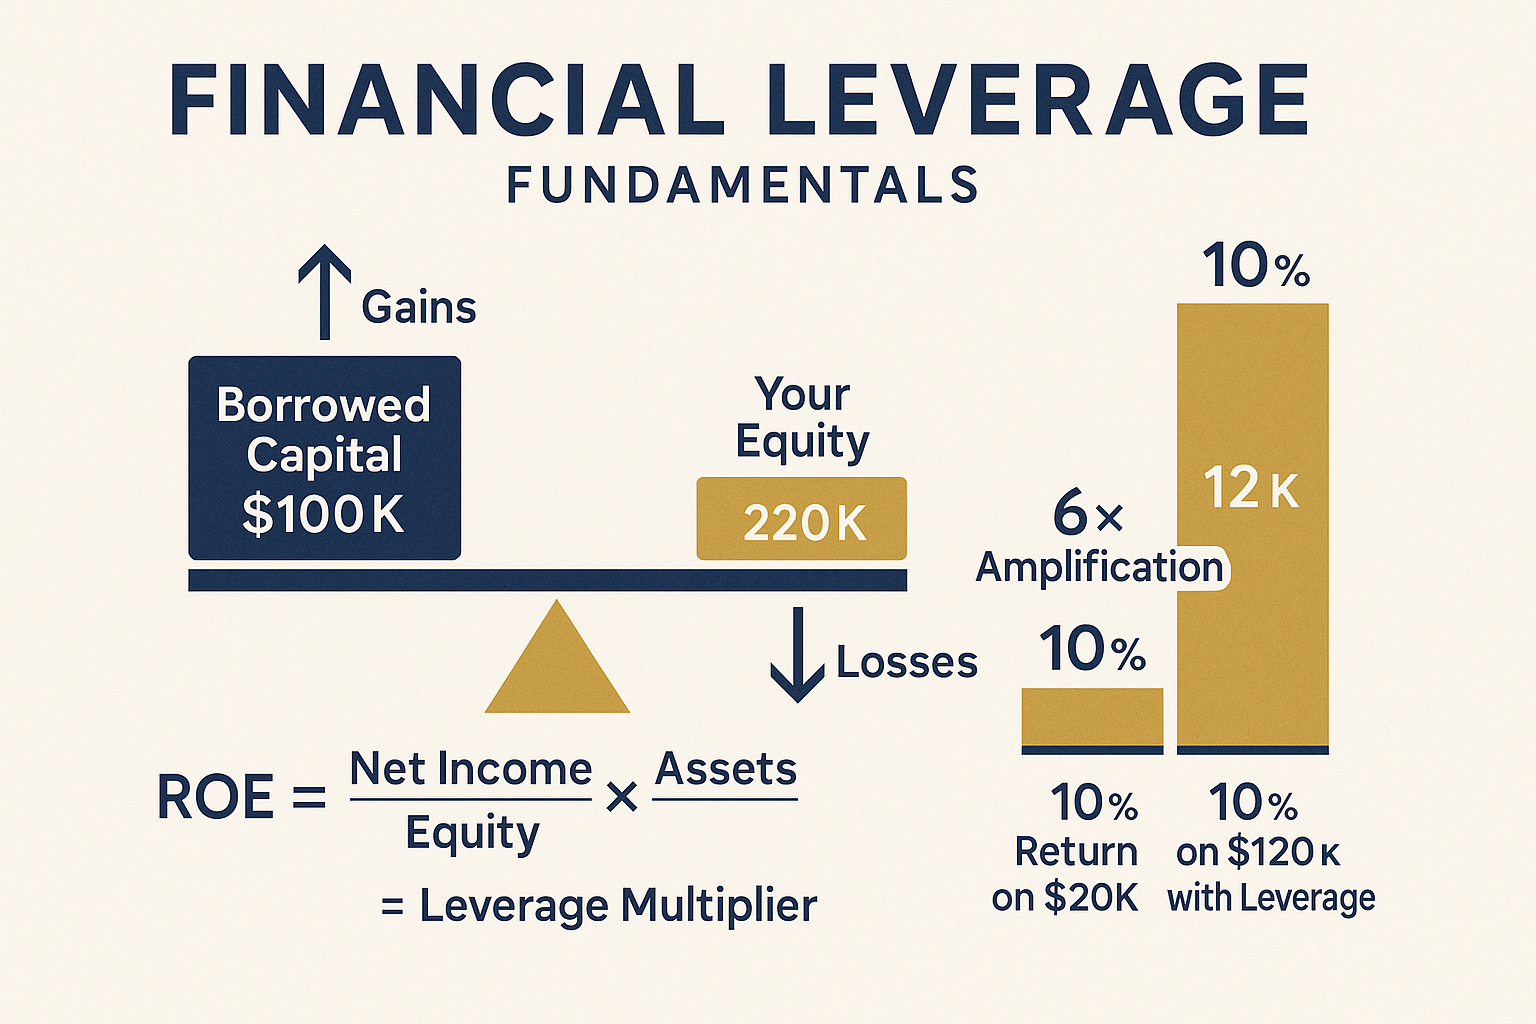
The leverage ratio expresses the relationship between total assets and equity capital. A leverage ratio of 2:1 means you control $2 in assets for every $1 of your own money. This ratio determines your return on equity (ROE) relative to your return on assets (ROA).
The leverage multiplier formula:
ROE = ROA × (Total Assets / Equity)
When your return on assets exceeds your cost of borrowing, leverage enhances your return on equity. When ROA falls below borrowing costs, leverage accelerates losses. This mathematical relationship explains why leverage creates asymmetric outcomes; the potential for outsized gains comes with the risk of magnified losses.
Consider a practical example: You have $50,000 to invest. Without leverage, investing in an asset that appreciates 15% generates $7,500 in profit, a 15% return on your equity. With 2:1 leverage, you borrow an additional $50,000 at 6% annual interest, investing $100,000 total. The same 15% appreciation yields $15,000 in gains minus $3,000 in interest costs, netting $12,000, a 24% return on your original $50,000.
The amplification works identically in reverse. A 15% decline without leverage loses $7,500 (15% of your equity). With 2:1 leverage, the same percentage drop costs $15,000 plus $3,000 in interest, totaling $18,000 in losses, a 36% decline in your equity position.
Types of Leverage Across Financial Contexts
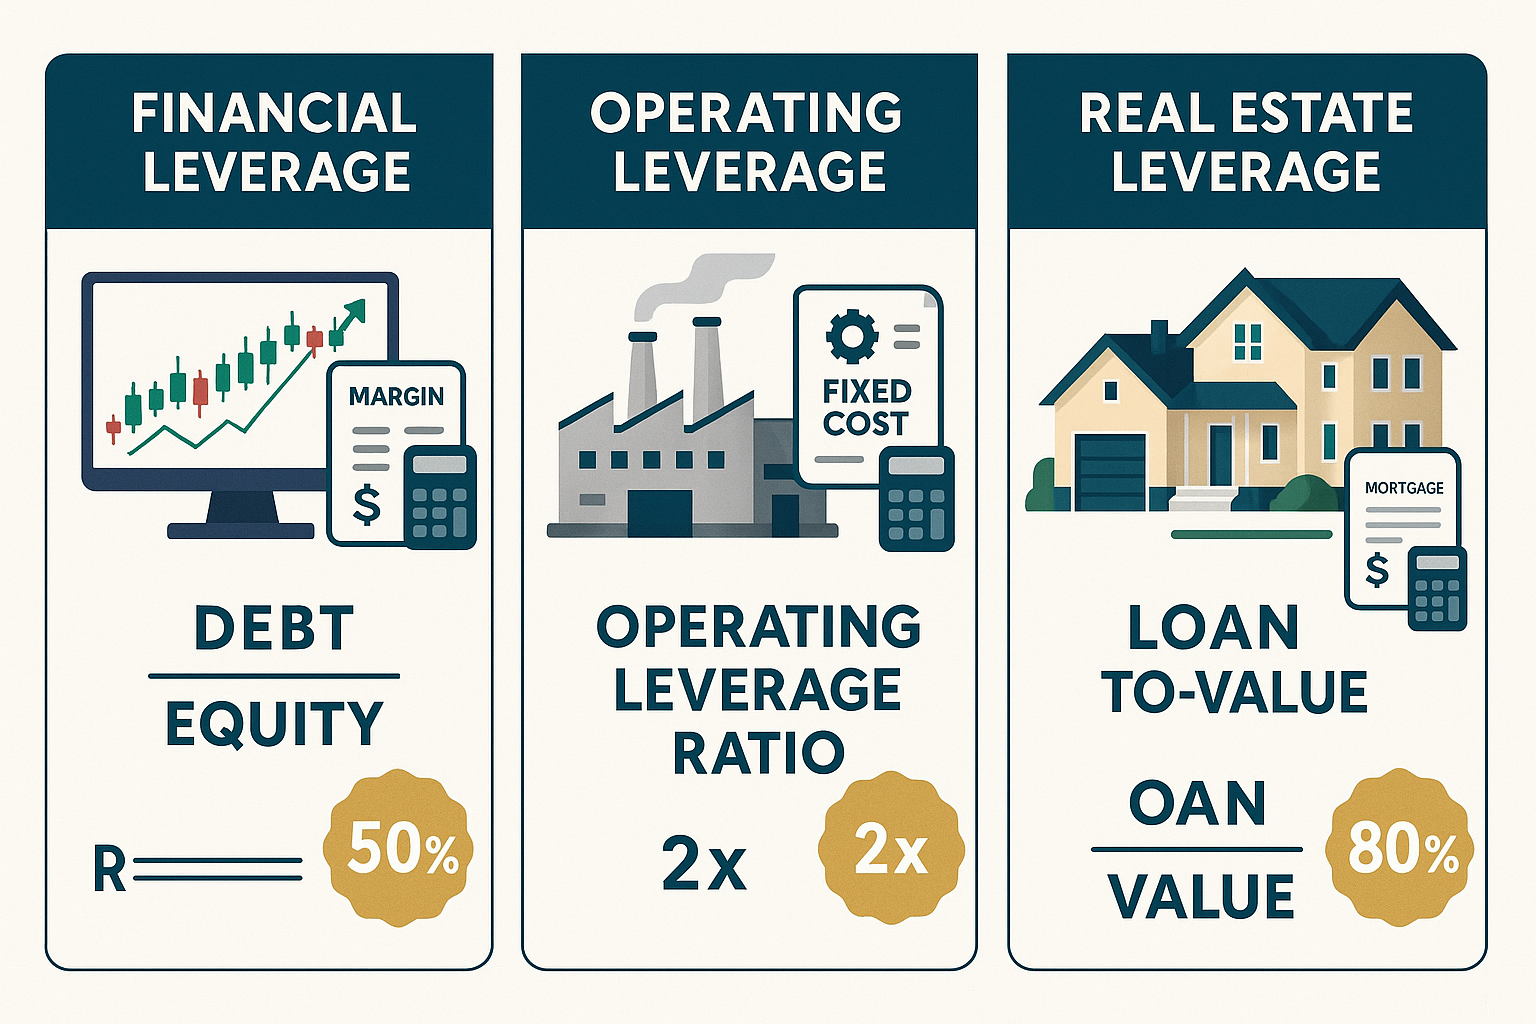
Leverage manifests in three primary forms, each with distinct mechanics and risk profiles:
Financial Leverage involves borrowing money to invest in assets expected to generate returns exceeding the borrowing cost. Examples include margin trading in stock accounts, leveraged ETFs, and debt-financed business acquisitions. Financial leverage directly impacts return on equity and creates the most immediate amplification of gains and losses.
Operating Leverage refers to the proportion of fixed costs in a business’s cost structure. Companies with high fixed costs and low variable costs experience dramatic profit swings as revenue changes. A software company with minimal marginal costs per additional customer has high operating leverage; each new sale flows almost entirely to profit once fixed costs are covered.
Real Estate Leverage uses mortgage debt to acquire property worth substantially more than the buyer’s down payment. A 20% down payment creates 5:1 leverage, allowing investors to control $500,000 in property with $100,000 in equity. Property appreciation applies to the full asset value while the investor’s capital commitment remains limited to the down payment.
Each leverage type requires different management approaches and risk assessment frameworks. Financial leverage demands constant monitoring of market values and margin requirements. Operating leverage necessitates careful revenue forecasting and cost structure analysis. Real estate leverage depends on property valuation accuracy and rental income stability.
The Cost of Capital: Where Leverage Becomes Profitable
Leverage only creates value when the return on borrowed capital exceeds its cost by a margin sufficient to compensate for increased risk. This spread between return and cost determines whether leverage enhances or destroys wealth.
The cost of leverage includes:
- Interest rates: The explicit cost of borrowing, whether through margin loans, mortgages, or corporate debt
- Fees and transaction costs: Origination fees, maintenance fees, and trading costs that reduce net returns
- Opportunity costs: The alternative uses for capital tied up in collateral or down payments
- Risk premium: The additional return required to justify the increased volatility and potential for total loss
A margin loan at 8% annual interest only makes financial sense when you have high confidence in generating returns exceeding 8% plus a risk premium of at least 2-4%. This means your target return should be 10-12% minimum to justify the leverage. Lower return expectations or higher borrowing costs make leverage economically irrational.
The debt-to-equity ratio provides a standardized measure for comparing leverage across companies and investment strategies. A ratio of 1.0 indicates equal debt and equity, while ratios above 2.0 suggest aggressive leverage that increases financial fragility.
Leverage and Compound Growth
Leverage interacts with compound growth in ways that dramatically affect long-term outcomes. When leverage enhances returns, the compounding effect accelerates wealth accumulation exponentially. When leverage amplifies losses, compounding works in reverse, creating a downward spiral that becomes increasingly difficult to recover from.
A 20% annual return compounded over 10 years turns $100,000 into $619,174 without leverage. With 2:1 leverage and 8% borrowing costs, achieving a net 32% annual return on equity (20% ROA × 2 leverage ratio – 8% interest cost) compounds to $1,797,443 over the same period, nearly three times the unleveraged outcome.
However, this calculation assumes consistent positive returns. In reality, volatility creates path dependency where the sequence of returns matters enormously. A 50% loss requires a 100% gain just to break even. With leverage, a 50% asset decline can wipe out your entire equity position, ending the compounding process permanently.
Understanding compound interest mechanics reveals why leverage requires exceptional risk management. The mathematical advantage of compounding only works when you avoid catastrophic losses that reset your capital base to zero.
Leverage in Investing: Strategies, Risks, and Returns
Investment leverage takes multiple forms, from margin accounts to leveraged ETFs to options strategies. Each approach offers distinct risk-return profiles and requires specific knowledge to implement effectively.
Margin Trading: Borrowing to Buy Securities
Margin accounts allow investors to borrow money from their brokerage to purchase securities, using their existing portfolio as collateral. Regulation T limits initial margin to 50%, meaning you can borrow up to 50% of a security’s purchase price, creating a maximum 2:1 leverage on new positions.
How margin trading works:
You deposit $50,000 into a margin account and want to buy stock. With a 50% initial margin, you can purchase up to $100,000 in securities, your $50,000 plus $50,000 borrowed from the broker. If the stock appreciates 20% to $120,000, your equity grows to $70,000 ($120,000 – $50,000 loan), a 40% return on your original $50,000.
If the stock declines 20% to $80,000, your equity falls to $30,000 ($80,000 – $50,000 loan), a 40% loss on your original capital. This symmetrical amplification continues until your equity falls below the maintenance margin requirement, typically 25-30% of the total position value.
When your equity drops below the maintenance margin, you receive a margin call requiring you to either deposit additional funds or sell securities to restore the required equity level. Failure to meet a margin call results in the broker liquidating your positions, potentially at the worst possible time during market declines.
Margin interest rates typically range from 6-12% annually, depending on account size and broker. These costs accrue daily and compound, reducing net returns. For margin trading to make economic sense, your expected return must exceed the margin rate plus a risk premium of at least 3-5%.
The mathematics show that margin trading works best for:
- Short-term positions where interest costs remain minimal
- High-conviction trades with a strong probability of gains exceeding borrowing costs
- Portfolios with low volatility where margin call risk stays manageable
- Investors with additional capital reserves to meet potential margin calls
Margin trading fails catastrophically when:
- Positions move against you rapidly, triggering forced liquidation
- Market volatility spikes, causing maintenance margin requirements to increase
- Interest costs accumulate during extended holding periods with minimal gains
- Multiple leveraged positions correlate, amplifying losses across the entire portfolio
Leveraged ETFs: Built-in Amplification
Leveraged exchange-traded funds use derivatives and debt to amplify the daily returns of an underlying index. A 2x leveraged S&P 500 ETF aims to deliver twice the daily return of the S&P 500, while a 3x fund targets triple the daily movement.
These instruments create leverage without margin accounts or borrowing, making amplified exposure accessible to retail investors. However, the daily rebalancing mechanism creates significant tracking error over multi-day periods, making leveraged ETFs unsuitable for long-term holding.
The compounding problem with leveraged ETFs:
Daily rebalancing means returns compound based on each day’s percentage change, not the overall period return. In volatile markets, this creates “volatility decay” where the leveraged ETF underperforms its theoretical multiple of the index return.
Example: An index starts at 100, rises 10% to 110, then falls 9.09% back to 100. The index return is 0%. A 2x leveraged ETF would rise 20% to 120, then fall 18.18% to 98.18, a 1.82% loss despite the index being flat. This decay accelerates with higher leverage multiples and increased volatility.
Leveraged ETFs work best for:
- Single-day directional trades
- Short-term tactical positions lasting a few days maximum
- Hedging strategies requiring temporary amplified exposure
- Experienced traders who understand daily rebalancing mechanics
They consistently underperform for:
- Buy-and-hold strategies over weeks or months
- Volatile markets with frequent direction changes
- Investors who don’t monitor positions daily
- Long-term wealth building where compounding matters
The best ETFs to buy for most investors avoid leverage entirely, focusing on low-cost index funds that compound reliably over decades.
Options as Leverage: Controlling Assets with Limited Capital
Options contracts provide leverage by controlling 100 shares of stock with a fraction of the capital required to own the shares outright. A call option gives you the right to buy stock at a specified price (strike price) before expiration, while a put option grants the right to sell.
Options leverage mechanics:
A stock trading at $100 per share requires $10,000 to buy 100 shares. A call option with a $100 strike price might cost $5 per share ($500 total for the 100-share contract). If the stock rises to $120, your shares would gain $2,000 (20% return). The call option would be worth at least $20 per share ($2,000 total), a 300% return on the $500 premium paid.
This 15:1 leverage amplification comes with total loss risk; if the stock stays below $100 at expiration, the option expires worthless and you lose 100% of the premium paid. This binary outcome differs from stock ownership, where shares retain value even after declines.
Options leverage offers:
- Defined maximum loss: You can only lose the premium paid, unlike margin trading, where losses can exceed your initial investment
- Asymmetric return profiles: Small capital outlays can generate large percentage gains
- Strategic flexibility: Options enable complex strategies like covered calls, protective puts, and spreads
- Capital efficiency: Control large positions with minimal capital commitment
Options leverage risks include:
- Time decay: Options lose value as expiration approaches, even if the stock price remains unchanged
- Volatility sensitivity: Option prices fluctuate based on implied volatility, adding complexity beyond simple directional bets
- Complexity: Understanding Greeks (delta, gamma, theta, vega) requires significant education
- Total loss potential: Most options expire worthless, making consistent profitability difficult
For most investors, options work best as portfolio insurance or income generation through covered calls rather than as primary leverage vehicles for speculation.
Risk Management for Leveraged Investments
Successful leverage requires systematic risk management with predetermined rules for position sizing, loss limits, and de-leveraging triggers.
Position sizing rules:
Never allocate more than 10-20% of your portfolio to leveraged positions. This ensures that even total loss of the leveraged position doesn’t catastrophically damage your overall wealth. With 2:1 leverage on 20% of your portfolio, you have effective 40% exposure to that position—aggressive but survivable if the trade fails.
Stop-loss discipline:
Establish specific price levels where you will exit leveraged positions regardless of your conviction about eventual recovery. A common rule: exit when a leveraged position loses 15-20% of the total position value, preventing small losses from becoming account-threatening disasters.
Diversification across leverage types:
Don’t concentrate leverage in a single strategy or asset class. Combining moderate margin usage with options strategies and unleveraged core holdings creates a balanced approach where no single leverage type dominates your risk profile.
Cash reserves for margin calls:
Maintain liquid cash reserves equal to at least 25-50% of your leveraged position values. This buffer allows you to meet margin calls without forced liquidation and provides capital to add to positions during temporary declines.
Understanding your personal risk tolerance and capacity helps determine appropriate leverage levels. The emergency fund guide explains how to build the financial foundation necessary before considering any leveraged investing.
Leverage in Business: Operating Leverage and Financial Structure
Businesses use leverage to amplify profitability and accelerate growth, but the mechanisms differ significantly from investment leverage. Operating leverage and financial leverage interact to determine how revenue changes translate into profit volatility.
Operating Leverage: Fixed Costs as Amplifiers
Operating leverage measures the proportion of fixed costs in a company’s cost structure. High fixed costs create dramatic profit swings as revenue changes because each additional dollar of revenue flows to profit once fixed costs are covered.
The operating leverage formula:
Degree of Operating Leverage (DOL) = % Change in EBIT / % Change in Sales
A DOL of 3.0 means a 10% increase in sales generates a 30% increase in operating profit (EBIT). This amplification works identically in reverse; a 10% sales decline causes a 30% profit drop.
High operating leverage examples:
- Airlines: Massive fixed costs for aircraft, gates, and crew salaries mean each additional passenger contributes almost entirely to profit once the flight is scheduled
- Software companies: Development costs are fixed; each additional license sold has near-zero marginal cost, creating extreme profit leverage
- Manufacturing: Factory overhead, equipment depreciation, and base labor costs remain constant regardless of production volume within capacity constraints
Low operating leverage examples:
- Consulting firms: Costs scale directly with revenue as more consultants are hired for more projects
- Retail: Inventory costs and sales commissions move proportionally with revenue
- Service businesses: Labor-intensive operations with minimal fixed infrastructure
Operating leverage creates competitive advantages during growth periods. Companies with high fixed costs and increasing revenue experience exponential profit growth, generating cash flow that can be reinvested for further expansion. This positive feedback loop explains why successful technology companies achieve such high valuations; their operating leverage converts revenue growth into disproportionate profit growth.
The risk emerges during revenue declines. High operating leverage companies face profit collapse when sales fall because fixed costs continue regardless of revenue. Airlines during the 2020 pandemic demonstrated this vulnerability; passenger volume dropped 90%, but aircraft lease payments, debt service, and core staffing costs remained, creating catastrophic losses.
Financial Leverage: Debt in the Capital Structure
Financial leverage in business refers to the use of debt financing to fund operations and growth. Companies borrow money through bonds, bank loans, or credit facilities, using the capital to invest in assets expected to generate returns exceeding the interest cost.
Why companies use debt:
- Tax advantages: Interest payments are tax-deductible, reducing the effective cost of debt below the stated interest rate
- Lower cost of capital: Debt is typically cheaper than equity because lenders have priority claims and don’t require equity returns
- Maintaining ownership: Debt financing allows founders and existing shareholders to retain control without dilution
- Amplifying returns: When return on assets exceeds debt costs, leverage increases return on equity for shareholders
The optimal capital structure balances the benefits of debt against the risks of financial distress. The debt ratio and capitalization ratio provide standardized measures for evaluating whether a company’s leverage is appropriate for its industry and business model.
Industry-specific leverage norms:
- Utilities: 60-70% debt ratios are common because stable cash flows support high leverage
- Technology: 10-30% debt ratios reflect volatile cash flows and high growth uncertainty
- Real estate: 50-70% debt ratios are standard, given tangible collateral and predictable rental income
- Retail: 30-50% debt ratios balance working capital needs against cyclical revenue
Financial leverage amplifies both operating leverage effects and business cycle impacts. A company with high operating leverage (fixed costs) and high financial leverage (debt) experiences extreme profit volatility; small revenue changes create massive swings in net income available to equity holders.
The Interaction of Operating and Financial Leverage
Combined leverage measures the total amplification effect when operating and financial leverage work together. The formula:
Degree of Combined Leverage (DCL) = DOL × DFL
Where DFL (Degree of Financial Leverage) = % Change in EPS / % Change in EBIT
A company with a DOL of 2.5 and a DFL of 1.8 has a DCL of 4.5, meaning a 10% sales increase generates a 45% increase in earnings per share. This extreme amplification creates spectacular returns during growth but catastrophic losses during downturns.
Case study: Restaurant chain expansion
A restaurant company has high operating leverage (fixed lease costs, kitchen equipment, base staffing) and uses debt to finance rapid expansion (financial leverage). During economic expansion, same-store sales increase 8%, but operating leverage amplifies this to 20% EBIT growth. Financial leverage further amplifies to 35% EPS growth. Stock price soars as investors extrapolate the growth.
During the recession, same-store sales declined 8%. Operating leverage converts this to a 20% EBIT decline. Financial leverage amplifies to a 35% EPS drop. Fixed debt payments consume cash flow, forcing store closures and creating a downward spiral. Stock price collapses as bankruptcy risk emerges.
This pattern repeats across industries and economic cycles. Companies with combined leverage outperform dramatically during expansions and underperform catastrophically during contractions. Understanding these mechanics helps investors identify when leverage creates opportunity versus when it signals danger.
Managing Business Leverage for Sustainable Growth
Successful businesses calibrate leverage to match their competitive position, industry dynamics, and growth stage.
Early-stage companies typically minimize financial leverage because:
- Uncertain cash flows make debt service risky
- Equity financing preserves financial flexibility
- Growth opportunities require capital for reinvestment
- Lenders demand high rates or restrictive covenants
Mature companies often increase financial leverage because:
- Stable cash flows support predictable debt service
- Lower growth rates reduce reinvestment needs
- Tax benefits of debt become more valuable
- Returning capital to shareholders through buybacks (often debt-financed) optimizes capital structure
The cash conversion cycle influences optimal leverage levels. Companies that convert inventory to cash quickly can support higher leverage than those with slow turnover and extended receivables.
Leverage adjustment strategies:
- Countercyclical deleveraging: Reduce debt during economic expansions when asset values are high, and refinancing is easy
- Covenant monitoring: Track debt covenant ratios monthly to avoid technical defaults that trigger acceleration
- Maturity laddering: Stagger debt maturities to avoid refinancing risk during market disruptions
- Interest rate hedging: Use swaps or caps to convert variable-rate debt to fixed rates, reducing cash flow volatility
The relationship between assets and liabilities determines financial flexibility. Companies with high-quality liquid assets can support more leverage than those with illiquid or depreciating assets.
Real Estate Leverage: Mortgages and Property Investment
Real estate represents the most common leverage application for individual wealth building. Mortgage financing allows buyers to control property worth 4-5 times their down payment, creating substantial wealth accumulation potential when property values appreciate.
Mortgage Mechanics and Leverage Ratios
A mortgage is a secured loan using the property as collateral. The loan-to-value (LTV) ratio measures leverage intensity:
LTV = Loan Amount / Property Value
A $400,000 property purchased with a $320,000 mortgage (80% LTV) and $80,000 down payment creates 5:1 leverage; you control $400,000 in assets with $80,000 in equity.
How real estate leverage amplifies returns:
The property appreciates 5% annually to $420,000. Your equity grows from $80,000 to $100,000 ($420,000 – $320,000 mortgage), a 25% return on your initial investment. The 5% property appreciation translates to a 25% equity return because of 5:1 leverage.
If property values decline 5% to $380,000, your equity falls from $80,000 to $60,000 ($380,000 – $320,000 mortgage), a 25% loss. The same 5:1 leverage amplifies both gains and losses equally.
Mortgage costs affect net returns:
A $320,000 mortgage at 7% interest costs $22,400 annually. If the property generates $24,000 in rental income and incurs $8,000 in expenses (property tax, insurance, maintenance), your annual cash flow is negative $6,400 ($24,000 – $8,000 – $22,400).
Despite negative cash flow, the investment can still be profitable if appreciation exceeds the carrying cost. In the example above, $20,000 in appreciation minus $6,400 in negative cash flow nets $13,600 annual profit, a 17% return on the $80,000 down payment.
This calculation explains why real estate investors accept negative cash flow during the early years of ownership; leverage converts modest appreciation into substantial equity returns. However, this strategy requires sufficient reserves to cover negative cash flow and assumes continued appreciation.
Primary Residence vs. Investment Property Leverage
Leverage mechanics differ between owner-occupied homes and investment properties, affecting both risk profiles and return calculations.
Primary residence leverage:
- Lower down payments: FHA loans allow 3.5% down, creating nearly 30:1 leverage
- Lower interest rates: Owner-occupied mortgages typically cost 0.5-1% less than investment property loans
- Tax benefits: Mortgage interest deduction and capital gains exclusion ($250K single, $500K married) enhance returns
- Forced savings: Mortgage principal payments build equity automatically, creating disciplined wealth accumulation
Investment property leverage:
- Higher down payments: Typically 20-25% minimum, limiting leverage to 4-5:1
- Higher interest rates: Lenders charge premiums for non-owner-occupied properties
- Rental income: Property generates cash flow to service debt, unlike primary residences
- Depreciation: Tax deductions for property depreciation offset rental income
The 3x rent rule helps determine appropriate property prices relative to income, while the 20/4/10 rule guides auto purchases that won’t compromise housing affordability.
Real Estate Leverage Risks and Mitigation
Real estate leverage creates specific risks that differ from securities leverage:
Illiquidity risk: You cannot quickly sell property during market declines. Forced sales during downturns often result in prices below fair value, converting paper losses into realized losses.
Concentration risk: A single property often represents 50-100% of an investor’s net worth, creating extreme concentration. Property-specific problems (foundation issues, neighborhood decline, problem tenants) can devastate wealth.
Leverage risk during refinancing: Adjustable-rate mortgages create payment shock when rates reset. Property value declines can prevent refinancing, trapping borrowers in high-rate loans.
Negative equity: When property values fall below mortgage balances, owners have negative equity. This creates strategic default incentives and limits mobility.
Mitigation strategies:
- Conservative LTV ratios: Using 60-70% LTV instead of a maximum of 80-95% creates an equity buffer against value declines
- Fixed-rate mortgages: Locking in rates eliminates payment uncertainty and refinancing risk
- Diversification: Owning multiple properties across different markets reduces concentration risk
- Cash reserves: Maintaining 6-12 months of mortgage payments in liquid reserves prevents forced sales during temporary income disruptions
Real estate investment trusts (REITs) offer leveraged real estate exposure without concentration risk or management responsibilities. The best REITs to invest in provide diversified property portfolios with professional management and daily liquidity.
Calculating Real Estate Leverage Returns
Accurate return calculation requires accounting for all costs and the time value of money. The cash-on-cash return measures annual cash flow relative to initial investment:
Cash-on-Cash Return = Annual Cash Flow / Total Cash Invested
A property purchased for $400,000 with $80,000 down generates $24,000 in rent, incurs $8,000 in expenses, and requires $22,400 in mortgage payments. Annual cash flow is negative $6,400, creating a -8% cash-on-cash return.
However, total return includes appreciation and principal paydown:
- Cash flow: -$6,400
- Appreciation (5%): $20,000
- Principal paydown: $4,800
- Total annual return: $18,400 on $80,000 invested = 23% return
This comprehensive calculation reveals the true economics of leveraged real estate investment. The negative cash flow is offset by forced savings through principal reduction and appreciation amplified by leverage.
Tax-adjusted returns add another layer:
- Depreciation deduction (3.636% of building value annually): $12,000 tax deduction
- Tax savings (at 24% marginal rate): $2,880
- After-tax return: $18,400 + $2,880 = $21,280 = 26.6% return
These calculations demonstrate why real estate remains a primary wealth-building vehicle despite complexity and illiquidity. Leverage converts modest appreciation and rental income into substantial equity returns, while tax benefits enhance after-tax profitability.
Strategic Leverage: When to Use It and When to Avoid It
Leverage decisions should be based on mathematical analysis of expected returns, costs, risks, and personal circumstances rather than emotional factors or market timing attempts.
Conditions Favoring Leverage Use
Leverage makes economic and strategic sense when specific conditions align:
1. Return spread exceeds risk premium
When you have high confidence that investment returns will exceed borrowing costs by at least 3-5%, leverage enhances expected value. A mortgage at 7% makes sense when property appreciation plus rental yield is expected to exceed 10-12%.
2. Long time horizon reduces volatility impact
Leverage risk decreases with longer holding periods because short-term volatility matters less. A 30-year mortgage on a primary residence survives market cycles that would destroy a leveraged trading position held for weeks.
3. Stable income supports debt service
Reliable cash flow from employment, business operations, or rental income ensures you can meet debt obligations regardless of asset value fluctuations. This stability allows higher leverage ratios without excessive default risk.
4. Asset quality justifies confidence
Leverage works best with high-quality assets, diversified index funds, prime real estate in growing markets, or businesses with durable competitive advantages. Leveraging speculative assets amplifies already-high risk to dangerous levels.
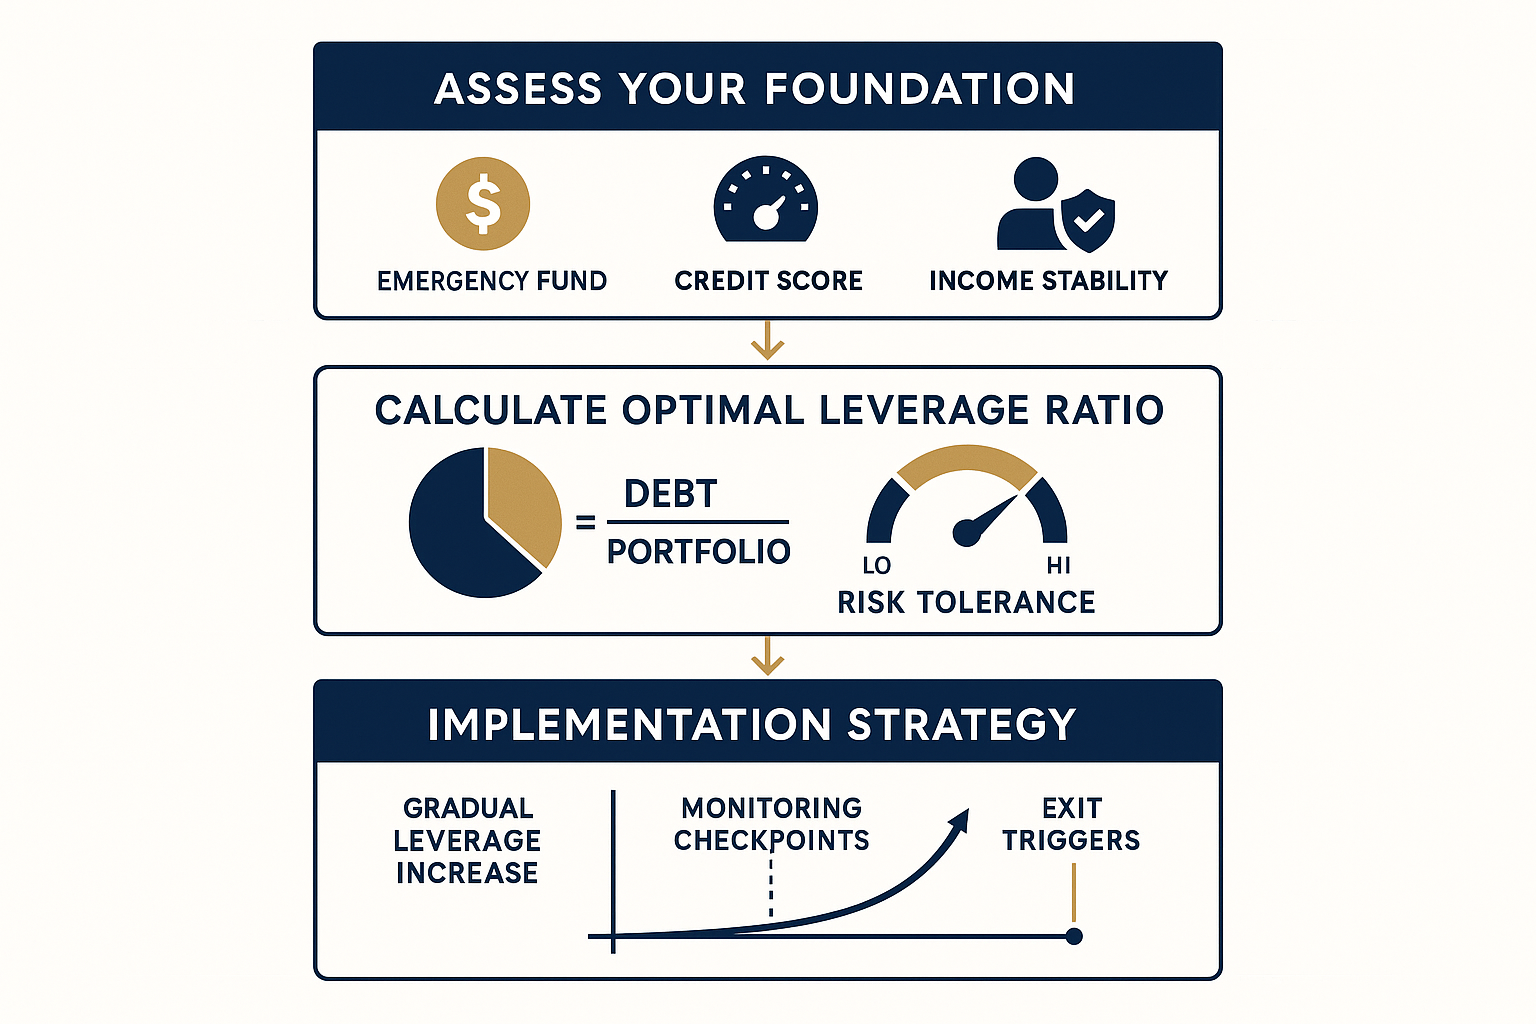
5. Personal financial foundation is solid
Adequate emergency reserves, stable employment, good credit, and low existing debt create the foundation for adding leverage safely. The 50/30/20 budgeting rule helps ensure basic financial health before considering leverage.
Conditions Requiring Leverage Avoidance
Certain circumstances make leverage economically irrational or excessively risky:
1. Insufficient emergency reserves
Using leverage before establishing 6-12 months of expenses in liquid savings creates catastrophic risk. Temporary income disruption forces asset sales at the worst time, converting paper losses into permanent wealth destruction.
2. Unstable income or employment
Variable income from commissions, contract work, or early-stage businesses makes debt service risky. Leverage requires predictable cash flow; income volatility creates default risk that outweighs potential returns.
3. High existing debt levels
Adding leverage when debt-to-income ratios already exceed 30-40% compounds risk and limits financial flexibility. Each additional debt layer increases fragility and reduces the capacity to weather adverse events.
4. Short time horizons
Leverage for short-term speculation exposes you to maximum volatility risk with minimal time for recovery. Transaction costs and interest expenses consume returns, making profitable short-term leverage extremely difficult.
5. Emotional decision-making
Leverage amplifies both returns and emotions. Investors who panic during declines or become euphoric during rallies make catastrophic decisions with leveraged positions. Self-awareness about emotional discipline is essential before using leverage.
6. Insufficient knowledge
Leverage requires understanding of margin requirements, interest calculations, tax implications, and risk management. Using leverage without this knowledge is speculation, not investing.
Optimal Leverage Ratios by Investor Profile
Different investor types should use different maximum leverage levels based on risk tolerance, knowledge, and circumstances:
Conservative investors:
- Maximum 1.5:1 overall leverage
- Primary residence mortgage only
- No margin trading or leveraged ETFs
- Focus on debt-free wealth accumulation
Moderate investors:
- Maximum 2:1 overall leverage
- Mortgage plus conservative margin use (10-20% of portfolio)
- Investment property with 20%+ down payment
- Strict stop-loss rules and position limits
Aggressive investors:
- Maximum 3:1 overall leverage
- Multiple leveraged positions across asset classes
- Options strategies for defined-risk leverage
- Daily monitoring and active risk management
Professional traders:
- 4-10:1 leverage on specific positions
- Sophisticated hedging and portfolio construction
- Institutional risk management systems
- Full-time focus on position management
These guidelines assume adequate financial foundation, stable income, and appropriate knowledge for each level. Most investors should remain in the conservative to moderate range, using leverage sparingly and strategically rather than as a primary strategy.
Understanding your risk tolerance and capacity helps determine appropriate leverage levels. The cycle of market emotions shows how leverage amplifies psychological pressure during market volatility.
Leverage and Portfolio Construction
Integrating leverage into a comprehensive portfolio requires balancing leveraged and unleveraged positions to achieve target risk-return profiles.
Core-satellite approach:
- Core holdings (70-80%): Unleveraged, diversified index funds providing stable returns
- Satellite positions (20-30%): Selective leverage on high-conviction ideas
- Cash buffer (10-20%): Liquid reserves for opportunities and margin calls
This structure allows leverage to enhance returns without creating portfolio-wide fragility. The unleveraged core provides stability while leveraged satellites add return potential.
Leverage across asset classes:
Rather than concentrating leverage in one area, distribute it across uncorrelated assets:
- Equities: Moderate margin use (1.3-1.5:1) on diversified index positions
- Real estate: Primary residence mortgage (4-5:1 on that asset only)
- Fixed income: Unleveraged bonds providing stability and liquidity
- Alternatives: Selective options strategies with defined maximum loss
This diversification ensures that leverage in one asset class doesn’t create correlated risk across the entire portfolio.
Rebalancing with leverage:
Leveraged positions require more frequent rebalancing because amplified returns cause rapid allocation drift. Monthly or quarterly rebalancing maintains target leverage ratios and prevents excessive concentration.
The dollar-cost averaging strategy works poorly with leverage because consistent buying during declines amplifies losses. Lump-sum investing or tactical leverage adjustment based on valuations works better for leveraged positions.
Measuring and Monitoring Leverage Risk
Effective leverage management requires continuous monitoring of specific metrics that signal when risk is escalating beyond acceptable levels.
Key Leverage Metrics to Track
1. Leverage ratio
Current formula: Total Assets / Equity
Track this weekly for investment accounts, monthly for business, and quarterly for real estate. Establish maximum thresholds and reduce positions when exceeded.
2. Interest coverage ratio
Formula: EBIT / Interest Expense
This measures how many times your earnings cover interest obligations. Ratios below 2.5-3.0 signal dangerous leverage levels where small earnings declines threaten debt service capacity.
3. Debt service coverage ratio (real estate)
Formula: Net Operating Income / Total Debt Service
Lenders typically require 1.25-1.35. Ratios below 1.0 mean property income doesn’t cover mortgage payments, requiring capital contributions to avoid default.
4. Margin to equity ratio (investment accounts)
Formula: Margin Loan / Account Equity
Track this daily when using margin. Ratios above 0.5 create significant margin call risk. Reduce positions when this exceeds 0.3-0.4.
5. Volatility-adjusted leverage
Formula: Leverage Ratio × Asset Volatility
A 2:1 leverage ratio on an asset with 15% volatility creates 30% portfolio volatility. This metric reveals true risk exposure better than the leverage ratio alone.
Warning Signs of Excessive Leverage
Specific indicators signal when leverage has become dangerous:
Behavioral warning signs:
- Checking positions constantly throughout the day
- Anxiety about market movements
- Inability to sleep due to position concerns
- Hiding leverage use from spouse or financial advisor
- Increasing leverage to recover from losses
Financial warning signs:
- Margin utilization exceeding 40-50% of available credit
- Using credit cards or home equity to fund investments
- Skipping emergency fund contributions to make debt payments
- Debt service consuming more than 30-40% of gross income
- Unable to meet margin call without selling positions
Market warning signs:
- Volatility is increasing significantly (VIX above 25-30)
- Correlations across assets approaching 1.0 (diversification failing)
- Credit spreads are widening (borrowing costs are increasing)
- Margin debt levels are at historical highs relative to market cap
When multiple warning signs appear simultaneously, immediate deleveraging is appropriate regardless of your conviction about eventual recovery.
Deleveraging Strategies
Reducing leverage requires systematic approaches that minimize transaction costs and tax impacts:
Gradual reduction:
Decrease leverage by 10-20% monthly over 3-6 months. This avoids forced sales at unfavorable prices while steadily reducing risk. Use new contributions and dividend income to pay down margin loans rather than reinvesting.
Selective position closure:
Identify positions with the worst risk-adjusted return prospects and close those first. This improves portfolio quality while reducing leverage, creating a double benefit.
Covered call writing:
Selling covered calls against leveraged equity positions generates premium income that can be used to reduce margin debt without selling shares. This strategy works best in sideways or modestly bullish markets.
Asset reallocation:
Shift from leveraged positions to unleveraged alternatives with similar exposure. Replace leveraged individual stocks with unleveraged index ETFs, maintaining market exposure while reducing leverage.
Refinancing:
For real estate or business debt, refinancing to longer terms or lower rates reduces debt service requirements and improves coverage ratios without reducing principal balances.
The balance sheet basics explain how to track assets, liabilities, and equity to monitor leverage levels accurately.
📊 Leverage Investment Calculator
Compare leveraged vs. unleveraged investment returns
Without Leverage
With Leverage
Conclusion: The Disciplined Use of Leverage
Leverage represents one of the most powerful tools in finance—capable of accelerating wealth building when used with discipline and destroying capital when applied carelessly. The mathematics are unforgiving: leverage amplifies both gains and losses with perfect symmetry, making risk management the determining factor between success and catastrophic failure.
The evidence across investing, business, and real estate demonstrates consistent patterns. Leverage creates value when:
- Returns exceed costs by margins sufficient to justify increased risk
- Time horizons allow volatility to be weathered without forced liquidation
- Financial foundations provide buffers against temporary adverse events
- Knowledge and discipline enable systematic risk management
- Position sizing limits single-position failures to manageable losses
Leverage destroys wealth when:
- Borrowing costs approach or exceed expected returns
- Short time horizons expose positions to maximum volatility
- Insufficient reserves force sales during market declines
- Emotional decision-making overrides systematic rules
- Excessive concentration creates correlated failures across positions
The path forward requires honest assessment of your financial foundation, risk tolerance, knowledge level, and emotional discipline. Most investors should use leverage sparingly, a mortgage on a primary residence, perhaps modest margin use on a small portion of a well-diversified portfolio, and selective options strategies for defined-risk opportunities.
Aggressive leverage should be reserved for those with exceptional knowledge, stable income, substantial reserves, and demonstrated emotional discipline during market stress. The historical record shows that most investors who use aggressive leverage eventually experience catastrophic losses that erase years of gains.
Actionable next steps:
- Assess your current leverage: Calculate your total leverage ratio across all assets and liabilities using the formulas provided in this guide
- Establish maximum leverage limits: Define specific thresholds you will not exceed based on your risk tolerance and financial circumstances
- Build your foundation: Ensure you have 6-12 months of expenses in emergency reserves before adding any leverage
- Start small: If using leverage for the first time, begin with conservative ratios (1.5:1 or less) on small portions of your portfolio
- Implement monitoring systems: Set up weekly or monthly reviews of leverage metrics with predetermined deleveraging triggers
- Continue education: Study investing fundamentals, risk management, and valuation principles before increasing leverage
Leverage is neither inherently good nor bad; it's a tool that amplifies the quality of your decisions. Make better decisions through education, discipline, and systematic risk management, and leverage can accelerate your path to financial independence. Make poor decisions, and leverage will accelerate your path to financial ruin. The choice, and the math behind it, are entirely yours
References
[1] Federal Reserve Board. "Regulation T: Credit by Brokers and Dealers." Federal Reserve System, 2025.
[2] Securities and Exchange Commission. "Margin: Borrowing Money to Pay for Stocks." Investor.gov, 2025.
[3] Morningstar. "Leveraged and Inverse ETFs: A Closer Look." Morningstar Investment Research, 2024.
[4] CFA Institute. "Capital Structure and Leverage." CFA Program Curriculum, Level II, 2025.
[5] National Association of Realtors. "Investment and Vacation Home Buyers Survey." NAR Research, 2024.
[6] Federal Housing Finance Agency. "Mortgage Interest Rates and House Price Index." FHFA Data, 2025.
[7] Investopedia. "Operating Leverage and Business Risk." Financial Education Resources, 2025.
Author Bio
Max Fonji is the founder of The Rich Guy Math, a data-driven financial education platform dedicated to teaching the mathematical principles behind wealth building, investing, and risk management. With a background in financial analysis and a commitment to evidence-based investing, Max translates complex financial concepts into clear, actionable insights for beginner and intermediate investors. His work emphasizes the cause-and-effect relationships that determine financial outcomes, helping readers build confidence through understanding rather than speculation.
Educational Disclaimer
This article is provided for educational and informational purposes only and does not constitute financial, investment, tax, or legal advice. The content presents general principles and concepts related to leverage and should not be considered personalized recommendations for any specific individual's financial situation.
Leverage involves substantial risk, including the potential for losses exceeding your initial investment. Past performance does not guarantee future results. Before using leverage in any form, consult with qualified financial, tax, and legal professionals who can assess your specific circumstances and provide personalized guidance.
The Rich Guy Math and its authors do not provide individualized investment advice or recommendations. All investment decisions carry risk, and readers are solely responsible for their own financial decisions and outcomes.
Frequently Asked Questions
What is a good leverage ratio?
A good leverage ratio depends on the industry. Capital-intensive sectors like utilities, airlines, and manufacturing can operate safely with higher leverage. Tech, SaaS, and service-based companies typically maintain lower leverage because their cash flow can be more volatile. Benchmark against industry averages for the most accurate assessment.
Is leverage always risky?
Leverage is not inherently risky when supported by stable cash flow, strong interest coverage, and conservative debt levels. Risk increases when revenue is cyclical, interest costs rise, or companies rely heavily on short-term debt. Well-managed leverage can enhance returns without exposing the business to distress.
Why do companies prefer debt over equity?
Companies often prefer debt because it avoids ownership dilution and provides tax benefits—interest expenses are tax-deductible. When cash flow is stable, debt can be a cheaper source of capital than issuing new shares.
How does leverage affect stock prices?
High leverage increases financial risk. During uncertain market periods, investors may discount a company's valuation due to the higher probability of distress. Conversely, moderate leverage can boost returns and appear attractive when debt is inexpensive and earnings are predictable.
Does leverage increase ROE?
Yes—leverage amplifies Return on Equity (ROE) when a company’s return on assets exceeds its cost of borrowing. This positive leverage effect can enhance shareholder returns. However, if borrowing costs rise or profits fall, leverage can reduce ROE just as quickly.
How does Federal Reserve policy affect leverage?
Federal Reserve rate hikes increase borrowing costs, reducing the benefits of leverage and pressuring cash flow. Lower interest rates encourage companies to take on more debt since borrowing becomes cheaper. Fed policy directly shapes how attractive or risky leverage becomes.
Related posts:
 Dividend Portfolio: How to Build One for Steady Passive Income
 Why Should You Invest? The Benefits of Long-Term Investing Explained
 What Is a Hedge Fund? How It Works, Strategies, and Risks Explained
 S&P 500 Total Return 2024: Full Performance Breakdown
 Margin Investing: How It Works, Risks, Examples, and Smart Strategies
 Robinhood vs Fidelity: Which Brokerage Is Better for Investors?