
In 1973, a young investor named Sam Zell purchased a distressed Chicago apartment building for $2.7 million, using just $8,000 of his own money. The rest came from creative financing and leverage. That single deal launched what would become a $5 billion real estate empire. Zell’s story illustrates the transformative power of Leverage in Real Estate: the strategic use of borrowed capital to amplify returns and build wealth faster than cash-only investing ever could.
Leverage in Real Estate represents one of the most powerful wealth-building tools available to investors, yet it remains misunderstood by many beginners. At its core, leverage means using other people’s money, typically through mortgages or loans, to control assets worth far more than your initial capital. This mathematical advantage can multiply returns dramatically, but it also amplifies risks in equal measure.
Understanding the math behind money in real estate leverage separates successful investors from those who overextend and fail. This comprehensive guide breaks down exactly how leverage works, the formulas that govern returns, the benefits that make it attractive, the risks that demand respect, and real-world examples that demonstrate both triumph and caution.
Key Takeaways
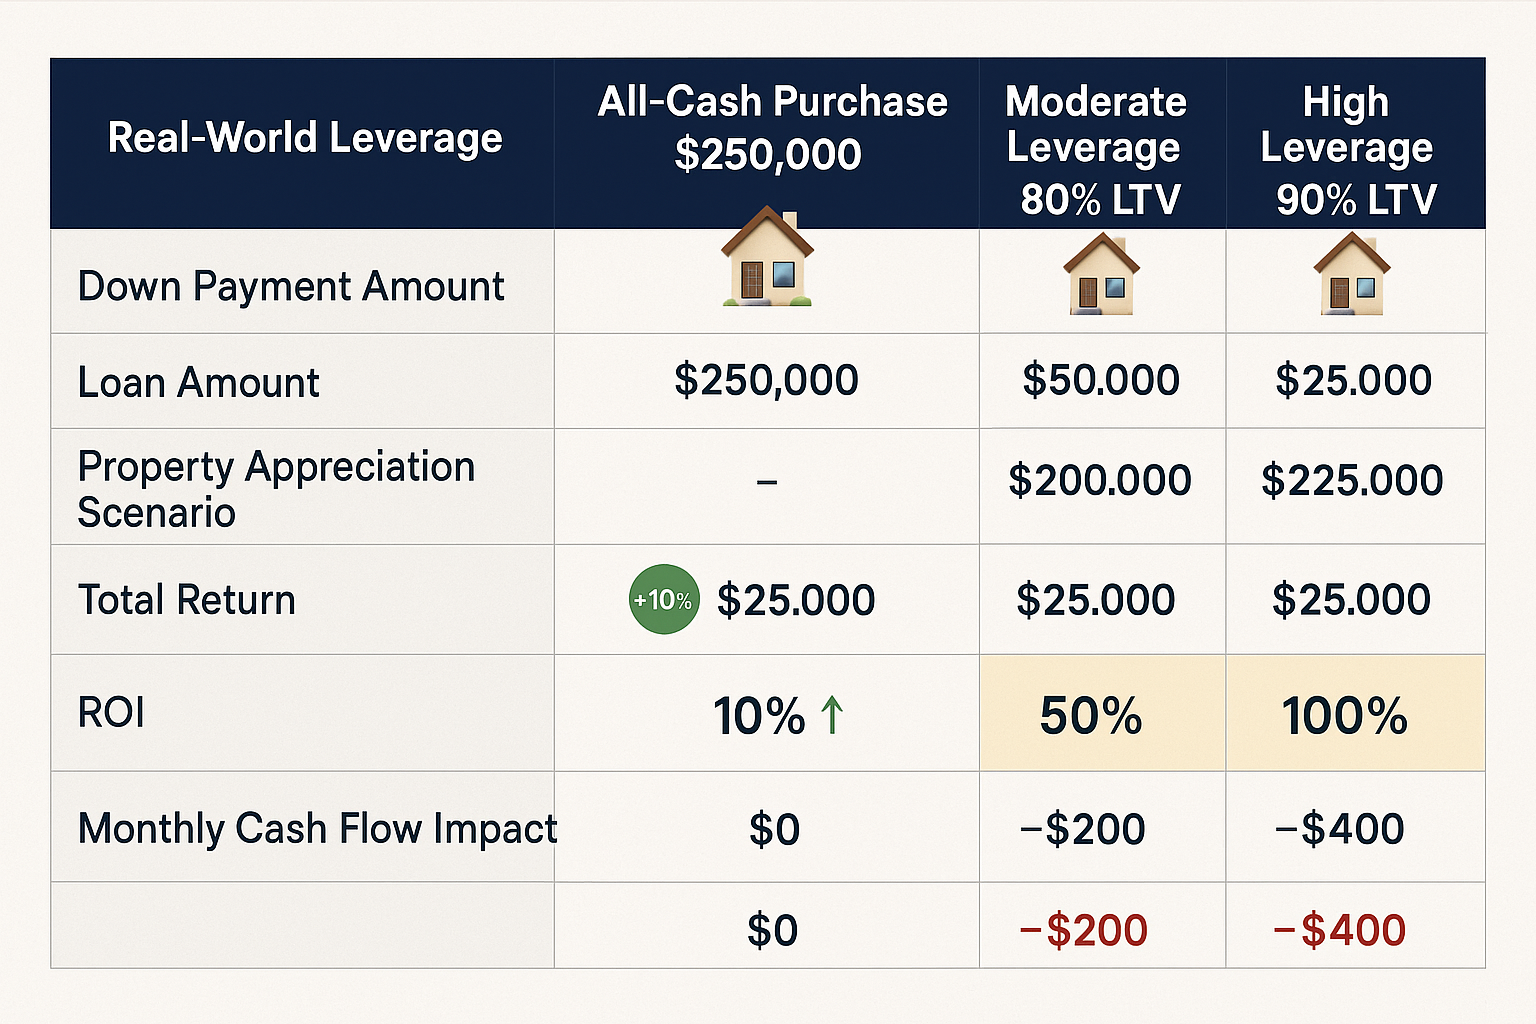
- Leverage multiplies both gains and losses: A 20% down payment creates 5:1 leverage, meaning a 10% property appreciation yields a 50% return on your invested capital, but a 10% decline creates a 50% loss
- Loan-to-Value (LTV) ratio determines risk exposure: Higher LTV ratios (above 80%) amplify returns but increase vulnerability to market downturns and negative equity scenarios
- Cash-on-cash return measures true leverage efficiency: This metric divides annual pre-tax cash flow by total cash invested, revealing whether borrowed capital actually improves investment performance
- Debt service coverage ratio (DSCR) protects against cash flow failure: Lenders typically require DSCR above 1.25, meaning net operating income must exceed debt payments by at least 25% to maintain financial stability
- Strategic leverage requires a margin of safety: Successful real estate investors maintain equity cushions, emergency reserves, and conservative financing to survive market cycles and unexpected downturns
What Is Leverage in Real Estate?
Leverage in Real Estate refers to the practice of using borrowed funds to purchase, control, or invest in property assets. Rather than paying the full purchase price in cash, investors contribute a portion (the down payment) and finance the remainder through mortgages or loans.
This creates a mathematical multiplier effect on returns. When you control a $500,000 property with $100,000 down (20%), you’ve created 5:1 leverage. Any appreciation or depreciation in the property’s value affects your equity position at five times the rate of the actual market movement.
The Mathematical Foundation
The leverage ratio equals the total asset value divided by the equity invested:
Leverage Ratio = Total Property Value ÷ Equity Invested
For example:
- Property value: $300,000
- Down payment: $60,000 (20%)
- Loan amount: $240,000
- Leverage ratio: $300,000 ÷ $60,000 = 5:1
This 5:1 ratio means that for every 1% change in property value, your equity changes by approximately 5% (before accounting for loan paydown and expenses).
How Leverage Differs from Cash Purchases
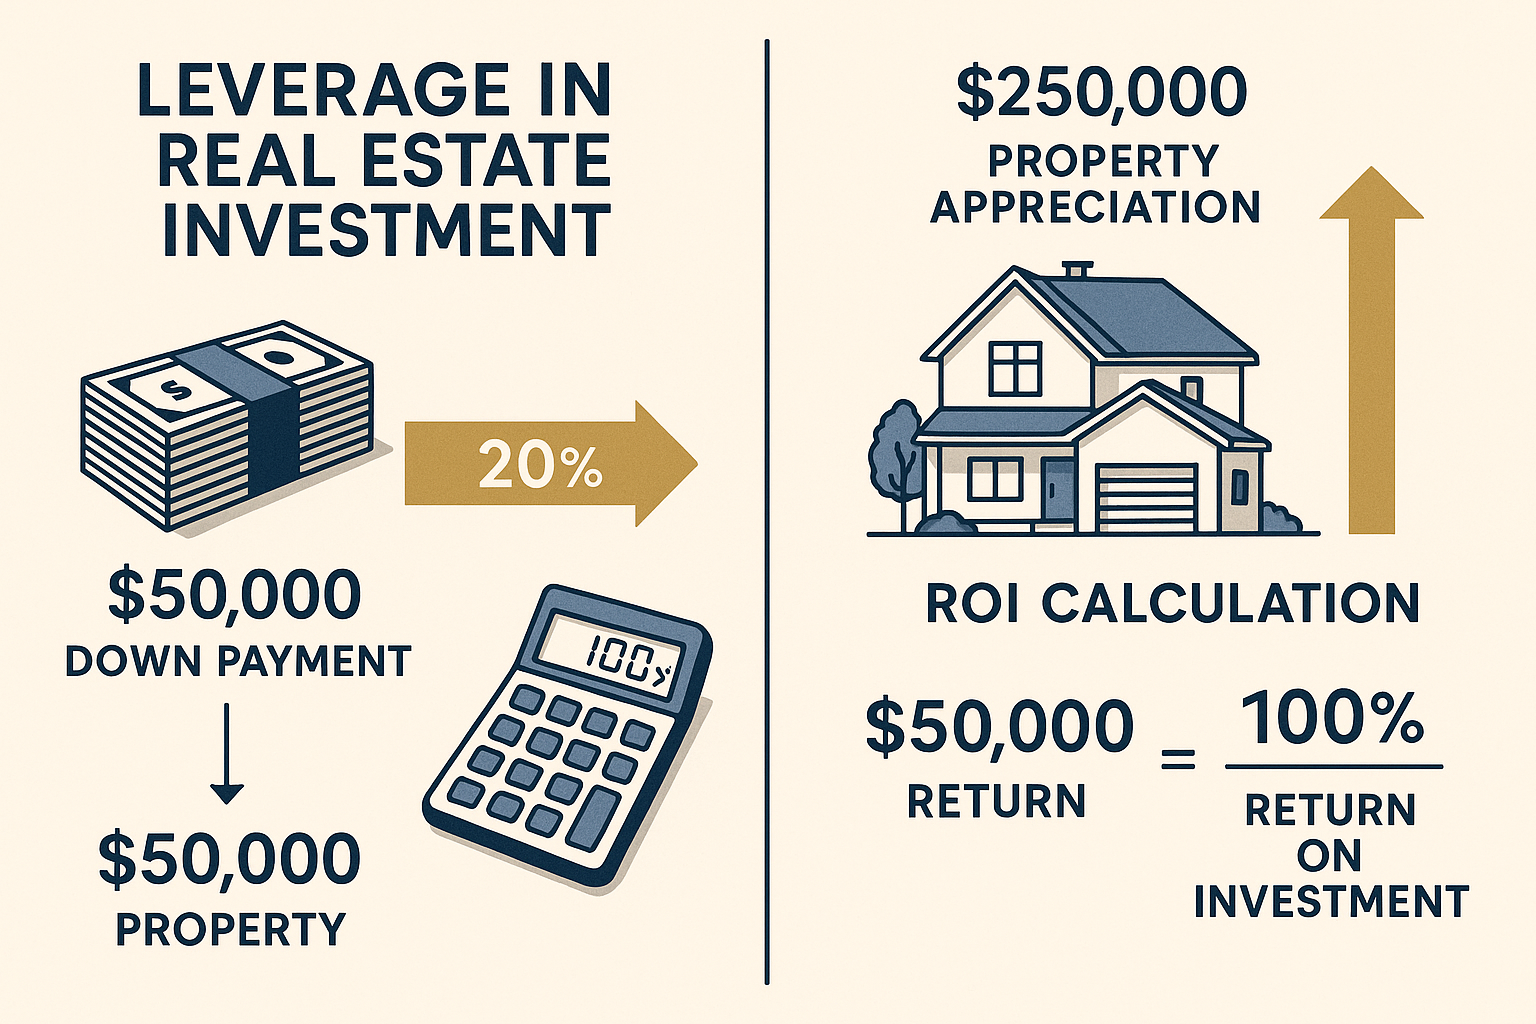
A cash purchase eliminates debt but also eliminates the amplification effect. Consider two investors purchasing identical $250,000 properties:
Investor A (Cash):
- Investment: $250,000
- Property appreciates 20% to $300,000
- Profit: $50,000
- Return on investment: 20%
Investor B (Leverage):
- Down payment: $50,000 (20%)
- Loan: $200,000
- Property appreciates 20% to $300,000
- Equity grows from $50,000 to $100,000
- Return on investment: 100%
Investor B achieved five times the return percentage using the same market appreciation. This mathematical advantage explains why leverage remains central to real estate wealth building, as explored in active vs passive income strategies.
Types of Real Estate Leverage
Traditional Mortgage Leverage: Conventional loans with fixed or adjustable rates, typically requiring 20-25% down payment for investment properties. These offer predictable payments and long-term stability.
High-LTV Leverage: Loans with 90-95% financing, often available for primary residences. While these maximize leverage, they also increase risk exposure and usually require private mortgage insurance (PMI).
Commercial Leverage: Loans for multifamily, retail, or office properties, typically structured with 25-35% down payments and based on property cash flow rather than personal income.
Creative Leverage: Seller financing, lease options, partnerships, and private money that allow investors to control properties with minimal capital. These strategies often involve higher costs but provide access when traditional financing isn’t available.
How Leverage in Real Estate Works: The Mechanics
Understanding how leverage functions requires examining the relationship between debt, equity, and returns. The mechanics involve several interconnected components that determine whether leverage enhances or diminishes investment performance.
The Loan-to-Value (LTV) Ratio
The LTV ratio represents the loan amount as a percentage of the property’s appraised value:
LTV = (Loan Amount ÷ Property Value) × 100
Example:
- Property value: $400,000
- Loan amount: $320,000
- LTV: ($320,000 ÷ $400,000) × 100 = 80%
Lenders use LTV to assess risk. Higher LTV ratios indicate less borrower equity and greater lender exposure. Most conventional investment property loans cap LTV at 75-80%, while primary residence loans may reach 95-97% LTV.
The inverse of LTV is the equity percentage. An 80% LTV means 20% equity. This equity serves as your margin of safety—the cushion protecting you from market downturns.
Cash-on-Cash Return: Measuring Leverage Efficiency
The cash-on-cash return metric reveals whether leverage actually improves investment performance by comparing annual pre-tax cash flow to total cash invested:
Cash-on-Cash Return = (Annual Pre-Tax Cash Flow ÷ Total Cash Invested) × 100
Total cash invested includes:
- Down payment
- Closing costs
- Renovation expenses
- Initial reserves
Example calculation:
- Property purchase price: $300,000
- Down payment (25%): $75,000
- Closing costs: $5,000
- Total cash invested: $80,000
- Annual rental income: $36,000
- Annual expenses (taxes, insurance, maintenance): $12,000
- Annual mortgage payment: $15,600
- Annual pre-tax cash flow: $36,000 – $12,000 – $15,600 = $8,400
- Cash-on-Cash Return: ($8,400 ÷ $80,000) × 100 = 10.5%
This 10.5% return can be compared against alternative investments to determine if the leveraged real estate position offers superior risk-adjusted returns. Understanding these calculations connects directly to compound interest principles that govern wealth accumulation.
Debt Service Coverage Ratio (DSCR)
The DSCR measures a property’s ability to cover its debt obligations from operating income:
DSCR = Net Operating Income ÷ Annual Debt Service
Lenders typically require DSCR of 1.25 or higher for commercial properties, meaning the property must generate 25% more income than needed to cover loan payments.
Example:
- Annual rental income: $48,000
- Operating expenses: $18,000
- Net operating income (NOI): $30,000
- Annual mortgage payment: $24,000
- DSCR: $30,000 ÷ $24,000 = 1.25
A DSCR below 1.0 indicates negative cash flow—the property doesn’t generate enough income to cover debt payments. This scenario forces investors to subsidize properties from other income sources, creating financial strain.
The Amplification Effect in Action
Leverage amplifies returns through a mathematical multiplier. Consider a property purchased for $500,000 with 20% down ($100,000):
Scenario 1: 10% Appreciation
- New property value: $550,000
- Equity increase: $50,000
- Return on $100,000 investment: 50%
- Unleveraged return would be: 10%
Scenario 2: 10% Depreciation
- New property value: $450,000
- Equity decrease: $50,000
- Loss on $100,000 investment: -50%
- Unleveraged loss would be: -10%
The leverage multiplier works identically in both directions. This symmetry means that while leverage can accelerate wealth building during appreciating markets, it can also accelerate wealth destruction during downturns.
Loan Paydown: The Hidden Return Component
Monthly mortgage payments include both interest and principal. The principal portion increases your equity position automatically, creating a forced savings mechanism.
On a $300,000 loan at 6% over 30 years:
- Monthly payment: $1,799
- First month principal: $299
- First month interest: $1,500
- Year 1 total principal paydown: ~$3,700
This $3,700 equity increase represents an additional return beyond appreciation and cash flow. When calculating total return on leveraged real estate, include:
- Cash flow (rental income minus all expenses)
- Appreciation (market value increase)
- Loan paydown (principal reduction)
- Tax benefits (depreciation deductions)
These four return components create the complete picture of leverage efficiency, similar to how dividend reinvestment compounds returns in equity investments.
The Benefits of Leverage in Real Estate
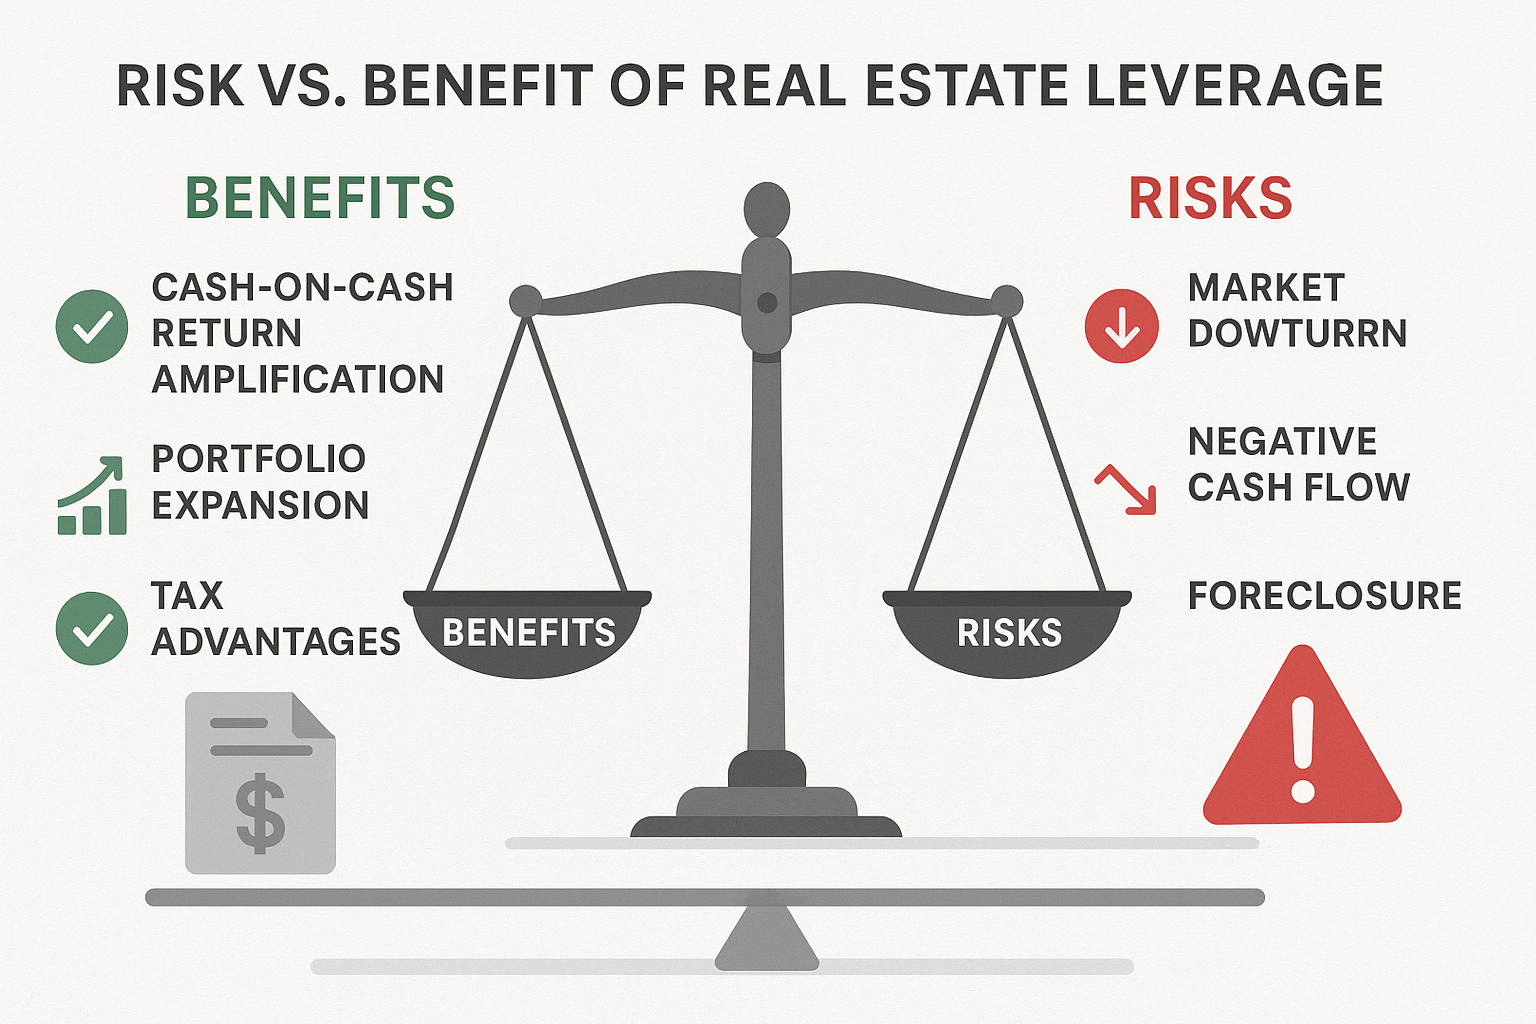
Strategic leverage offers several mathematical and practical advantages that make it the cornerstone of most real estate wealth-building strategies. Understanding these benefits helps investors deploy capital more efficiently.
Amplified Returns on Capital
The primary benefit of leverage is return amplification. By controlling larger assets with smaller capital outlays, investors multiply the impact of market appreciation.
Real-World Example:
An investor with $200,000 faces two options:
Option A: One property, all cash
- Purchase $200,000 property
- 5-year appreciation at 4% annually: $43,297
- Total value: $243,297
- Return: 21.6%
Option B: Four properties, leveraged
- Purchase four $200,000 properties with $50,000 down each
- Total controlled assets: $800,000
- 5-year appreciation at 4% annually: $173,188
- Loan balances after 5 years: ~$576,000
- Total equity: $397,188
- Return on $200,000: 98.6%
The leveraged approach generates 4.5 times more absolute profit and nearly five times the percentage return. This mathematical advantage explains why most wealthy real estate investors use leverage systematically.
Portfolio Diversification and Scale
Leverage enables investors to spread capital across multiple properties rather than concentrating risk in a single asset. This diversification reduces portfolio volatility and increases income stability.
With $150,000 in capital:
Unleveraged approach:
- One $150,000 property
- Single tenant/location risk
- Limited income diversity
Leveraged approach (20% down):
- Three $250,000 properties
- Geographic diversification
- Multiple tenant income streams
- Reduced vacancy impact
If one property experiences vacancy, the leveraged investor loses 33% of the rental income. The unleveraged investor loses 100%. This risk distribution principle mirrors diversification strategies used in stock portfolios.
Superior Cash-on-Cash Returns
Leverage can improve cash-on-cash returns when rental yields exceed borrowing costs. This spread creates positive arbitrage—earning more on borrowed money than the cost of borrowing.
Example Calculation:
Property details:
- Purchase price: $400,000
- Down payment (25%): $100,000
- Loan amount: $300,000 at 6% interest
- Annual rental income: $36,000
- Operating expenses: $14,400
- NOI: $21,600
- Annual debt service: $21,576
- Cash flow: $24
Unleveraged comparison:
- Same property purchased for $400,000 cash
- NOI: $21,600
- Cash-on-cash return: 5.4%
Leveraged scenario:
- Cash invested: $100,000
- Cash flow: $24
- Principal paydown year 1: ~$3,576
- Total first-year return: $3,600
- Cash-on-cash return: 3.6%
In this example, leverage actually reduces cash-on-cash return because the debt service nearly equals NOI. However, when including appreciation and tax benefits, the leveraged position typically outperforms. This demonstrates why comprehensive return analysis matters more than any single metric.
Tax Advantages and Deductions
Leverage creates additional tax benefits through mortgage interest deductions. Interest paid on investment property loans is fully deductible against rental income, reducing taxable income.
Tax Benefit Example:
Leveraged investor:
- Annual mortgage interest: $18,000
- Depreciation deduction: $14,545 (property value ÷ 27.5 years)
- Total deductions: $32,545
- Rental income: $36,000
- Taxable income: $3,455
Cash investor:
- Depreciation deduction: $14,545
- Rental income: $36,000
- Taxable income: $21,455
The leveraged investor reports $18,000 less taxable income, saving approximately $4,500-6,300 annually, depending on tax bracket. Over 30 years, this tax arbitrage has added substantial value to leveraged positions.
These tax advantages work similarly to how capital gains tax strategies can optimize investment returns across different asset classes.
Accelerated Wealth Building Through Compounding
Leverage accelerates the compounding process by allowing investors to acquire additional properties faster. Each property generates cash flow that can fund subsequent down payments, creating a snowball effect.
10-Year Wealth Building Comparison:
Conservative cash investor:
- Year 0: Purchase one $300,000 property
- Save $20,000 annually from other income
- Year 5: Purchase a second $300,000 property
- Year 10: Own two properties worth ~$730,000
Aggressive leveraged investor:
- Year 0: Purchase one $300,000 property (20% down)
- Year 2: Use appreciation equity + savings to purchase second property
- Year 4: Purchase third property
- Year 6: Purchase fourth property
- Year 8: Purchase fifth property
- Year 10: Own five properties worth ~$1,825,000
- Net equity after loans: ~$730,000
Both investors reach similar net worth, but the leveraged investor controls 2.5 times more assets, generates significantly more cash flow, and has greater upside potential. This acceleration effect demonstrates how compound growth principles apply to real estate through strategic leverage.
Inflation Hedge with Fixed-Rate Debt
Fixed-rate mortgages create a unique advantage during inflationary periods. As inflation rises, property values and rents typically increase, while mortgage payments remain constant.
Inflation Scenario (5% annual inflation):
Year 1:
- Property value: $500,000
- Monthly rent: $3,000
- Mortgage payment: $2,400 (fixed)
- Net cash flow: $600
Year 10:
- Property value: $814,447 (inflated)
- Monthly rent: $4,887 (inflated)
- Mortgage payment: $2,400 (still fixed)
- Net cash flow: $2,487
The mortgage payment becomes progressively easier to cover as rents rise with inflation. Meanwhile, the debt is being repaid with inflated dollars worth less in real terms. This creates a triple benefit: appreciating asset values, increasing cash flow, and diminishing real debt burden.
The Risks of Leverage in Real Estate
While leverage amplifies returns, it equally amplifies risks. Understanding these dangers allows investors to structure positions defensively and avoid catastrophic losses. The 2008 financial crisis demonstrated how excessive leverage can destroy wealth rapidly when market conditions deteriorate.
Magnified Losses During Market Downturns
The same mathematical multiplier that amplifies gains during appreciation works identically during depreciation. A modest market decline can eliminate equity in highly leveraged positions.
Crisis Scenario Example:
2007 purchase:
- Property value: $500,000
- Down payment (10%): $50,000
- Loan: $450,000
- LTV: 90%
2009 market decline (30%):
- New property value: $350,000
- Loan balance: $445,000
- Equity position: -$95,000 (underwater)
- Loss on initial investment: -290%
The investor lost nearly three times their initial capital through negative equity. Selling requires bringing $95,000 to closing, and a foreclosure damages credit for years. This demonstrates why conservative LTV ratios provide essential protection during market cycles.
Negative Cash Flow Risk
Properties that don’t generate sufficient income to cover all expenses create negative cash flow. Investors must subsidize these properties from other income sources, creating financial strain that can force distressed sales.
Negative Cash Flow Scenario:
Property details:
- Purchase price: $300,000
- Down payment: $60,000
- Monthly rent: $2,200
- Mortgage payment (90% LTV): $1,800
- Property taxes: $400
- Insurance: $150
- Maintenance reserve: $200
- Property management: $220
- Monthly cash flow: -$570
This property requires $6,840 annually in subsidies. If the investor owns multiple negative cash flow properties or experiences income disruption, the cumulative drain can force liquidation at unfavorable prices.
Maintaining adequate reserves becomes critical, similar to how an emergency fund protects against personal financial shocks.
Interest Rate Risk and Payment Shock
Adjustable-rate mortgages (ARMs) expose investors to interest rate risk. When rates rise, monthly payments increase, potentially converting positive cash flow properties to negative.
ARM Payment Shock Example:
Initial loan terms:
- Loan amount: $400,000
- Initial rate: 3.5% (5-year ARM)
- Initial payment: $1,796
After 5-year adjustment:
- New rate: 6.5% (market rates increased)
- New payment: $2,528
- Monthly increase: $732
- Annual increase: $8,784
If rents haven’t increased proportionally, this payment shock eliminates cash flow and may exceed rental income entirely. Investors using ARMs must model worst-case rate scenarios and ensure properties can sustain payments at maximum allowable rates.
Foreclosure and Credit Damage
When investors cannot meet debt obligations, lenders initiate foreclosure proceedings. This process not only eliminates equity but also damages credit scores for 7+ years, limiting future borrowing capacity.
Foreclosure Consequences:
- Credit score drop: 200-300 points
- Mortgage approval difficulty: 3-7 years
- Higher interest rates on future loans
- Potential deficiency judgments (owing money after foreclosure)
- Tax implications (forgiven debt may be taxable income)
- Emotional and psychological stress
The 2008-2012 foreclosure crisis saw millions of investors lose properties, with cascading effects on personal finances, family stability, and future wealth-building capacity. This historical example underscores the importance of conservative leverage ratios and adequate reserves.
Concentration Risk and Lack of Liquidity
Real estate is inherently illiquid. Unlike stocks that can be sold in seconds, properties may take months to sell, especially during market downturns. Leveraged investors facing financial pressure cannot quickly exit positions without substantial losses.
Liquidity Crisis Scenario:
An investor owns five leveraged properties when unexpected medical expenses require $75,000 immediately. Options include:
- Sell a property: 3-6 month process, may require price reduction, closing costs consume 8-10% of the sale price
- Refinance: 30-60 day process, requires good credit and equity, costs 2-3% of the loan amount
- HELOC: If available, but it adds more debt and monthly payments
- Hard money loan: Available quickly, but at 10-15% interest rates
None provides immediate liquidity without a high cost. This concentration in illiquid assets creates vulnerability during emergencies, highlighting why balanced portfolios include liquid reserves and diverse asset classes as discussed in asset allocation strategies.
Overleveraging and Debt Service Burden
Acquiring too many leveraged properties creates excessive debt service obligations. Even with positive cash flow on each property, the cumulative debt burden can overwhelm investors during vacancy periods or economic downturns.
Overleveraging Example:
Investor portfolio:
- 10 properties valued at $3,000,000 total
- Total loans: $2,400,000 (80% LTV)
- Combined monthly debt service: $18,000
- Combined monthly rental income: $22,000
- Operating expenses: $8,000
- Net monthly cash flow: -$4,000
Despite individual properties showing positive cash flow projections, the aggregate position is negative. A single vacancy or major repair can trigger a financial crisis. This demonstrates why successful investors maintain conservative debt-to-income ratios and avoid overextension.
Real-World Examples of Leverage in Real Estate
Examining concrete scenarios illustrates how leverage works in practice, revealing both successful applications and cautionary tales. These examples demonstrate the principles discussed above in actionable contexts.
Example 1: The Conservative Wealth Builder
Profile: Sarah, a 35-year-old professional with $100,000 saved for real estate investment.
Strategy: Conservative leverage with substantial equity cushion.
Execution:
- Purchases a $250,000 duplex in a stable neighborhood
- Down payment: $62,500 (25%)
- Loan amount: $187,500 at 6.5% for 30 years
- Monthly mortgage payment: $1,185
- Monthly rental income (both units): $2,400
- Monthly expenses (taxes, insurance, maintenance): $600
- Monthly cash flow: $615
5-Year Results:
- Property appreciates to $287,500 (3% annually)
- Loan balance: $176,842
- Equity: $110,658
- Total return: $10,658 equity gain + $36,900 cash flow = $47,558
- ROI: 76% over 5 years (15.2% annually)
- Cash-on-cash return: 11.8% annually
Analysis: Sarah’s conservative 25% down payment provided a safety margin during a minor market correction in year 3. The property maintained positive cash flow throughout, and she used the income to save for a second property down payment. This approach prioritizes stability over maximum leverage, similar to budgeting strategies that emphasize financial security.
Example 2: The Aggressive Investor
Profile: Marcus, a 28-year-old entrepreneur willing to accept higher risk for accelerated growth.
Strategy: Maximum leverage to acquire multiple properties quickly.
Execution:
- Uses $100,000 to purchase four properties at $200,000 each
- Down payment per property: $25,000 (12.5% through creative financing)
- Total controlled assets: $800,000
- Total loans: $700,000
- Combined monthly debt service: $5,250
- Combined monthly rental income: $6,400
- Combined monthly expenses: $1,600
- Monthly cash flow: -$450 (negative)
3-Year Results:
- Properties appreciate to $880,000 (10% total)
- Loan balances: $684,000
- Equity: $196,000
- Total return: $96,000 equity gain – $16,200 subsidies = $79,800
- ROI: 79.8% over 3 years (26.6% annually)
Analysis: Marcus achieved superior returns through aggressive leverage but required $450 monthly in subsidies from his business income. When one property experienced a 4-month vacancy, he faced significant financial stress. His strategy works only with stable supplementary income and high risk tolerance. One market downturn could eliminate his equity.
Example 3: The Overleveraged Collapse
Profile: Jennifer, a 42-year-old investor who expanded too quickly during the 2005-2007 boom.
Strategy: Rapid portfolio growth using stated-income loans and minimal down payments.
Execution (2006-2007):
- Purchased 8 properties totaling $2,400,000
- Average down payment: 5% ($120,000 total)
- Total loans: $2,280,000
- Used adjustable-rate mortgages with low initial rates
- Projected cash flow: $2,000 monthly positive
2008-2010 Crisis:
- Property values declined 35% to $1,560,000
- ARM rates adjusted upward, increasing payments by $3,200 monthly
- Vacancy rates increased from 5% to 25%
- Cash flow turned negative: -$4,800 monthly
- Equity position: -$720,000 (deeply underwater)
Outcome:
- Lost all 8 properties to foreclosure
- Credit score dropped from 740 to 480
- Declared bankruptcy
- Lost initial $120,000 investment plus $86,400 in subsidies paid during the crisis
- Unable to qualify for mortgages for 7 years
Analysis: Jennifer’s story represents thousands of investors who overleveraged during the housing boom. The combination of minimal equity, adjustable-rate loans, and rapid expansion created catastrophic vulnerability when market conditions changed. This cautionary tale demonstrates why conservative leverage ratios and fixed-rate financing provide essential protection.
Example 4: The Strategic Refinancer
Profile: David, a 50-year-old investor who used equity strategically to expand.
Strategy: Build equity through conservative leverage, then refinance to fund additional acquisitions.
Execution:
- 2015: Purchased property for $300,000 with $75,000 down (25%)
- 2020: Property appreciated to $420,000
- Equity position: $195,000 (original $75,000 + $45,000 appreciation + $75,000 loan paydown)
- Refinanced at 80% LTV: New loan of $336,000
- Cash-out: $111,000 (after paying off original loan)
- Used $111,000 for down payments on two additional properties
- Maintained positive cash flow on all three properties
Results:
- Controls $1,200,000 in assets
- Total equity: $240,000
- Annual cash flow from three properties: $18,000
- Created a scalable portfolio without additional capital
Analysis: David’s approach demonstrates how strategic refinancing converts appreciation into acquisition capital while maintaining conservative LTV ratios. This method allows portfolio expansion without overleveraging, combining the benefits of appreciation with disciplined debt management. The strategy mirrors capital allocation principles used by sophisticated investors.
Example 5: The Commercial Leverage Success
Profile: A real estate syndication group pooling investor capital for commercial acquisitions.
Strategy: Use institutional financing for value-add multifamily properties.
Execution:
- Purchased a 100-unit apartment complex for $12,000,000
- Raised $3,600,000 equity from 20 investors (30% down)
- Secured $8,400,000 commercial loan at 5.5% (70% LTV)
- Implemented $1,200,000 renovation program
- Increased rents from $900 to $1,150 per unit
- Improved occupancy from 82% to 95%
3-Year Results:
- Property value increased to $18,500,000 (based on improved NOI)
- Loan balance: $8,100,000
- Equity: $10,400,000
- Total return to investors: $6,800,000 (189% return)
- Annual cash flow distributions: 12% on invested capital
Analysis: Commercial leverage differs from residential through its focus on cash flow and NOI rather than comparable sales. The syndication structure allowed smaller investors to access institutional-quality deals with professional management. The conservative 70% LTV provided safety while the value-add strategy created forced appreciation independent of market conditions.
How to Use Leverage in Real Estate Safely
Strategic leverage requires disciplined frameworks that balance return optimization with risk management. These practical guidelines help investors deploy leverage effectively while maintaining financial stability.
Establish Conservative LTV Ratios
Maintain loan-to-value ratios at or below 75% for investment properties. This 25% equity cushion protects against market fluctuations and maintains positive equity during moderate downturns.
LTV Framework:
- Primary residence: 80-90% LTV acceptable (lower risk due to occupancy stability)
- Single-family rentals: 75-80% LTV maximum
- Small multifamily (2-4 units): 70-75% LTV maximum
- Commercial properties: 65-75% LTV depending on asset quality
- Value-add projects: 60-70% LTV to account for renovation risk
Lower LTV ratios reduce monthly debt service, improve cash flow, and provide equity buffers that prevent foreclosure during temporary market declines.
Maintain Adequate Cash Reserves
Reserve requirements protect against vacancy, repairs, and economic downturns. Successful investors maintain reserves proportional to their portfolio size and leverage level.
Reserve Formula:
- Minimum: 6 months of total debt service + operating expenses per property
- Conservative: 12 months of total obligations
- Aggressive portfolios: 18-24 months due to higher risk exposure
Example Calculation:
- Monthly mortgage: $1,500
- Monthly operating expenses: $600
- Total monthly obligation: $2,100
- Minimum reserve: $12,600 (6 months)
- Conservative reserve: $25,200 (12 months)
These reserves function identically to personal emergency funds, providing financial stability during unexpected challenges.
Stress Test Your Investments
Before acquiring leveraged properties, model worst-case scenarios to ensure survival during adverse conditions.
Stress Test Variables:
- Property value decline: 20-30%
- Vacancy rate: 25-30% (even in single-family)
- Interest rate increase: 2-3% (for ARMs)
- Rent decline: 10-15%
- Major repair expense: $10,000-20,000
- Extended vacancy: 6-12 months
Stress Test Questions:
- Can the property sustain a 20% value decline without going underwater?
- Can you cover 6 months of expenses with no rental income?
- If interest rates rise by 3%, can you still afford payments?
- Do you have access to $20,000 for emergency repairs?
- Can the property survive a 15% rent reduction and remain cash flow positive?
If any answer is “no,” the leverage level exceeds safe parameters for your financial situation.
Prefer Fixed-Rate Financing
Fixed-rate mortgages eliminate interest rate risk and provide payment certainty for the entire loan term. While initial rates may be slightly higher than ARMs, the protection against payment shock justifies the premium.
Fixed vs. ARM Comparison:
Fixed-Rate Benefits:
- Payment certainty for 15-30 years
- Protection against rising interest rates
- Simplified cash flow projections
- Inflation hedge (payments become easier over time)
ARM Risks:
- Payment uncertainty after the adjustment period
- Potential payment shock if rates rise
- Difficult cash flow planning
- Forced sale risk if payments become unaffordable
Use ARMs only when:
- Planning to sell before the adjustment period
- The interest rate environment is declining
- Property cash flow can sustain the maximum allowable rate
- You maintain substantial reserves for payment increases
Focus on Cash Flow, Not Just Appreciation
Appreciation speculation without cash flow creates vulnerability. Properties should generate positive cash flow from day one, ensuring debt service coverage regardless of market conditions.
Cash Flow Priorities:
- Positive cash flow after all expenses: Minimum $100-200 per unit monthly
- DSCR above 1.25: Ensures 25% income buffer above debt service
- Cap rate above interest rate: Property yield should exceed borrowing cost
- Rent-to-price ratio: Monthly rent should equal at least 1% of the purchase price
Example:
- Purchase price: $200,000
- Target monthly rent: $2,000 (1% rule)
- Mortgage payment (75% LTV at 6.5%): $950
- Operating expenses: $600
- Monthly cash flow: $450
- Annual cash flow: $5,400
- Cash-on-cash return: 10.8%
This cash flow focus ensures properties remain sustainable during market cycles, similar to how dividend investing prioritizes income over speculation.
Diversify Across Markets and Property Types
Concentration in a single market or property type amplifies risk. Geographic and asset diversification reduces portfolio volatility.
Diversification Framework:
- Geographic: Invest in 2-3 different markets to reduce regional economic risk
- Property type: Mix of single-family, small multifamily, and commercial assets
- Price point: Vary property values to access different tenant demographics
- Vintage: Combine newer low-maintenance properties with older value-add opportunities
Example Diversified Portfolio:
- Property 1: Single-family home in growing Sun Belt city ($250,000)
- Property 2: Duplex in stable Midwest market ($180,000)
- Property 3: Small multifamily in college town ($400,000)
- Property 4: Commercial retail in hometown ($350,000)
This diversification reduces the impact of any single market downturn, tenant default, or property issue.
Understand Your Debt Obligations Completely
Read and comprehend all loan documents before signing. Key terms that affect leverage risk include:
Critical Loan Terms:
- Prepayment penalties: Fees for early payoff (common in commercial loans)
- Due-on-sale clauses: The Loan becomes due if the property is sold
- Recourse vs. non-recourse: Personal liability for deficiency after foreclosure
- Cross-collateralization: One default triggers default on multiple properties
- Balloon payments: Large payment due on a specific date
- Rate adjustment caps: Maximum rate increase per period (ARMs)
Unfavorable terms can trap investors in properties or create unexpected financial obligations. Professional legal review of loan documents provides essential protection.
Leverage in Real Estate vs Other Investments
Understanding how real estate leverage compares to leverage in other asset classes reveals its unique characteristics and relative advantages.
Real Estate vs. Stock Market Leverage
Real Estate Leverage Characteristics:
- Long-term fixed-rate financing available (15-30 years)
- Lower borrowing costs (6-8% typically)
- Collateralized by a tangible asset
- Forced savings through principal paydown
- Tax-deductible interest
- Inflation hedge with fixed payments
Stock Market Leverage (Margin) Characteristics:
- Short-term variable-rate financing
- Higher borrowing costs (8-12% typically)
- Margin calls during market declines
- No forced savings component
- Interest is not tax-deductible for most investors
- No inflation protection
Risk Comparison:
Real estate leverage allows 75-90% LTV with no margin calls. Stock margin typically limits leverage to 50% and requires immediate cash deposits if portfolio value declines. This makes real estate leverage more stable for long-term wealth building.
However, stock market liquidity provides advantages. Margin positions can be closed in seconds, while real estate requires months to liquidate. This liquidity difference means stock leverage suits short-term tactical positions, while real estate leverage works for long-term strategic holdings.
Real Estate vs Business Leverage
Business Leverage:
- Borrowing to fund operations, inventory, or expansion
- Often uses receivables or inventory as collateral
- Shorter terms (1-5 years typically)
- Higher risk due to business failure rates
- Potential for higher returns
Real Estate Leverage:
- Borrowing to acquire appreciating assets
- Property serves as collateral
- Longer terms (15-30 years)
- Lower risk due to tangible asset backing
- More predictable returns
Business leverage can generate higher returns but carries substantially higher failure risk. According to Bureau of Labor Statistics data, approximately 20% of small businesses fail within the first year, while real estate foreclosure rates typically remain below 2% even during recessions[1].
Leverage Efficiency Across Asset Classes
Leverage Efficiency = (Return on Leveraged Investment – Cost of Borrowing) × Leverage Ratio
Real Estate Example:
- Property return: 8% (appreciation + cash flow + paydown)
- Borrowing cost: 6.5%
- Spread: 1.5%
- Leverage ratio: 4:1 (80% LTV)
- Leverage efficiency: 1.5% × 4 = 6% additional return
Stock Margin Example:
- Stock return: 10%
- Borrowing cost: 9%
- Spread: 1%
- Leverage ratio: 2:1 (50% margin)
- Leverage efficiency: 1% × 2 = 2% additional return
Real estate’s combination of lower borrowing costs, higher allowable leverage, and tax advantages often produces superior leverage efficiency compared to other asset classes for long-term investors.
Common Mistakes to Avoid with Real Estate Leverage
Learning from common errors helps investors avoid costly mistakes that destroy wealth and damage financial stability.
Overleveraging for Maximum Property Count
Mistake: Acquiring as many properties as possible using maximum leverage, prioritizing quantity over quality.
Consequence: Minimal equity cushions, negative cash flow, vulnerability to any market disruption.
Solution: Focus on sustainable leverage ratios (75% LTV or lower) that maintain positive cash flow and equity protection. Quality beats quantity in building durable wealth.
Ignoring Cash Flow in Favor of Appreciation Speculation
Mistake: Purchasing properties with negative cash flow based on appreciation assumptions.
Consequence: Continuous subsidies drain resources, and if appreciation doesn’t materialize, investors face forced sales at losses.
Solution: Require positive cash flow from acquisition. Appreciation should be a bonus, not the investment thesis. This principle aligns with value investing fundamentals that prioritize current income.
Using Adjustable-Rate Mortgages Without Rate Protection
Mistake: Choosing ARMs for lower initial payments without planning for rate adjustments.
Consequence: Payment shock when rates adjust, potentially converting positive cash flow to negative and forcing distressed sales.
Solution: Use fixed-rate financing for long-term holds. If using ARMs, stress test at maximum allowable rates and maintain reserves for payment increases.
Inadequate Due Diligence and Property Analysis
Mistake: Rushing into purchases without thorough inspection, market analysis, and financial modeling.
Consequence: Unexpected repairs, overestimated rents, underestimated expenses, and negative returns.
Solution: Implement systematic due diligence:
- Professional property inspection
- Comparative market rent analysis
- 3-year expense history review
- Neighborhood crime and school data
- Future development research
- Conservative financial modeling
Failing to Maintain Adequate Reserves
Mistake: Deploying all available capital into down payments without maintaining emergency reserves.
Consequence: Unable to handle vacancies, repairs, or economic downturns, leading to forced sales or foreclosures.
Solution: Maintain 6-12 months of total obligations in liquid reserves per property before acquiring additional properties. This financial cushion prevents crisis scenarios.
Ignoring Market Cycles and Timing
Mistake: Purchasing at market peaks using maximum leverage without considering cycle positioning.
Consequence: Immediate negative equity when markets correct, trapped in underwater positions for years.
Solution: Study local market cycles, inventory levels, price-to-rent ratios, and economic indicators. Use more conservative leverage when markets show late-cycle characteristics (rapid appreciation, speculative buying, loose lending standards).
Neglecting Property Management Quality
Mistake: Self-managing properties without expertise or using low-quality management companies to save costs.
Consequence: Poor tenant selection, extended vacancies, maintenance neglect, and reduced property values.
Solution: Invest in quality property management (typically 8-10% of rents). Professional management protects asset value, maintains cash flow, and reduces investor time commitment. The cost is offset by better tenant retention, faster vacancy fills, and proper maintenance.
Real Estate Leverage Calculator
Compare leveraged vs. cash investment returns
Cash Purchase
Leveraged Purchase
💡 Key Insight
Calculate to see your personalized leverage analysis.
Conclusion: Mastering the Math Behind Real Estate Leverage
Leverage in Real Estate represents one of the most powerful wealth-building tools available to investors when used with discipline, knowledge, and respect for risk. The mathematical principles are straightforward: borrowing capital to control assets worth more than your equity creates return amplification through appreciation, cash flow, loan paydown, and tax benefits.
The data demonstrates the power clearly. A conservative investor using 75% LTV can control four times more assets than a cash investor with the same capital. Over 10-20 year periods, this leverage multiplier typically produces 3-5 times more wealth than unleveraged approaches, assuming positive cash flow and moderate appreciation.
However, leverage’s double-edged nature demands equal attention to risk management. The same multiplier that accelerates wealth during appreciating markets accelerates destruction during downturns. Conservative LTV ratios, adequate reserves, fixed-rate financing, and cash flow focus separate successful leveraged investors from those who overextend and fail.
Actionable Next Steps
For beginner investors:
- Build foundational knowledge: Study local markets, property analysis, and financing options before acquiring properties
- Establish financial stability: Create emergency reserves covering 6-12 months of personal expenses before investing
- Start conservatively: First property should use 25% down payment, fixed-rate financing, and generate positive cash flow from day one
- Focus on education: Learn property management, tenant screening, and maintenance before expanding
- Build slowly: Master one property before acquiring the second; quality beats quantity
For intermediate investors:
- Optimize existing portfolio: Refinance high-rate loans, improve cash flow through rent increases or expense reduction
- Analyze leverage efficiency: Calculate cash-on-cash returns and compare against alternative investments
- Diversify strategically: Expand into different markets or property types to reduce concentration risk
- Strengthen systems: Implement professional property management and standardized analysis frameworks
- Plan expansion: Use appreciation equity strategically through cash-out refinancing to fund additional acquisitions
For advanced investors:
- Scale systematically: Develop acquisition criteria and expansion timelines aligned with market conditions
- Optimize capital structure: Mix conventional financing, commercial loans, and private capital for maximum efficiency
- Implement sophisticated strategies: Explore 1031 exchanges, syndications, and value-add repositioning
- Build team: Assemble advisors, including CPAs, attorneys, and experienced property managers
- Give back: Share knowledge with beginning investors to strengthen the real estate investment community
The path to real estate wealth through leverage requires patience, discipline, and continuous learning. Market cycles, conditions change, and opportunities emerge for those who understand the math behind money and apply it consistently.
Success comes not from maximum leverage but from optimal leverage, the level that balances return amplification with sustainable risk. By maintaining conservative LTV ratios, focusing on cash flow, building adequate reserves, and respecting market cycles, investors can harness the power while avoiding its pitfalls.
Real estate leverage isn’t gambling or speculation; it’s applied mathematics. The formulas work predictably when inputs are accurate and assumptions are conservative. Master the calculations, understand the risks, start small, and scale systematically. This evidence-based approach to leveraged real estate investing builds wealth that compounds across decades and generations.
The opportunity exists today. The question is whether you’ll apply the math behind money with the discipline required to succeed.
References
[1] U.S. Bureau of Labor Statistics. (2024). “Business Employment Dynamics.” BLS.gov
[2] Federal Reserve Economic Data. (2025). “Mortgage Delinquency Rates.” FRED Economic Data
[3] National Association of Realtors. (2025). “Investment Property Financing Trends.” NAR Research
[4] Internal Revenue Service. (2025). “Publication 527: Residential Rental Property.” IRS.gov
Author Bio
Max Fonji is a data-driven financial educator and the founder of The Rich Guy Math, where he teaches the mathematical principles behind wealth building, investing, and financial independence. With expertise in real estate analysis, portfolio optimization, and evidence-based investing strategies, Max helps investors understand the cause-and-effect relationships that govern money. His work focuses on translating complex financial concepts into clear, actionable frameworks backed by data and real-world examples.
Educational Disclaimer
This article is provided for educational and informational purposes only and does not constitute financial, investment, tax, or legal advice. Real estate investing involves substantial risk, including potential loss of capital. Leverage amplifies both gains and losses. Past performance does not guarantee future results.
Individual circumstances vary significantly, and strategies discussed may not be suitable for all investors. Before making any investment decisions, consult with qualified financial advisors, tax professionals, and legal counsel who understand your specific situation.
The author and The Rich Guy Math assume no liability for investment decisions made based on information contained in this article. Always conduct thorough due diligence and independent research before investing in real estate or using leverage strategies.
Frequently Asked Questions About Leverage in Real Estate
What is the ideal leverage ratio for real estate investing?
The ideal leverage ratio depends on risk tolerance, market conditions, and investment goals. Conservative investors should maintain 70–75% LTV (25–30% down payment), providing a substantial equity cushion and improved cash flow. Moderate investors can use 75–80% LTV, balancing leverage benefits with reasonable risk. Aggressive investors may use 85–90% LTV, maximizing return potential while accepting higher vulnerability to market fluctuations.
For most investors, 75% LTV represents the optimal balance—providing 4:1 leverage for return amplification while maintaining 25% equity protection against moderate market declines.
How much should I put down on an investment property?
Investment property down payments typically range from 20–30% depending on loan type and lender requirements. Conventional investment property loans require 20–25% down, while portfolio lenders may accept 15–20% for qualified borrowers with strong credit and reserves.
Recommended down payment strategy:
- Minimum: 20% to avoid higher interest rates and stricter terms
- Optimal: 25% for improved cash flow and equity protection
- Conservative: 30–35% for maximum stability and lowest debt service
Larger down payments reduce monthly obligations, improve cash-on-cash returns, and provide greater protection during market downturns. However, they also reduce leverage efficiency and limit portfolio expansion speed.
Can I use leverage to buy real estate with no money down?
While possible, no-money-down strategies carry extreme risk and typically involve creative financing techniques.
No-Money-Down Methods:
- Seller financing: Seller provides the loan, often with higher interest rates
- Lease options: Control property through a lease with a purchase option
- Partnership: Partner provides capital while you provide expertise
- Subject-to purchases: Take over existing mortgage payments
- Hard money + HELOC: Use home equity for down payment
These strategies should be reserved for experienced investors who understand the risks. Most successful real estate investors use conventional financing with substantial down payments, prioritizing sustainability over creative acquisition methods.
What happens if my leveraged property decreases in value?
Property value decline creates negative equity when the loan balance exceeds the property’s market value. This situation, called being “underwater,” has several implications:
Consequences:
- Cannot sell without bringing cash to closing
- Cannot refinance to better terms
- Increased foreclosure risk if unable to maintain payments
- Limited options except continuing to hold
Solutions:
- Continue making payments and wait for market recovery
- Improve the property to force appreciation
- Negotiate a loan modification with the lender
- Strategic default (damages credit severely)
Prevention through conservative leverage ratios (75% LTV or lower) provides an equity cushion that prevents underwater situations during typical market corrections of 10–20%.
How does leverage affect my taxes on real estate investments?
Leverage creates several tax implications.
Tax Benefits:
- Mortgage interest deduction: Fully deductible against rental income
- Larger depreciation base: Higher property values create larger depreciation deductions
- Cash-out refinancing: Tax-free access to equity (not taxable income)
Tax Considerations:
- Debt forgiveness: Forgiven debt in foreclosure or short sale may be taxable income
- Recapture on sale: Depreciation recapture is taxed at 25% when the property sells
- Passive activity limitations: Rental losses may have limited deductibility
Leverage generally improves tax efficiency by creating deductible interest expenses that offset rental income. However, consultation with a tax professional ensures optimal structure for individual situations, similar to how capital gains strategies require personalized planning.
Is real estate leverage riskier than investing in stocks?
Real estate leverage and stock market leverage carry different risk profiles.
Real Estate Leverage Risks:
- Illiquidity (months to sell)
- Concentration risk
- Management requirements
- Market cycle sensitivity
- Foreclosure consequences
Real Estate Leverage Advantages:
- No margin calls
- Long-term fixed-rate financing
- Tangible asset backing
- Tax advantages
- Inflation hedge
Stock Market Leverage Risks:
- Margin calls during volatility
- Variable interest rates
- Rapid loss potential
- No tax advantages
- No inflation protection
Stock Market Leverage Advantages:
- Instant liquidity
- Easy diversification
- No management requirements
- Lower transaction costs
Real estate leverage typically carries lower risk for long-term investors due to the absence of margin calls, availability of fixed-rate financing, and tangible asset backing. However, the illiquidity and concentration create different risks that require different management approaches.
Related posts:
 What Is SmartPass? Raptor Digital Hall Pass Explained for K-12 Schools
 What Is the 3x Rent Rule & How to Calculate It (With Examples)
 Portfolio Income: Definition, Examples, Tax Rules, and Strategies
 Bookkeeping vs Accounting: What’s the Difference & Which Do You Need?
 What Is Profitability Analysis & How to Do It: Metrics, Example & Tips
 Emergency Fund vs Savings: What’s the Real Difference and Why It Matters