When a company borrows $1 million to buy $2 million in assets, it’s playing a high-stakes game with mathematics. Leverage ratios measure exactly how much of that game involves borrowed money versus the owner’s own capital, and whether the company can handle the risk.
Understanding leverage ratios isn’t just for Wall Street analysts. These financial metrics reveal the math behind how businesses amplify returns, manage debt, and navigate the thin line between growth and insolvency. For investors evaluating stocks, creditors assessing loan applications, or business owners planning expansion, leverage ratios provide the data-driven insights needed to make rational decisions about risk and capital structure.
This guide breaks down the mechanics of leverage ratios with precision: what they measure, why they matter, how to calculate them, and what the numbers actually mean for wealth building and risk management.
Key Takeaways
- Leverage ratios quantify the relationship between debt and equity, showing how much a company relies on borrowed capital versus owner investment
- Higher leverage amplifies both gains and losses, creating potential for accelerated returns but increased financial risk and bankruptcy probability
- Five primary leverage ratios (debt-to-equity, debt-to-assets, equity multiplier, degree of financial leverage, and interest coverage) each reveal different dimensions of capital structure
- Industry context matters critically; a 2.0 debt-to-equity ratio signals danger in retail but normalcy in utilities or real estate
- Leverage ratios directly impact investment returns and credit risk, making them essential tools for stock analysis, lending decisions, and corporate financial planning
What Are Leverage Ratios? The Foundation of Capital Structure Analysis
Leverage ratios are financial metrics that measure the extent to which a company uses borrowed money (debt) to finance its operations and assets. The term “leverage” comes from the physics principle of using a lever to amplify force. In finance, debt acts as the lever that amplifies both potential returns and potential losses.
At their core, leverage ratios answer a fundamental question: How much of this business is funded by other people’s money?
Every company operates with a mix of two funding sources: equity (money from owners and shareholders) and debt (money borrowed from creditors). This combination forms the company’s capital structure. Leverage ratios quantify this mix with mathematical precision.
Why Leverage Exists: The Math Behind Borrowed Capital
Companies use leverage because debt can be cheaper than equity and can accelerate growth without diluting ownership. Consider this simplified scenario:
Scenario A (No Leverage): You invest $100,000 of your own money in a business that generates a 10% return. You earn $10,000, a 10% return on your equity.
Scenario B (With Leverage): You invest $100,000 of your own money and borrow $400,000 at 5% interest. You now control $500,000 in assets. If those assets generate a 10% return ($50,000), you pay $20,000 in interest and keep $30,000 profit, a 30% return on your $100,000 equity.
This is the power of leverage: using borrowed capital to amplify returns on equity. However, the mathematics work in reverse when returns decline. If assets return only 2% in Scenario B, you generate $10,000 but owe $20,000 in interest, a net loss despite positive asset performance.
This cause-and-effect relationship makes leverage ratios critical for risk management and investment analysis.
The Balance Sheet Connection
Leverage ratios derive from the fundamental balance sheet equation:
Assets = Liabilities + Equity
This accounting identity means every dollar of assets must be financed by either debt (liabilities) or owner investment (equity). Leverage ratios examine the proportions of this equation from multiple angles, revealing how aggressively a company employs borrowed capital.
Companies with high leverage ratios carry more debt in relation to their equity. This amplifies potential returns but increases financial risk, particularly during economic downturns or when interest rates rise.
Insight: Leverage ratios transform balance sheet data into actionable intelligence about financial risk, capital efficiency, and return potential. They’re essential tools for comparing companies within industries and assessing financial stability over time.
The Five Core Types of Leverage Ratios (With Formulas and Interpretation)
Financial analysts use several leverage ratios, each illuminating different aspects of capital structure and debt capacity. Understanding these variations provides a comprehensive view of financial leverage.
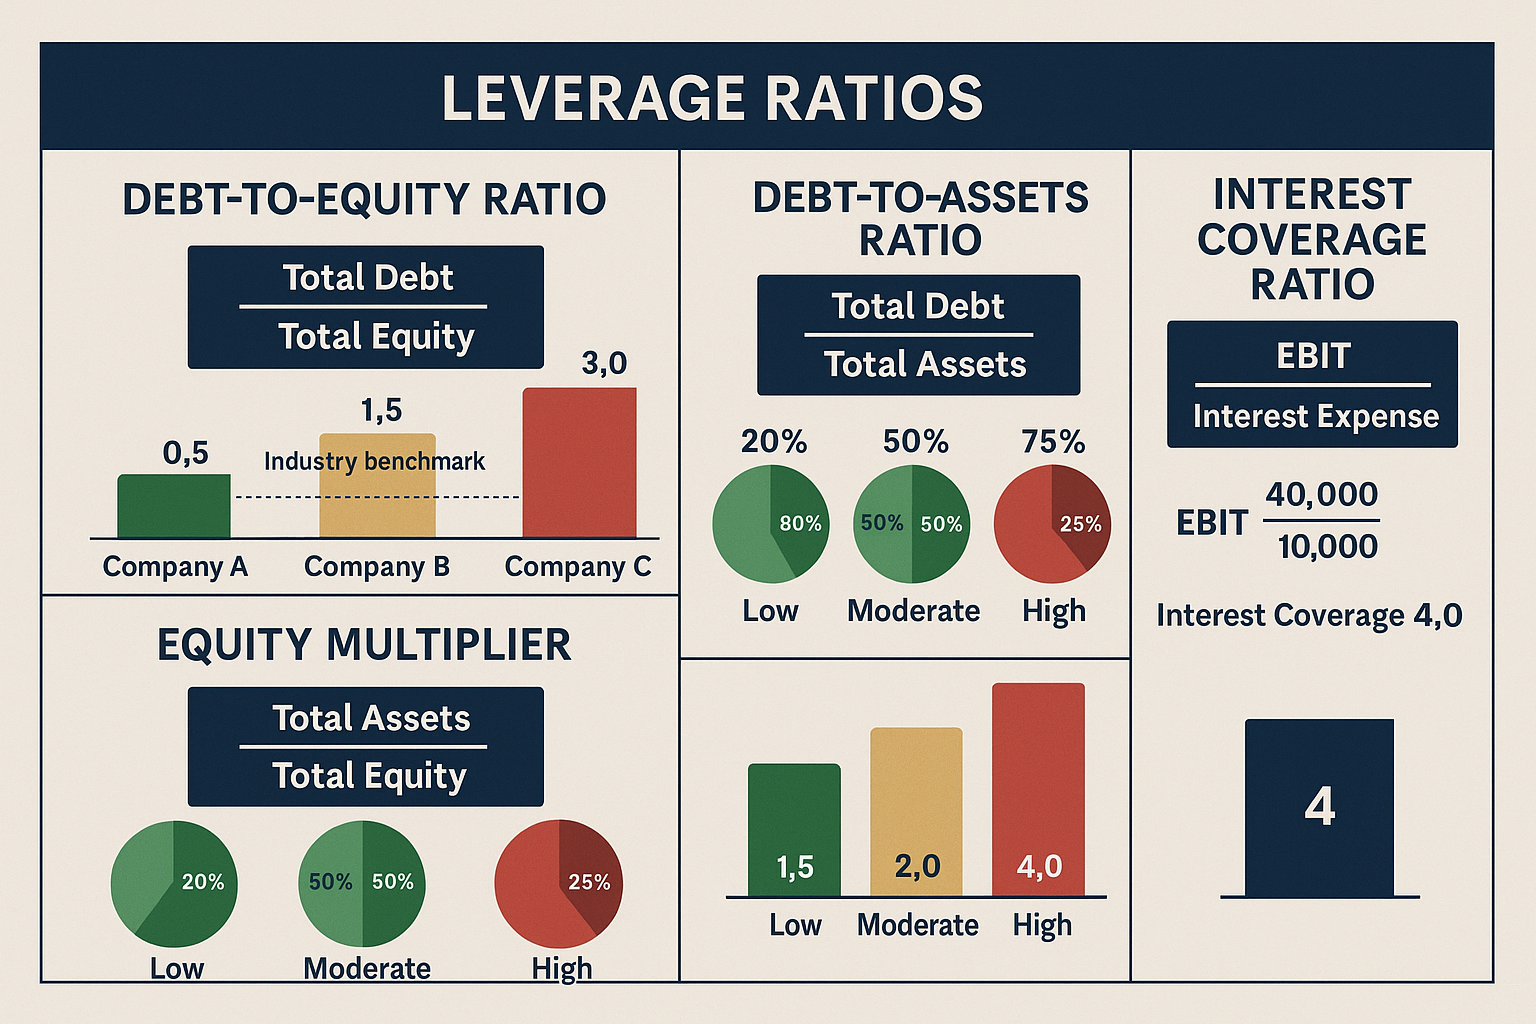
1. Debt-to-Equity Ratio (D/E)
The debt-to-equity ratio directly compares borrowed capital to owner capital, showing how many dollars of debt exist for each dollar of equity.
Formula:
Debt-to-Equity Ratio = Total Debt ÷ Total EquityExample Calculation:
- Total Debt: $3,000,000
- Total Equity: $2,000,000
- D/E Ratio = $3,000,000 ÷ $2,000,000 = 1.5
This means the company has $1.50 of debt for every $1.00 of equity.
Interpretation:
- D/E < 1.0: Conservative capital structure; equity exceeds debt
- D/E = 1.0: Equal debt and equity financing
- D/E > 2.0: Aggressive leverage; debt significantly exceeds equity
- D/E > 3.0: High financial risk; potential distress signals
The debt-to-equity ratio varies dramatically by industry. Capital-intensive sectors like utilities and telecommunications typically operate with D/E ratios above 2.0, while technology companies often maintain ratios below 0.5.
2. Debt-to-Assets Ratio
The debt-to-assets ratio shows what percentage of a company’s assets are financed through debt rather than equity.
Formula:
Debt-to-Assets Ratio = Total Debt ÷ Total AssetsExample Calculation:
- Total Debt: $3,000,000
- Total Assets: $5,000,000
- Debt-to-Assets Ratio = $3,000,000 ÷ $5,000,000 = 0.60 or 60%
This indicates that 60% of the company’s assets are financed with debt, while 40% are financed with equity.
Interpretation:
- < 0.30 (30%): Conservative financing; low leverage
- 0.30-0.60 (30-60%): Moderate leverage; typical for many industries
- > 0.60 (60%): High leverage; increased bankruptcy risk
- > 0.80 (80%): Very high leverage; significant financial vulnerability
This ratio provides a clear picture of asset financing and is particularly useful when comparing companies with different capital structures within the same industry.
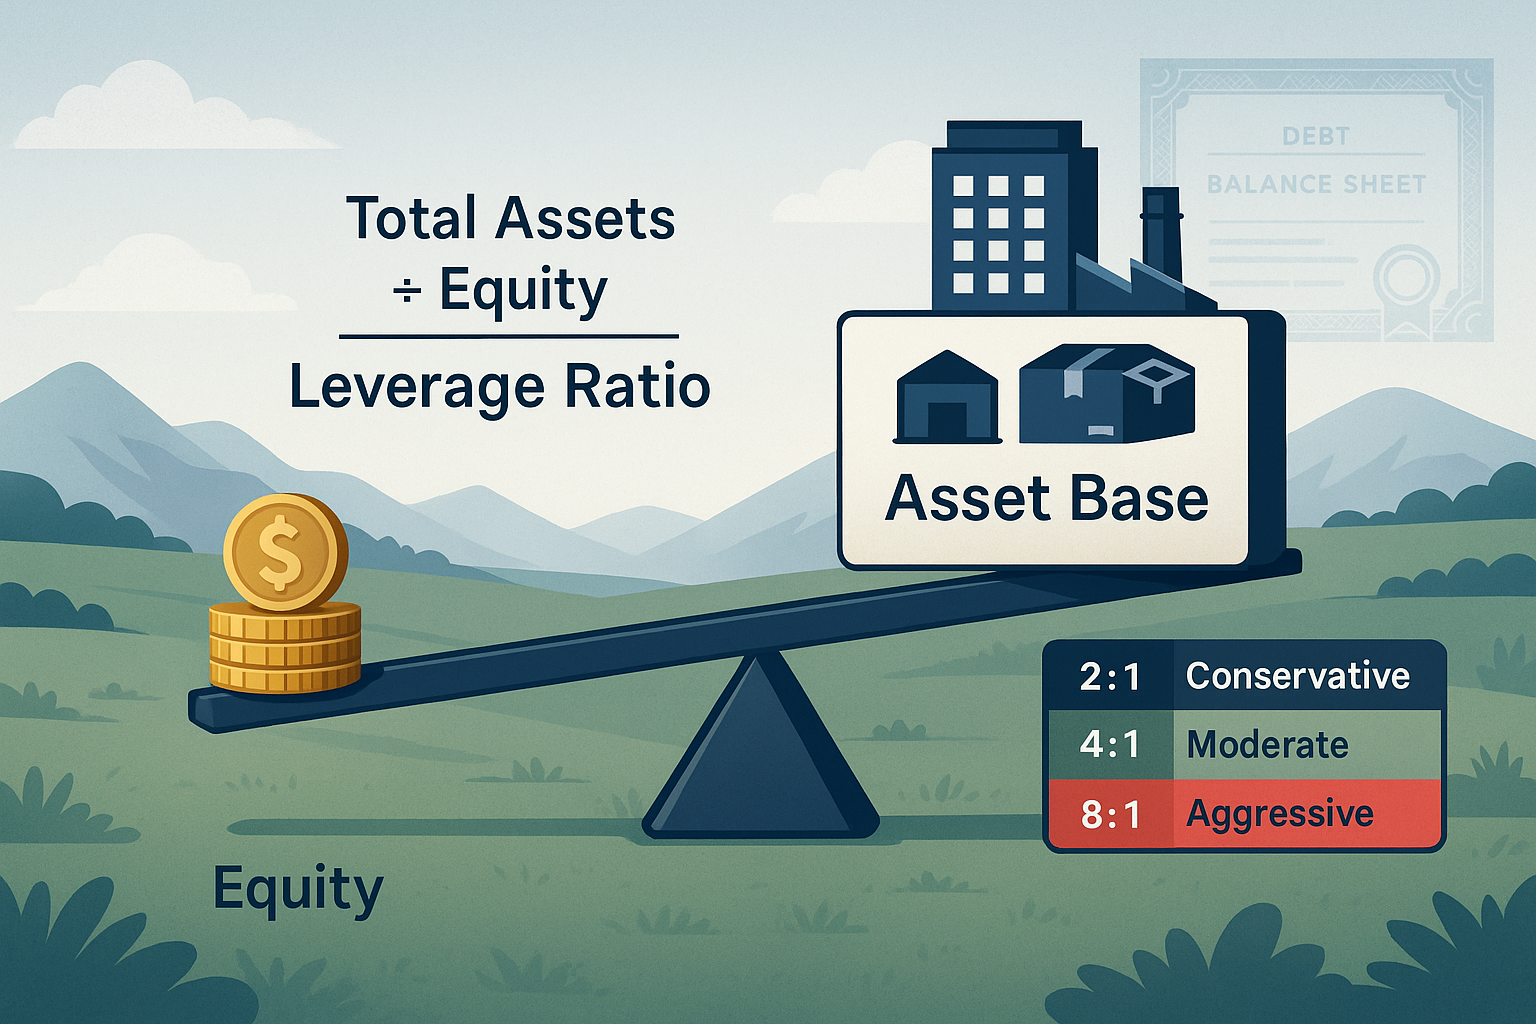
3. Equity Multiplier
The equity multiplier measures total assets relative to equity, showing how many dollars of assets are supported by each dollar of shareholder equity.
Formula:
Equity Multiplier = Total Assets ÷ Total EquityExample Calculation:
- Total Assets: $5,000,000
- Total Equity: $2,000,000
- Equity Multiplier = $5,000,000 ÷ $2,000,000 = 2.5
This means each dollar of equity supports $2.50 in total assets.
Interpretation:
- Multiplier = 1.0: No debt; assets equal equity
- Multiplier = 2.0: Moderate leverage; assets are double equity
- Multiplier > 3.0: High leverage; significant debt financing
- Higher multiplier: Greater potential ROE amplification, but higher risk
The equity multiplier connects directly to return on equity (ROE) through the DuPont analysis framework, showing how leverage amplifies returns to shareholders.
Mathematical Relationship:
Equity Multiplier = 1 + Debt-to-Equity RatioUsing our earlier example: 1 + 1.5 = 2.5 ✓
4. Degree of Financial Leverage (DFL)
The degree of financial leverage measures how sensitive earnings per share (EPS) are to changes in operating income (EBIT). This ratio quantifies earnings volatility created by fixed debt obligations.
Formula:
DFL = % Change in EPS ÷ % Change in EBITOr alternatively:
DFL = EBIT ÷ (EBIT - Interest Expense)Example Calculation:
- EBIT: $500,000
- Interest Expense: $100,000
- DFL = $500,000 ÷ ($500,000 – $100,000) = $500,000 ÷ $400,000 = 1.25
Interpretation:
A DFL of 1.25 means that a 10% change in EBIT produces a 12.5% change in EPS (10% × 1.25). Higher DFL indicates greater earnings volatility and financial risk.
- DFL = 1.0: No financial leverage; no debt
- DFL = 1.5: Moderate leverage; EPS moves 50% more than EBIT
- DFL > 2.0: High leverage; significant earnings amplification and volatility
This metric helps investors understand how accounting profit translates into shareholder returns under different leverage scenarios.
5. Interest Coverage Ratio (Times Interest Earned)
The interest coverage ratio measures how easily a company can pay interest expenses from operating earnings, revealing debt service capacity.
Formula:
Interest Coverage Ratio = EBIT ÷ Interest ExpenseOr using EBITDA for a more conservative measure:
Interest Coverage Ratio = EBITDA ÷ Interest ExpenseExample Calculation:
- EBIT: $500,000
- Interest Expense: $100,000
- Interest Coverage = $500,000 ÷ $100,000 = 5.0x
Interpretation:
- < 1.5x: Danger zone; insufficient earnings to cover interest
- 1.5-2.5x: Adequate but limited cushion
- 2.5-5.0x: Comfortable coverage; moderate risk
- > 5.0x: Strong coverage; low default risk
A ratio of 5.0x means the company earns five times its interest obligations, providing a substantial safety margin. Creditors closely monitor this ratio when assessing loan applications and credit risk.
Understanding how EBITDA relates to debt service capacity helps explain why this metric appears in most loan covenants and credit agreements.
How to Calculate Leverage Ratios: Step-by-Step Process
Calculating leverage ratios requires accurate financial statement data. Here’s the systematic approach:
Step 1: Gather Balance Sheet Data
Extract these key figures from the company’s most recent balance sheet:
- Total Assets: Sum of current and non-current assets
- Total Liabilities (Debt): All short-term and long-term debt obligations
- Total Equity: Shareholder equity, retained earnings, and additional paid-in capital
Some analysts distinguish between interest-bearing debt (bonds, loans) and non-interest-bearing liabilities (accounts payable, deferred revenue). For leverage analysis, focus on interest-bearing debt for a more precise risk assessment.
Step 2: Obtain Income Statement Data
For interest coverage and DFL calculations, extract:
- EBIT: Earnings before interest and taxes (operating income)
- EBITDA: EBIT plus depreciation and amortization
- Interest Expense: Total interest paid on debt
- Net Income: Bottom-line earnings after all expenses
Step 3: Apply the Formulas
Use the formulas outlined above with your gathered data. Ensure consistency in time periods, use annual data for annual analysis or quarterly data for quarterly comparisons.
Step 4: Compare and Contextualize
Raw ratios mean little without context. Compare your calculated ratios to:
- Industry averages: Different sectors have vastly different normal leverage levels
- Historical trends: How has the company’s leverage changed over time?
- Competitor benchmarks: How does leverage compare to direct competitors?
- Credit rating thresholds: What leverage levels correspond to different credit ratings?
Practical Example: Complete Leverage Analysis
Company XYZ Balance Sheet:
- Total Assets: $10,000,000
- Total Debt: $6,000,000
- Total Equity: $4,000,000
Company XYZ Income Statement:
- EBIT: $1,200,000
- Interest Expense: $360,000
- Net Income: $588,000
Calculations:
Debt-to-Equity: $6,000,000 ÷ $4,000,000 = 1.5
Debt-to-Assets: $6,000,000 ÷ $10,000,000 = 0.60 or 60%
Equity Multiplier: $10,000,000 ÷ $4,000,000 = 2.5
Interest Coverage: $1,200,000 ÷ $360,000 = 3.33x
DFL: $1,200,000 ÷ ($1,200,000 – $360,000) = 1.43
Interpretation: Company XYZ operates with moderate-to-high leverage (D/E of 1.5, 60% debt financing). Interest coverage of 3.33x provides a reasonable safety margin but isn’t exceptionally strong. The DFL of 1.43 means earnings volatility is amplified by 43% due to financial leverage.
This analysis integrates with broader financial ratios to form a complete picture of financial health and investment quality.
Industry Benchmarks: Context Matters for Leverage Ratios
A debt-to-equity ratio of 2.0 tells dramatically different stories depending on industry context. Understanding sector-specific norms is essential for accurate interpretation.
Capital-Intensive Industries (High Normal Leverage)
Utilities, Telecommunications, Real Estate:
- Typical D/E Ratios: 1.5 – 3.0+
- Typical Debt-to-Assets: 50-70%
- Reason: Stable, predictable cash flows support higher debt levels; significant infrastructure investments require substantial capital
These industries generate consistent revenues with limited cyclicality, making debt service predictable and manageable. Regulated utilities often operate with D/E ratios above 2.5 without raising red flags.
Manufacturing and Industrial (Moderate Leverage)
Automotive, Chemicals, Industrials:
- Typical D/E Ratios: 0.8 – 2.0
- Typical Debt-to-Assets: 40-60%
- Reason: Moderate capital requirements balanced with cyclical revenue patterns
These sectors require significant fixed assets but face more economic sensitivity than utilities, necessitating moderate leverage to maintain flexibility during downturns.
Technology and Software (Low Leverage)
Software, Internet, Biotechnology:
- Typical D/E Ratios: 0.0 – 0.5
- Typical Debt-to-Assets: 0-30%
- Reason: Asset-light business models, high growth volatility, preference for equity financing
Technology companies often operate with minimal debt, relying instead on equity capital and retained earnings. Their intangible assets (intellectual property, human capital) don’t collateralize debt effectively, and rapid growth creates uncertainty that makes fixed debt obligations risky.
Financial Services (Unique Leverage Characteristics)
Banks, Insurance, Investment Firms:
- Typical D/E Ratios: 5.0 – 15.0+
- Typical Debt-to-Assets: 85-95%
- Reason: Leverage is the business model; deposits and borrowed funds are inventory
Financial institutions operate with leverage ratios that would signal extreme distress in other industries. Banks borrow at low rates (through deposits and wholesale funding) and lend at higher rates; leverage is their profit mechanism, not a financing choice. Regulatory capital requirements, not traditional leverage ratios, govern their safety.
Retail and Consumer (Variable Leverage)
Retail, Restaurants, Consumer Goods:
- Typical D/E Ratios: 0.5 – 1.5
- Typical Debt-to-Assets: 30-50%
- Reason: Moderate capital needs with significant revenue cyclicality
Retail leverage varies widely based on business model. E-commerce companies operate with lower leverage than brick-and-mortar retailers with extensive real estate holdings.
Data Point: According to NYU Stern’s 2025 industry data, the median debt-to-equity ratio across all industries is approximately 0.86, but sector medians range from 0.00 (internet software) to 3.24 (utilities).
Understanding these benchmarks prevents misinterpretation. A technology company with a 1.0 D/E ratio carries significantly more risk than a utility with the same metric.
The Relationship Between Leverage Ratios and Investment Returns
Leverage creates a mathematical amplification effect on returns, both positive and negative. Understanding this relationship is fundamental to wealth building and risk assessment.
Return on Equity (ROE) Amplification
The DuPont formula decomposes ROE into three components:
ROE = Net Profit Margin × Asset Turnover × Equity MultiplierThe equity multiplier (a leverage ratio) directly amplifies Return On Equity. Two companies with identical profit margins and asset efficiency can generate vastly different ROEs based solely on leverage.
Example:
Company A (Low Leverage):
- Net Margin: 10%
- Asset Turnover: 1.0x
- Equity Multiplier: 1.5
- ROE = 10% × 1.0 × 1.5 = 15%
Company B (High Leverage):
- Net Margin: 10%
- Asset Turnover: 1.0x
- Equity Multiplier: 3.0
- ROE = 10% × 1.0 × 3.0 = 30%
Company B generates double the ROE purely through financial leverage, assuming identical operational performance. This explains why leveraged companies can deliver superior returns during growth periods.
The Downside: Amplified Losses
The mathematics work identically in reverse. When returns decline, leverage amplifies losses with brutal efficiency.
Consider a company with 3:1 leverage (75% debt financing). If asset values decline 10%, equity value declines 40%:
- Assets: $1,000,000 → $900,000 (-10%)
- Debt: $750,000 (unchanged)
- Equity: $250,000 → $150,000 (-40%)
This 4:1 amplification ratio explains why highly leveraged companies face bankruptcy risk during recessions while unleveraged competitors survive.
Interest Rate Sensitivity
Leverage ratios determine interest rate sensitivity. Companies with high debt-to-equity ratios face significant profit pressure when rates rise, as interest expenses consume larger portions of operating income.
Example:
- EBIT: $1,000,000
- Debt: $10,000,000
- Interest Rate: 5% → Interest Expense: $500,000
- EBT (Earnings Before Tax): $500,000
If interest rates rise to 7%:
- Interest Expense: $700,000
- EBT: $300,000 (-40% decline)
A 2-percentage-point rate increase causes a 40% decline in profit, solely due to the effect of leverage. Companies with low leverage experience minimal impact from the same rate movement.
This cause-and-effect relationship makes leverage ratios critical for assessing vulnerability to Federal Reserve policy changes and macroeconomic conditions.
Optimal Leverage: The Trade-Off Theory
Financial theory suggests an optimal capital structure balances the tax benefits of debt (interest is tax-deductible) against bankruptcy costs and financial distress.
Benefits of Leverage:
- Tax shield from interest deductibility
- Lower cost of capital (debt is cheaper than equity)
- Disciplining effect on management (debt obligations enforce financial discipline)
- No ownership dilution
Costs of Leverage:
- Bankruptcy risk and financial distress costs
- Reduced financial flexibility
- Agency costs between debt holders and equity holders
- Earnings volatility amplification
The optimal leverage ratio varies by company based on cash flow stability, asset tangibility, growth opportunities, and management risk tolerance. Understanding these capital allocation strategies helps explain why companies in the same industry choose different leverage levels.
Leverage Ratios in Credit Analysis and Lending Decisions
Creditors and bond investors use leverage ratios as primary tools for assessing default risk and determining appropriate interest rates.
Credit Rating Implications
Credit rating agencies (Moody’s, S&P, Fitch) incorporate leverage ratios into their rating methodologies. Higher leverage generally corresponds to lower credit ratings and higher borrowing costs.
Typical Leverage Thresholds by Credit Rating (Industrial Companies):
| Credit Rating | Debt-to-EBITDA | Interest Coverage | Debt-to-Equity |
|---|---|---|---|
| AAA | < 1.5x | > 12x | < 0.3 |
| AA | 1.5-2.5x | 8-12x | 0.3-0.6 |
| A | 2.5-3.5x | 5-8x | 0.6-1.2 |
| BBB | 3.5-4.5x | 3-5x | 1.2-2.0 |
| BB | 4.5-5.5x | 2-3x | 2.0-3.0 |
| B | > 5.5x | < 2x | > 3.0 |
These thresholds vary by industry and economic conditions but illustrate the inverse relationship between leverage and creditworthiness.
Loan Covenants
Commercial loan agreements typically include leverage-based covenants that restrict borrowers from exceeding specified ratios. Common covenants include:
- Maximum Debt-to-EBITDA: Often 3.0-4.0x for investment-grade borrowers
- Minimum Interest Coverage: Frequently 2.5-3.0x
- Maximum Debt-to-Equity: Varies widely by industry
Violating these covenants triggers technical default, potentially allowing lenders to demand immediate repayment or renegotiate terms at higher rates.
Debt Capacity Analysis
Lenders use leverage ratios to determine how much additional debt a company can safely carry. This analysis considers:
- Current leverage levels relative to industry norms
- Cash flow stability and cyclicality
- Asset quality and collateral value
- Interest coverage under stress scenarios
- Refinancing risk and debt maturity profile
A company with low current leverage and stable cash flows has greater debt capacity than a highly leveraged competitor with volatile earnings, even if current profitability is similar.
This analysis connects to broader assets vs liabilities management and balance sheet optimization strategies.
Limitations and Considerations When Using Leverage Ratios
While powerful analytical tools, leverage ratios, have important limitations that investors must understand.
Off-Balance-Sheet Obligations
Traditional leverage ratios miss operating leases, pension obligations, and other off-balance-sheet commitments that create debt-like obligations. Post-2019 accounting standards (ASC 842/IFRS 16) require lease capitalization, improving transparency, but other obligations remain hidden.
Adjustment: Analysts often add the present value of operating leases and unfunded pension liabilities to reported debt for a more comprehensive leverage assessment.
Industry-Specific Capital Structures
As discussed earlier, leverage norms vary dramatically by industry. Cross-sector comparisons using leverage ratios produce misleading conclusions without proper context.
Timing and Seasonality
Balance sheet leverage ratios represent a single point in time. Companies with seasonal working capital needs may show artificially high or low leverage depending on the measurement date.
Solution: Use average balance sheet figures or examine leverage across multiple quarters to identify trends rather than snapshots.
Quality of Earnings and Assets
Leverage ratios use book values from financial statements, which may not reflect economic reality. Companies with significant intangible assets, goodwill, or aggressive accounting policies may show misleading leverage metrics.
Considerations:
- Adjust for goodwill and intangibles when calculating tangible leverage
- Examine depreciation policies and asset revaluation practices
- Consider the market value of equity versus book value for market-based leverage ratios
Ignoring Cash Holdings
A company with $100 million in debt and $80 million in cash has vastly different risk than one with $100 million in debt and $5 million in cash, yet gross leverage ratios appear identical.
Solution: Calculate net debt (total debt minus cash and marketable securities) for a more accurate risk assessment.
Net Debt-to-Equity = (Total Debt - Cash) ÷ Total EquityGrowth Stage Considerations
High-growth companies often operate with negative earnings and unconventional capital structures. Traditional leverage ratios may not apply effectively to pre-profitable businesses or those in rapid expansion phases.
For these companies, analysts focus more on liquidity ratios, cash burn rates, and runway calculations than on traditional leverage metrics.
Practical Applications: Using Leverage Ratios for Investment Decisions
Leverage ratios inform multiple investment and financial decisions when applied systematically.
Stock Screening and Selection
Investors can use leverage thresholds to filter investment candidates:
Conservative Strategy:
- Debt-to-Equity < 0.5
- Interest Coverage > 10x
- Focus: Financial stability and downside protection
Balanced Strategy:
- Debt-to-Equity: 0.5-1.5
- Interest Coverage: 4-10x
- Focus: Moderate growth with manageable risk
Aggressive/Value Strategy:
- Debt-to-Equity: 1.5-3.0
- Interest Coverage: 2-4x
- Focus: Turnaround situations or cyclical recovery plays
Combining leverage screens with dividend investing criteria creates powerful stock selection frameworks.
Risk Assessment in Portfolio Construction
Understanding portfolio companies’ leverage profiles helps investors assess overall portfolio risk and potential volatility during market downturns.
High-leverage portfolio characteristics:
- Greater sensitivity to economic cycles
- Higher beta and volatility
- Superior returns in bull markets
- Severe drawdowns in recessions
Low-leverage portfolio characteristics:
- More stable returns through cycles
- Lower volatility and beta
- Better downside protection
- Potentially lower peak returns
Diversification strategies should consider leveraging diversity alongside sector and geographic diversification.
Bond and Fixed Income Analysis
For bond investors, leverage ratios directly impact default risk and appropriate yield requirements.
Investment Process:
- Calculate current leverage ratios
- Compare to industry benchmarks and rating agency thresholds
- Stress test interest coverage under recession scenarios
- Assess debt maturity profile and refinancing risk
- Determine appropriate credit spread and yield requirement
Higher leverage demands higher yields to compensate for increased default probability, a fundamental risk-return relationship in fixed income investing.
Business Valuation Adjustments
Leverage affects business valuation through multiple channels:
Cost of Capital: Higher leverage increases the weighted average cost of capital (WACC) through a higher cost of equity (increased financial risk) despite a lower cost of debt.
Terminal Value: Highly leveraged companies may warrant lower terminal value multiples due to sustainability concerns.
Comparables Adjustment: When using comparable company analysis, adjust for leverage differences through enterprise value metrics rather than equity value multiples.
Understanding how leverage impacts enterprise value and equity value separately prevents valuation errors.
How Companies Manage and Optimize Their Leverage Ratios
Corporate financial management involves actively managing leverage to optimize capital structure and maintain financial flexibility.
Strategic Leverage Decisions
Companies adjust leverage based on:
Growth Stage:
- Startups: Minimal debt, equity-focused
- Growth phase: Moderate debt as cash flows stabilize
- Maturity: Higher leverage as cash flows become predictable
- Decline: Deleveraging to preserve financial stability
Economic Conditions:
- Low interest rates: Opportunistic debt issuance
- High rates: Debt reduction and equity financing
- Recession: Conservative deleveraging
- Expansion: Leverage for growth investments
Strategic Initiatives:
- Acquisitions: Temporary leverage increase
- Share buybacks: Leverage increase through equity reduction
- Major capex: Debt financing for large projects
- Restructuring: Often involves deleveraging
Deleveraging Strategies
When leverage ratios exceed target levels, companies employ several reduction strategies:
- Equity Issuance: Sell new shares to raise capital for debt repayment
- Asset Sales: Divest non-core assets and use proceeds to reduce debt
- Earnings Retention: Suspend dividends and buybacks to accelerate debt paydown
- Debt-for-Equity Swaps: Exchange debt for equity in restructuring situations
- Operating Improvements: Increase cash flow through operational efficiency
Each approach involves trade-offs between dilution, strategic flexibility, and shareholder returns.
Leverage Targeting
Many companies establish target leverage ratios aligned with their industry, business model, and risk tolerance:
Example Target Framework:
- Target Debt-to-EBITDA: 2.5-3.0x
- Operating Range: 2.0-3.5x
- Action Triggers: Delever if exceeds 3.5x; consider opportunistic debt if below 2.0x
This framework provides management with clear guidelines while maintaining flexibility for strategic opportunities.
Understanding these corporate finance decisions helps investors interpret leverage changes and management quality. Companies that maintain leverage discipline through cycles typically generate superior long-term returns than those that over-leverage during expansions.
Real-World Examples: Leverage Ratios Across Different Companies
Examining actual company leverage profiles illustrates how these ratios work in practice.
Example 1: Technology Company (Low Leverage)
Microsoft Corporation (2024 Fiscal Year):
- Total Assets: $512 billion
- Total Debt: $98 billion
- Total Equity: $238 billion
- EBIT: $109 billion
- Interest Expense: $2.5 billion
Leverage Ratios:
- Debt-to-Equity: 0.41
- Debt-to-Assets: 19%
- Equity Multiplier: 2.15
- Interest Coverage: 43.6x
Interpretation: Microsoft operates with minimal leverage despite substantial debt in absolute terms. Massive cash holdings ($111 billion) mean net debt is negative. Interest coverage of 43.6x indicates zero financial distress risk. This conservative capital structure reflects the technology sector’s preference for financial flexibility and the company’s strong cash generation.
Example 2: Utility Company (High Leverage)
Duke Energy Corporation (2024):
- Total Assets: $185 billion
- Total Debt: $85 billion
- Total Equity: $65 billion
- EBIT: $8.5 billion
- Interest Expense: $3.2 billion
Leverage Ratios:
- Debt-to-Equity: 1.31
- Debt-to-Assets: 46%
- Equity Multiplier: 2.85
- Interest Coverage: 2.66x
Interpretation: Duke Energy operates with substantially higher leverage than Microsoft, typical for regulated utilities. Stable, predictable cash flows from regulated electricity sales support this debt load. Interest coverage of 2.66x is adequate but not excessive, reflecting the capital-intensive nature of power generation and transmission infrastructure.
Example 3: Retail Company (Moderate Leverage)
Target Corporation (2024):
- Total Assets: $56 billion
- Total Debt: $18 billion
- Total Equity: $15 billion
- EBIT: $6.2 billion
- Interest Expense: $0.9 billion
Leverage Ratios:
- Debt-to-Equity: 1.20
- Debt-to-Assets: 32%
- Equity Multiplier: 3.73
- Interest Coverage: 6.89x
Interpretation: Target maintains moderate leverage appropriate for a major retailer. The company balances debt financing for store expansion and inventory with financial flexibility to weather retail sector volatility. Strong interest coverage of 6.89x provides a cushion against economic downturns.
Example 4: Financial Institution (Very High Leverage)
JPMorgan Chase (2024):
- Total Assets: $3,875 billion
- Total Debt: $3,500 billion (deposits and borrowings)
- Total Equity: $320 billion
- Net Interest Income: $89 billion
Leverage Ratios:
- Debt-to-Equity: 10.94
- Debt-to-Assets: 90%
- Equity Multiplier: 12.11
Interpretation: JPMorgan operates with leverage ratios that would signal extreme distress in non-financial companies. However, for banks, this is normal, deposits and borrowings are the raw materials of the lending business. Regulatory capital ratios (Tier 1 capital, leverage ratio) provide better risk assessment for financial institutions than traditional leverage metrics.
These examples demonstrate why industry context is essential when interpreting leverage ratios. What signals financial strength in one sector indicates weakness in another.
Leverage Ratios and Economic Cycles: What History Teaches
Leverage ratios behave predictably across economic cycles, creating patterns investors can recognize and anticipate.
Expansion Phase Patterns
During economic expansions:
- Companies increase leverage to fund growth investments
- Debt becomes cheaper as credit spreads narrow
- Equity values rise, mechanically reducing debt-to-equity ratios
- Interest coverage ratios improve as earnings grow
- Financial engineering (buybacks, acquisitions) increases leverage
Investor Implication: Rising leverage during expansions isn’t necessarily concerning if driven by strategic growth investments with positive expected returns. However, leverage increases for financial engineering (buybacks at peak valuations) often precede problems.
Peak and Late-Cycle Dynamics
As expansions mature:
- Leverage ratios reach cyclical highs
- Credit standards deteriorate (covenant-lite loans proliferate)
- Interest coverage ratios remain strong due to peak earnings
- Complacency about leverage risks increases
- Acquisition activity peaks with debt-financed deals
Investor Implication: Late-cycle leverage expansion creates vulnerability. Companies that maintain conservative leverage through expansions typically outperform during subsequent downturns.
Recession and Deleveraging
During recessions:
- Earnings decline, causing interest coverage ratios to plummet
- Asset values fall, increasing debt-to-assets ratios
- Equity values collapse, dramatically increasing debt-to-equity ratios
- Credit markets freeze, preventing refinancing
- Forced deleveraging through distressed asset sales
Investor Implication: Companies entering recessions with high leverage face bankruptcy risk. Those with conservative leverage can acquire distressed assets opportunistically, positioning for recovery.
Recovery Phase
Early in recovery:
- Companies focus on deleveraging and balance sheet repair
- Equity issuance is common
- Leverage ratios improve as earnings recover faster than debt levels
- Credit spreads narrow as default fears recede
Investor Implication: Companies that successfully deleveraged during the recession often generate superior returns in the early recovery as operating leverage and financial leverage both work positively.
Historical Data Point: 2008 Financial Crisis
The 2008 crisis dramatically illustrated leverage risks. Companies with debt-to-equity ratios above 2.0 entering the crisis experienced:
- 60%+ higher bankruptcy rates than low-leverage peers
- 40%+ greater stock price declines
- 5+ years longer to return to pre-crisis valuations
Conversely, companies with debt-to-equity ratios below 0.5 entering 2008:
- Maintained dividend payments through the crisis
- Acquired distressed competitors at attractive prices
- Recovered to new highs 2-3 years faster than high-leverage peers
This historical evidence reinforces leverage’s role in determining investment outcomes during stress periods.
Advanced Leverage Concepts: Beyond the Basic Ratios
Sophisticated investors employ additional leverage-related concepts for deeper analysis.
Operating Leverage vs Financial Leverage
Operating leverage measures fixed costs in the business model, while financial leverage measures debt in the capital structure. Combined, they determine total earnings volatility.
Degree of Combined Leverage (DCL):
DCL = Degree of Operating Leverage × Degree of Financial LeverageCompanies with high operating leverage (airlines, hotels) should maintain lower financial leverage to avoid excessive total risk. Those with low operating leverage (software) can safely employ higher financial leverage.
Market Value vs Book Value Leverage
Traditional leverage ratios use book values from balance sheets. Market value leverage uses market capitalization instead of book equity:
Market Debt-to-Equity = Total Debt ÷ Market CapitalizationDuring bull markets, market leverage appears lower than book leverage (stock prices exceed book values). During bear markets, the reverse occurs. This creates cyclical leverage dynamics independent of actual debt changes.
Contingent Liabilities and Adjusted Leverage
Comprehensive leverage analysis adjusts for:
- Operating lease obligations (now on the balance sheet post-ASC 842)
- Pension and OPEB obligations
- Environmental remediation liabilities
- Litigation reserves
- Guarantees and off-balance-sheet commitments
Adjusted Debt = Reported Debt + PV of Leases + Unfunded Pension Liability + Other Contingent Obligations
This adjusted debt figure provides a more accurate leverage assessment than reported figures alone.
Leverage in Private Equity and LBOs
Leveraged buyouts (LBOs) deliberately employ extreme leverage (often 5-7x EBITDA) to amplify equity returns. Private equity firms target companies with:
- Stable, predictable cash flows to service debt
- Strong market positions and limited disruption risk
- Asset-based loan that can secure debt financing
- Opportunities for operational improvements to increase cash flow
LBO leverage analysis focuses on debt paydown schedules, refinancing risk, and exit multiples rather than traditional leverage ratio thresholds.
Understanding these advanced concepts helps investors analyze complex situations like mergers, restructurings, and private equity transactions.
📊 Leverage Ratio Calculator
Calculate key leverage ratios and assess financial risk
Leverage Ratios for Personal Finance and Individual Investors
While typically applied to corporations, leverage ratio concepts apply equally to personal financial management.
Personal Debt-to-Income Ratio
Lenders use debt-to-income (DTI) ratios to assess individual borrowing capacity:
DTI Ratio = Total Monthly Debt Payments ÷ Gross Monthly IncomeMortgage Lending Standards:
- DTI < 28%: Housing expenses only (front-end ratio)
- DTI < 36%: All debt payments (back-end ratio)
- DTI > 43%: Generally disqualifies for qualified mortgages
This personal leverage metric functions identically to corporate interest coverage ratios—measuring debt service capacity relative to income.
Home Equity and Personal Leverage
Homeownership creates personal leverage through mortgages:
Example:
- Home Value: $500,000
- Mortgage: $400,000
- Equity: $100,000
- Personal Debt-to-Equity: 4.0
This 4:1 leverage amplifies both gains and losses from home price changes. A 10% home value increase generates a 50% equity return ($50,000 gain on $100,000 equity), while a 10% decline causes a 50% equity loss.
Understanding this leverage helps explain why housing market corrections devastate highly leveraged homeowners while benefiting those with substantial equity.
The 3x rent rule and 20-4-10 rule for car buying provide similar frameworks for managing personal leverage across different expense categories.
Investment Account Leverage (Margin)
Margin accounts allow investors to borrow against portfolio value to purchase additional securities, creating investment leverage:
Regulation T Requirements:
- Initial margin: 50% (can borrow up to 50% of the purchase price)
- Maintenance margin: 25% (equity must remain above 25% of market value)
Leverage Calculation:
- Portfolio Value: $100,000
- Margin Loan: $50,000
- Equity: $50,000
- Investment Leverage: 2:1
A 10% market decline on the $150,000 position ($15,000 loss) reduces equity to $35,000, a 30% equity decline from 2:1 leverage amplification.
Margin calls occur when equity falls below maintenance requirements, forcing liquidation at the worst possible time. This mechanism explains why leveraged investors experience catastrophic losses during market crashes.
Personal Leverage Management Principles
Apply corporate leverage concepts to personal finance:
- Maintain emergency reserves equivalent to low corporate cash balances (3-6 months’ expenses)
- Limit debt-to-income to sustainable levels based on income stability
- Avoid leverage for depreciating assets (cars, consumer goods)
- Use leverage strategically for appreciating assets (education, real estate, businesses)
- Monitor interest coverage (debt payments relative to income)
Understanding leverage ratios transforms personal financial decisions from intuition to data-driven analysis, improving outcomes through evidence-based financial planning.
Common Mistakes When Analyzing Leverage Ratios
Even experienced investors make errors when interpreting leverage metrics. Avoiding these pitfalls improves analytical accuracy.
Mistake 1: Ignoring Industry Context
Comparing leverage ratios across different industries without adjustment produces meaningless conclusions. A technology company with a 1.5 D/E ratio carries far more risk than a utility with the same metric.
Solution: Always benchmark against industry peers and sector averages, not absolute thresholds.
Mistake 2: Using Single Point-in-Time Measurements
Balance sheet ratios represent a snapshot on a specific date. Companies with seasonal working capital needs or those that recently completed major transactions show atypical leverage.
Solution: Examine leverage trends over multiple periods (5+ years) and use average balance sheet figures when appropriate.
Mistake 3: Overlooking Cash Balances
Gross debt figures ignore cash holdings that effectively reduce net leverage. A company with $100 million in debt and $80 million in cash has vastly different risk than one with $100 million in debt and $5 million in cash.
Solution: Calculate net debt (debt minus cash) for more accurate risk assessment, particularly for cash-rich technology companies.
Mistake 4: Neglecting Off-Balance-Sheet Obligations
Operating leases (pre-2019), pension obligations, and contingent liabilities create debt-like obligations that traditional ratios miss.
Solution: Adjust reported debt to include the present value of operating leases, unfunded pension liabilities, and other material off-balance-sheet items.
Mistake 5: Focusing Solely on Leverage Ratios
Leverage ratios measure capital structure but don’t assess business quality, competitive position, or management capability. A company can have conservative leverage yet face bankruptcy due to obsolete products or poor execution.
Solution: Integrate leverage analysis with comprehensive fundamental analysis, including competitive positioning, profitability trends, cash flow quality, and management track record.
Mistake 6: Misunderstanding Causation
High leverage doesn’t cause poor performance; it amplifies underlying business results. Excellent businesses with high leverage generate superior returns; poor businesses with high leverage accelerate toward bankruptcy.
Solution: Assess business quality first, then evaluate whether leverage levels are appropriate given operational characteristics and cash flow stability.
Mistake 7: Treating All Debt Equally
Not all debt carries equal risk. Fixed-rate long-term debt differs fundamentally from variable-rate short-term debt. Secured debt backed by tangible assets differs from unsecured subordinated debt.
Solution: Examine debt composition, maturity schedule, interest rate structure, and covenant terms, not just aggregate debt levels.
Understanding these common errors helps investors avoid analytical mistakes that lead to poor investment decisions and unexpected losses.
The Future of Leverage: Trends and Evolving Standards
Leverage analysis continues evolving as business models, accounting standards, and economic conditions change.
Technology and Asset-Light Business Models
The rise of software, the internet, and service businesses creates companies with minimal tangible assets but substantial enterprise value. Traditional leverage ratios designed for manufacturing and industrial companies apply less effectively to these asset-light models.
Emerging Approaches:
- Greater focus on cash flow-based leverage (Debt-to-EBITDA, Debt-to-Free Cash Flow)
- Adjusted metrics that exclude intangible assets and goodwill
- Revenue-based leverage ratios for subscription businesses
Cryptocurrency and Decentralized Finance (DeFi)
Blockchain-based lending protocols create new forms of leverage without traditional financial intermediaries. Smart contract-based collateralization and liquidation mechanisms operate differently from conventional debt structures.
Implications:
- Real-time leverage monitoring and automatic deleveraging
- Over-collateralization requirements (often 150-200%)
- Volatility-driven liquidation cascades during market stress
These emerging leverage mechanisms may influence traditional finance over time.
ESG and Sustainable Finance
Environmental, Social, and Governance (ESG) considerations increasingly influence capital allocation and leverage capacity. Companies with strong ESG profiles often access lower-cost debt, while those with ESG risks face higher borrowing costs or restricted access.
Trend: Green bonds and sustainability-linked loans tie interest rates to ESG performance metrics, creating new relationships between operational characteristics and leverage costs.
Zero Interest Rate Environments
Prolonged periods of near-zero interest rates (2009-2021) encouraged unprecedented leverage accumulation across corporate, government, and household sectors. As rates normalize, highly leveraged entities face significant stress.
2025 Context: With interest rates substantially higher than in the 2010s, leverage capacity has declined. Companies that could comfortably service debt at 2% rates struggle at 6-7% rates, forcing deleveraging across many sectors.
Accounting Standard Evolution
Ongoing changes to accounting standards continue to affect leverage measurement:
- Lease capitalization (ASC 842/IFRS 16) increased reported leverage
- Potential changes to goodwill accounting could affect asset values
- Cryptocurrency accounting standards remain in flux
Investor Implication: Stay current with accounting changes that affect leverage calculation and comparability across time periods.
Private Credit and Alternative Lending
The growth of private credit markets (direct lending, private debt funds) creates leverage outside traditional banking systems. These markets often employ higher leverage ratios and more flexible structures than public debt markets.
Consideration: Private company leverage may not be directly comparable to public company metrics due to different reporting standards and covenant structures.
Understanding these evolving trends helps investors adapt leverage analysis to changing market conditions and business models.
Actionable Framework: Implementing Leverage Analysis in Your Investment Process
Transform leverage ratio knowledge into systematic investment analysis with this practical framework.
Step 1: Establish Screening Criteria
Define leverage thresholds aligned with your risk tolerance and investment strategy:
Conservative Portfolio:
- Maximum D/E: 0.75
- Minimum Interest Coverage: 8x
- Maximum Debt-to-Assets: 40%
Balanced Portfolio:
- Maximum D/E: 1.5
- Minimum Interest Coverage: 4x
- Maximum Debt-to-Assets: 55%
Aggressive/Value Portfolio:
- Maximum D/E: 2.5
- Minimum Interest Coverage: 2.5x
- Maximum Debt-to-Assets: 65%
Adjust these thresholds based on industry characteristics and economic conditions.
Step 2: Calculate Core Ratios
For each investment candidate, calculate:
- Debt-to-Equity Ratio
- Debt-to-Assets Ratio
- Interest Coverage Ratio
- Net Debt (Debt minus Cash)
- Net Debt-to-EBITDA
Use trailing twelve-month (TTM) data for current assessment and five-year averages for trend analysis.
Step 3: Industry Contextualization
Compare calculated ratios to:
- Industry median and quartile ranges
- Direct competitor leverage profiles
- Historical company averages
- Credit rating agency benchmarks
Flag companies with leverage significantly above industry norms for additional scrutiny.
Step 4: Trend Analysis
Examine leverage ratio trends over 5-10 years:
- Improving (declining leverage): Positive signal; deleveraging strengthens financial position
- Stable: Neutral; consistent capital structure management
- Deteriorating (rising leverage): Warning sign; investigate causes (acquisitions, buybacks, declining earnings)
Distinguish between strategic leverage increases (growth investments) and problematic increases (covering operating losses).
Step 5: Stress Testing
Model leverage ratios under adverse scenarios:
- 20% revenue decline
- 30% EBITDA decline
- Interest rate increase of 200 basis points
- Asset value decline of 15%
Calculate resulting leverage ratios and interest coverage. Companies that maintain acceptable ratios under stress scenarios demonstrate resilience.
Step 6: Debt Maturity and Refinancing Risk
Examine debt maturity schedule:
- Percentage maturing within 1 year
- Percentage maturing within 3 years
- Concentration of maturities in specific years
Companies with large near-term maturities face refinancing risk, particularly in rising-rate environments or during credit market stress.
Step 7: Integration with Valuation
Incorporate leverage assessment into valuation:
- Adjust the cost of equity for financial risk
- Apply valuation discounts for excessive leverage
- Consider deleveraging scenarios in sum-of-parts analysis
- Model debt paydown in DCF projections
Higher leverage should result in lower valuation multiples and higher required returns.
Step 8: Portfolio Construction
Build diversified portfolios across leverage profiles:
- Core positions: Low-leverage, high-quality companies (50-60%)
- Growth positions: Moderate-leverage companies with strong fundamentals (30-40%)
- Opportunistic positions: Higher-leverage special situations (0-10%)
This structure provides stability from low-leverage core holdings while allowing selective exposure to leverage-amplified returns.
Step 9: Monitoring and Rebalancing
Establish quarterly monitoring for portfolio holdings:
- Track leverage ratio changes
- Monitor credit rating changes
- Review covenant compliance (for bond holdings)
- Assess refinancing activity and debt issuance
Sell or reduce positions when leverage deteriorates beyond acceptable thresholds or when management demonstrates poor capital allocation discipline.
Step 10: Documentation and Learning
Maintain records of leverage analysis and investment outcomes:
- Document leverage ratios at purchase
- Track subsequent leverage changes
- Analyze the correlation between leverage and returns
- Refine screening criteria based on results
This systematic approach transforms leverage analysis from theoretical knowledge into a practical investment advantage.
Integrating this framework with dollar cost averaging strategies and diversification principles creates a comprehensive, data-driven investment process.
Conclusion: Mastering Leverage Ratios for Smarter Investment Decisions
Leverage ratios provide essential insights into financial risk, capital structure, and return potential, insights that separate informed investors from those making decisions based on incomplete information.
The mathematics are straightforward: companies use borrowed capital to amplify returns on equity. When operations perform well, leverage accelerates wealth creation. When operations falter, leverage accelerates losses and increases bankruptcy probability. This cause-and-effect relationship makes leverage analysis fundamental to risk management and investment success.
Key principles to remember:
Context matters critically. A 2.0 debt-to-equity ratio signals danger in technology but normalcy in utilities. Always benchmark against industry peers and sector characteristics, not absolute thresholds.
Multiple ratios provide complete pictures. Debt-to-equity, debt-to-assets, equity multiplier, interest coverage, and degree of financial leverage each reveal different dimensions of capital structure. Use them together for comprehensive analysis.
Trends matter more than snapshots. Single point-in-time measurements can mislead. Examine leverage evolution over multiple years to identify improving, stable, or deteriorating financial positions.
Business quality determines outcomes. Leverage amplifies underlying business performance; it doesn’t create it. Excellent businesses with moderate leverage outperform mediocre businesses with conservative leverage. Assess operational quality first, then evaluate whether leverage levels are appropriate.
Economic cycles amplify leverage effects. Companies entering recessions with high leverage face disproportionate stress, while those with conservative leverage can opportunistically acquire distressed assets. Position portfolios accordingly based on the economic outlook.
Personal finance follows identical principles. Debt-to-income ratios, home equity leverage, and margin account leverage operate through the same mathematical relationships as corporate leverage. Apply these analytical frameworks to personal financial decisions for better outcomes.
Next Steps: Implementing Your Knowledge
Transform this understanding into action:
- Analyze current holdings: Calculate leverage ratios for every stock in your portfolio using the interactive calculator above
- Establish screening criteria: Define acceptable leverage thresholds aligned with your risk tolerance and investment horizon
- Build systematic processes: Incorporate leverage analysis into your investment checklist and due diligence framework
- Monitor continuously: Track leverage ratio changes quarterly and adjust positions when metrics deteriorate
- Study historical examples: Research how leverage affected company performance during previous recessions to calibrate expectations
Leverage ratios aren’t just academic metrics; they’re practical tools that reveal financial reality beneath marketing narratives and management optimism. Companies with sustainable leverage navigate economic cycles successfully, compound wealth over decades, and reward patient investors. Those with excessive leverage amplify short-term gains but eventually face reckoning during inevitable downturns.
The math behind money doesn’t lie. Leverage ratios quantify risk with precision, enabling data-driven decisions that build wealth through understanding rather than speculation.
Master these metrics, apply them systematically, and watch your investment outcomes improve through the power of evidence-based analysis.
References
[1] Damodaran, A. (2025). “Industry Financial Ratios.” NYU Stern School of Business. Retrieved from pages.stern.nyu.edu
[2] Federal Reserve Bank of St. Louis. (2024). “Corporate Leverage and Financial Stability During the 2008 Financial Crisis.” FRED Economic Data. Retrieved from fred.stlouisfed.org
Author Bio
Max Fonji is the founder of The Rich Guy Math, a financial education platform dedicated to teaching the mathematical principles behind wealth building, investing, and risk management. With a background in financial analysis and data-driven research, Max translates complex financial concepts into clear, actionable insights for investors at all levels. His work focuses on evidence-based strategies, helping readers understand the cause-and-effect relationships that drive investment returns and financial outcomes.
Educational Disclaimer
This article is provided for educational and informational purposes only and does not constitute financial, investment, tax, or legal advice. The information presented represents general principles of leverage analysis and should not be considered personalized recommendations for any specific investment decision.
Leverage ratios are analytical tools that help assess financial risk, but they do not guarantee investment outcomes. All investments carry risk, including potential loss of principal. Past performance does not indicate future results.
Before making investment decisions, conduct comprehensive due diligence, consider your individual financial situation, risk tolerance, and investment objectives, and consult with qualified financial, tax, and legal professionals. The Rich Guy Math and its authors are not registered investment advisors and do not provide personalized investment advice.
Industry benchmarks, examples, and calculations presented are for illustrative purposes. Actual company data changes continuously, and readers should verify current financial information before making investment decisions.
By using this information, you acknowledge that investment decisions are your sole responsibility and that The Rich Guy Math bears no liability for investment outcomes resulting from the application of concepts discussed in this article.
Frequently Asked Questions (FAQ)
What is a good leverage ratio?
A “good” leverage ratio depends entirely on industry context. Technology companies should maintain debt-to-equity ratios below 0.5, while utilities commonly operate at 1.5–2.5 without concern. Generally, debt-to-equity ratios below 1.0, debt-to-assets ratios below 50%, and interest coverage above 5x indicate conservative, low-risk capital structures across most industries. Compare ratios to industry peers rather than absolute thresholds.
How do leverage ratios affect stock prices?
Leverage ratios influence stock prices through multiple channels: higher leverage increases earnings volatility (amplifying both gains and losses), elevates bankruptcy risk (reducing valuation multiples), and raises the cost of equity (lowering the present value of future cash flows). During bull markets, moderate leverage can boost returns and stock prices. During downturns, high leverage causes disproportionate price declines as investors demand higher risk premiums.
What’s the difference between operating leverage and financial leverage?
Operating leverage measures fixed costs in the business model (rent, salaries, equipment) relative to variable costs. Financial leverage measures debt in the capital structure. Operating leverage affects how revenue changes translate into profit changes. Financial leverage affects how profit changes translate into earnings per share changes. Combined, they determine total earnings volatility. Companies with high operating leverage should maintain lower financial leverage to avoid excessive total risk.
Can a company have too little leverage?
Yes. Companies with zero or minimal debt may be underleveraged, missing opportunities to reduce weighted average cost of capital through tax-deductible interest and to amplify returns on equity. Optimal capital structure balances tax benefits and return amplification against bankruptcy costs and financial distress. However, “too little” leverage is far less problematic than excessive leverage—conservative capital structures preserve flexibility and survival during crises.
How often should I check leverage ratios for my investments?
Review leverage ratios quarterly when companies report financial results. Track year-over-year trends to identify improving or deteriorating capital structures. Conduct comprehensive leverage analysis annually as part of portfolio review. Monitor more frequently (monthly) during economic downturns or when companies face industry-specific stress, as leverage ratios can deteriorate rapidly when earnings decline or asset values fall.
Do leverage ratios apply to growth companies with negative earnings?
Traditional leverage ratios work poorly for pre-profitable growth companies. Instead, focus on: (1) cash runway (months of cash divided by monthly burn rate), (2) debt-to-revenue ratios, (3) liquidity ratios (current ratio, quick ratio), and (4) access to additional capital. Many high-growth companies intentionally avoid debt, making leverage analysis less relevant than cash management and funding capacity.
What’s the relationship between leverage ratios and credit ratings?
Credit rating agencies use leverage ratios as primary inputs for rating determinations. Higher leverage corresponds to lower ratings and higher borrowing costs. Rating agencies publish industry-specific leverage thresholds for each rating category. Companies typically manage leverage to maintain target credit ratings, as rating downgrades increase interest expenses and restrict access to capital markets. Investment-grade companies (BBB- and above) generally maintain debt-to-EBITDA below 3.5x and interest coverage above 3x.
How do I adjust leverage ratios for companies with significant cash balances?
Calculate net debt by subtracting cash and marketable securities from total debt. Use net debt in place of gross debt for all leverage ratio calculations. This adjustment is particularly important for technology companies and other cash-rich businesses. Net debt-to-equity and net debt-to-EBITDA provide a more accurate risk assessment than gross measures. However, consider cash accessibility; restricted cash or cash held in foreign subsidiaries may not be available for debt repayment.