When a company borrows money, it doesn’t have to repay for years; that debt shapes its financial future in profound ways. Long-term liabilities represent financial obligations that extend beyond one year, and understanding them is essential for anyone learning the math behind money and building genuine financial literacy.
These obligations appear on every corporate balance sheet and influence everything from stock valuations to bankruptcy risk. Whether analyzing a potential stock investment or evaluating business health, long-term liabilities provide critical insights into how companies finance growth, manage risk, and structure their capital.
This guide breaks down the definition, common examples, and risk implications of long-term liabilities using data-driven insights and clear cause-and-effect relationships. The goal is simple: equip readers with the analytical tools to evaluate solvency, assess financial risk, and make evidence-based investing decisions.
Key Takeaways
- Long-term liabilities are financial obligations due beyond 12 months, including bonds, mortgages, pension obligations, and deferred taxes
- These debts appear in the liabilities section of the balance sheet and directly impact solvency ratios, credit ratings, and investor confidence
- High long-term debt increases financial leverage and risk, especially when cash flows cannot consistently cover interest payments.
- Solvency ratios like debt-to-equity and interest coverage measure a company’s ability to meet long-term obligations and survive economic downturns
- Understanding long-term liabilities is fundamental to risk management and evaluating whether a company can sustain operations during periods of reduced revenue
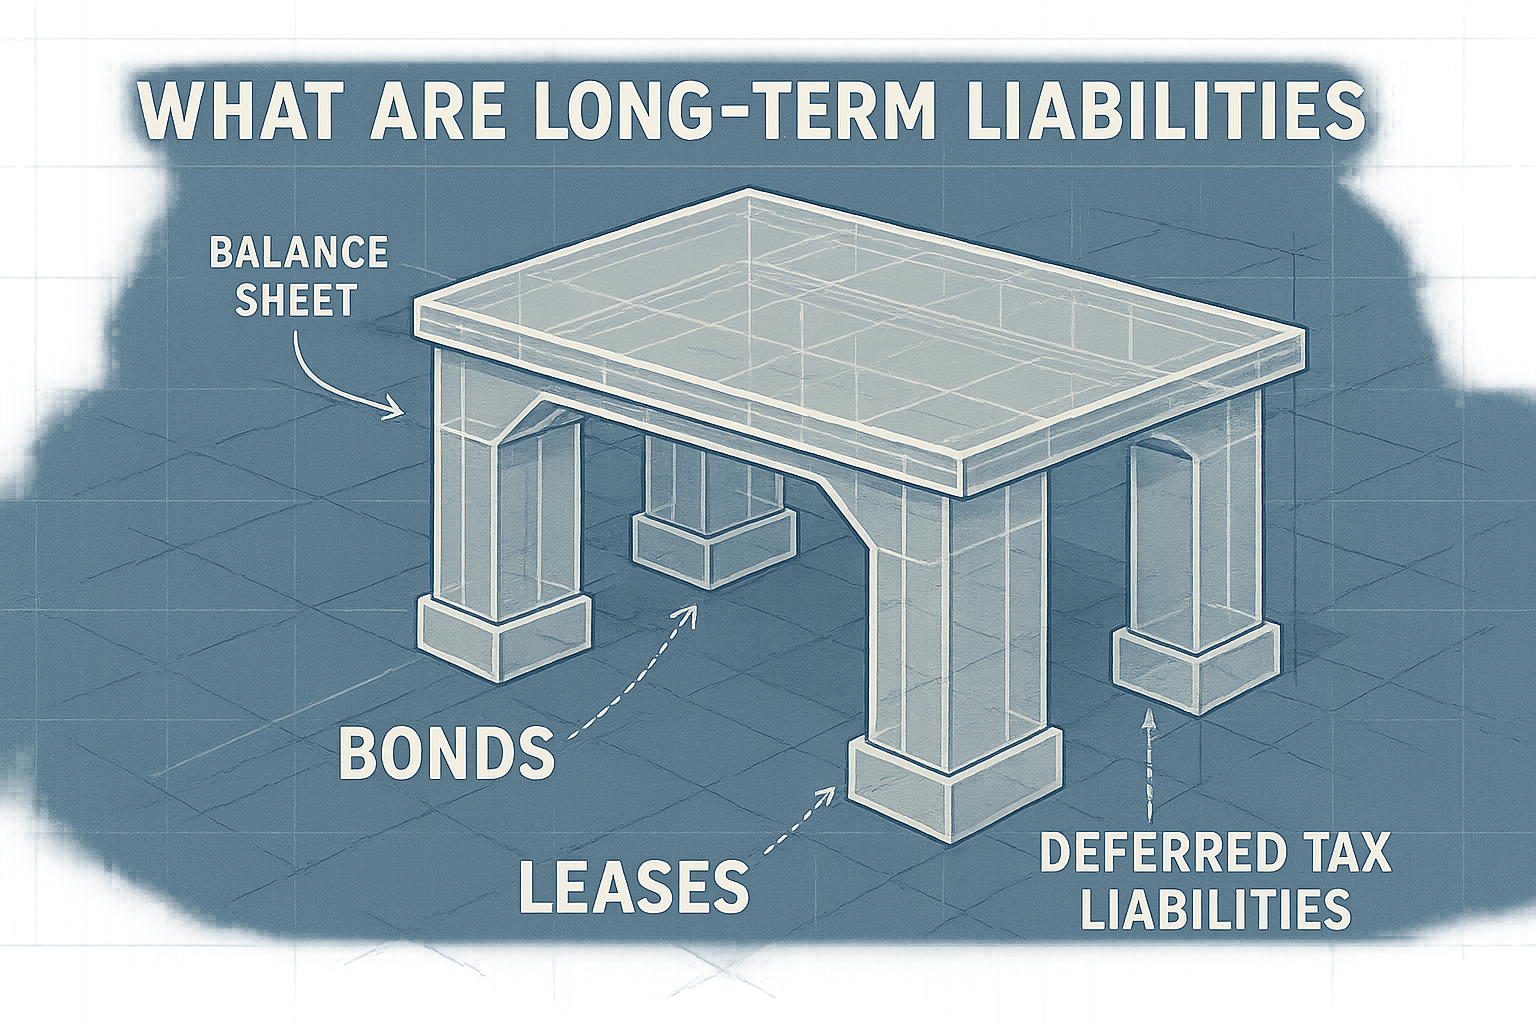
What Are Long-Term Liabilities? (Definition & Core Concepts)
Long-term liabilities are financial obligations that a company or individual does not need to settle within the current operating cycle or fiscal year. By accounting standards, any debt or obligation due more than 12 months from the balance sheet date qualifies as long-term.
These liabilities contrast sharply with current liabilities, which must be paid within one year. The distinction matters because it affects liquidity analysis, working capital calculations, and overall financial health assessment.
The Accounting Framework
On a standard balance sheet, liabilities are divided into two categories:
- Current Liabilities: Due within 12 months (e.g., accounts payable, wages payable, short-term notes)
- Long-Term Liabilities: Due beyond 12 months (e.g., bonds payable, mortgages, pension obligations)
This separation enables analysts to evaluate short-term liquidity separately from long-term solvency. A company might have excellent liquidity ratios but dangerous solvency metrics if long-term debt grows unsustainably.
Why Long-Term Liabilities Exist
Companies use long-term debt for several strategic reasons:
- Capital-intensive investments: Building factories, purchasing equipment, or acquiring other businesses requires more cash than most companies generate annually
- Lower interest rates: Long-term debt often carries lower rates than short-term borrowing because lenders receive interest payments over extended periods
- Tax advantages: Interest payments on debt are tax-deductible, reducing the effective cost of borrowing
- Preserving equity: Issuing debt instead of stock allows existing shareholders to maintain ownership percentages
Takeaway: Long-term liabilities represent a fundamental financing tool that enables growth while creating financial obligations that must be managed carefully to avoid insolvency.
Common Examples of Long-Term Liabilities
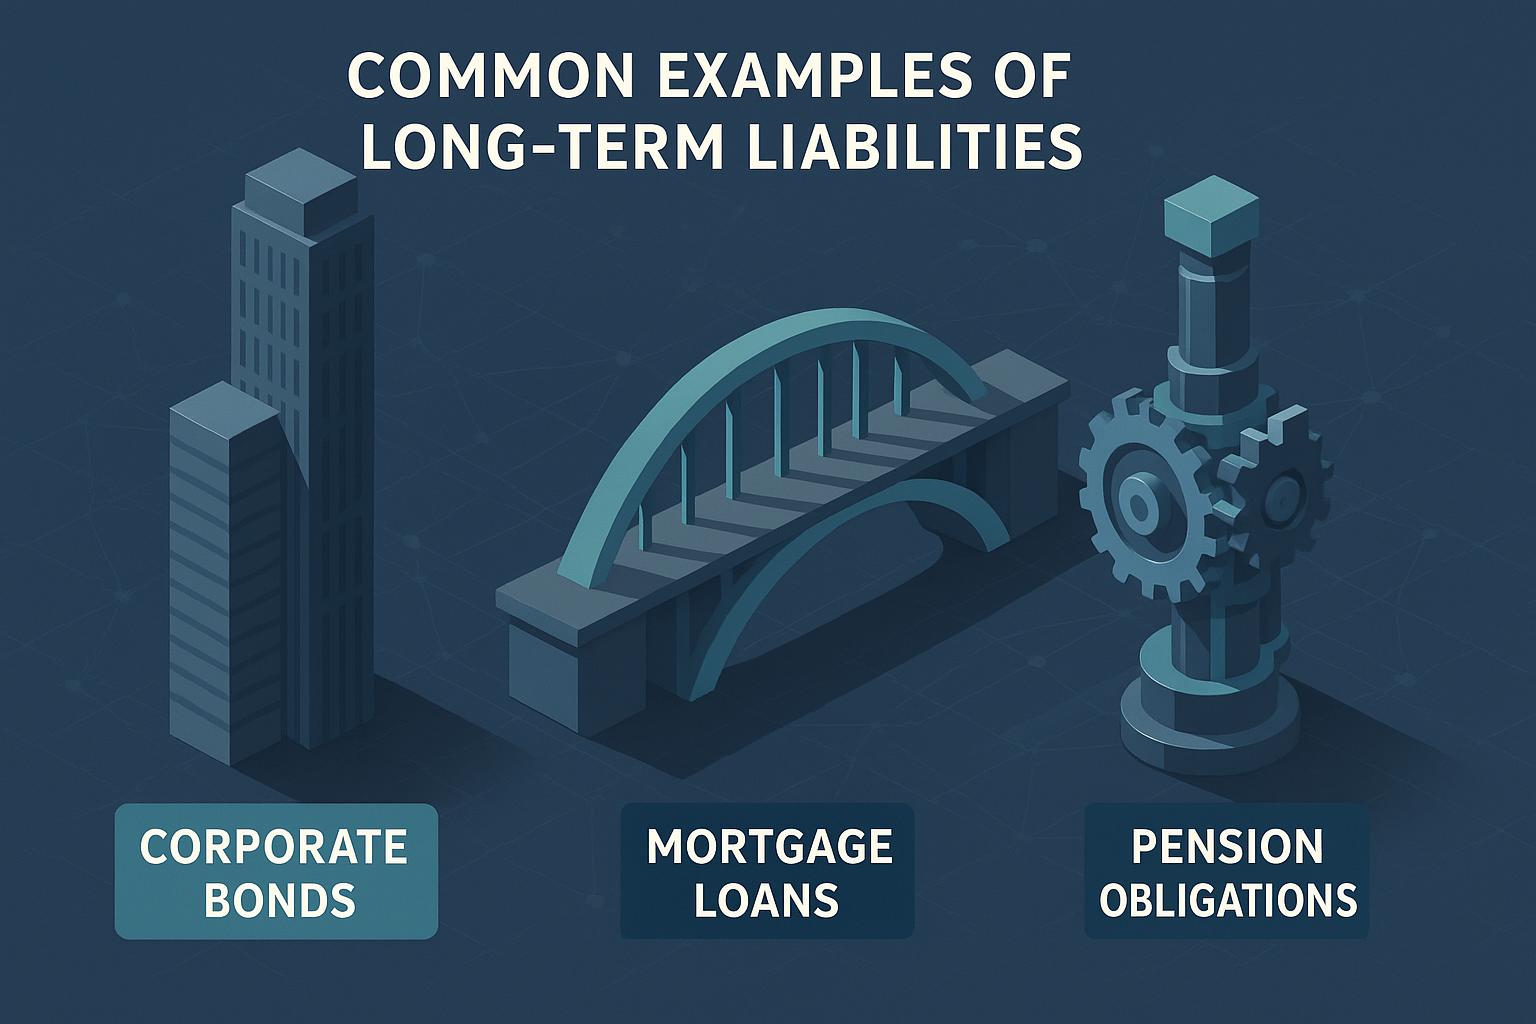
Understanding specific types of long-term liabilities helps investors recognize patterns across industries and evaluate company-specific risks. Each category carries distinct characteristics, repayment structures, and risk profiles.
1. Bonds Payable
Corporate bonds represent loans from investors to companies, typically with maturity periods of 5 to 30 years. The company pays periodic interest (coupon payments) and returns the principal at maturity.
Example: A corporation issues $100 million in 10-year bonds at 5% annual interest. The company pays $5 million annually in interest and owes $100 million when the bonds mature.
Bonds appear as long-term liabilities until the final year before maturity, when they reclassify as current liabilities. Credit rating agencies assess bond risk, with higher-rated bonds (AAA, AA) carrying lower interest rates than speculative-grade bonds (BB, B).
2. Mortgage Loans
Real estate purchases typically require mortgage financing with 15 to 30-year repayment terms. Commercial mortgages fund office buildings, manufacturing facilities, and retail locations.
Example: A retail company secures a $50 million mortgage at 4.5% interest to purchase distribution centers. Monthly payments include both principal and interest, gradually reducing the liability over 25 years.
Mortgages are secured by the underlying property, meaning lenders can seize assets if the borrower defaults. This collateral reduces lender risk and typically results in lower interest rates compared to unsecured debt.
3. Pension Obligations
Companies with defined benefit pension plans promise specific retirement payments to employees. The present value of these future obligations appears as a long-term liability.
Example: A manufacturing company calculates it owes $200 million in present value terms to current and former employees based on salary history and expected lifespans.
Pension liabilities fluctuate based on actuarial assumptions, discount rates, and investment returns on pension assets. Underfunded pensions create significant financial pressure, as companies must contribute additional cash to meet obligations.[3]
4. Deferred Tax Liabilities
When companies use different accounting methods for financial reporting versus tax filing, temporary differences create deferred tax liabilities. These represent future tax payments that will come due when timing differences reverse.
Example: A company uses accelerated depreciation for tax purposes but straight-line depreciation for financial reporting. This creates lower current taxes but higher future tax obligations.
Deferred revenue and deferred taxes both represent timing differences, but deferred taxes specifically relate to tax code complexities rather than customer payments.
5. Long-Term Lease Obligations
Under current accounting standards (ASC 842), operating leases for equipment, vehicles, or property appear as long-term liabilities when lease terms exceed 12 months.
Example: An airline leases aircraft for 10 years. The present value of future lease payments ($500 million) appears as a long-term lease liability.
This accounting change increased reported liabilities for many companies, particularly in the retail, airlines, and logistics industries that rely heavily on leased assets.
6. Convertible Notes
These hybrid securities function as debt initially but can convert into equity shares at predetermined prices. They carry lower interest rates because investors gain potential upside through conversion.
Example: A technology company issues $75 million in convertible notes at 2% interest, convertible to stock at $50 per share. If the stock price exceeds $50, noteholders convert to equity; otherwise, the company repays the debt.
Comparison Table: Long-Term Liability Types
| Liability Type | Typical Duration | Interest Rate Range | Secured/Unsecured | Industry Prevalence |
|---|---|---|---|---|
| Corporate Bonds | 5-30 years | 3-8% | Usually unsecured | All industries |
| Mortgage Loans | 15-30 years | 3-6% | Secured by property | Real estate, retail |
| Pension Obligations | 20-40 years | Varies (actuarial) | Unfunded | Manufacturing, utilities |
| Deferred Taxes | Varies | N/A (tax rate) | N/A | All industries |
| Lease Obligations | 3-15 years | 4-7% (implicit) | Secured by asset | Airlines, retail |
| Convertible Notes | 3-7 years | 1-4% | Usually unsecured | Technology, growth companies |
Insight: Each liability type serves specific strategic purposes. Capital-intensive industries favor mortgages and bonds, while growth companies use convertible notes to minimize interest expense during expansion phases.
Long-Term Liabilities and the Balance Sheet
The balance sheet equation provides the foundation for understanding how long-term liabilities fit into the overall financial structure:
Assets = Liabilities + Shareholders’ Equity
Long-term liabilities appear in the liabilities section, typically listed after current liabilities. The total liabilities figure combines both short-term and long-term obligations.
Balance Sheet Positioning
A simplified balance sheet structure looks like this:
Assets
- Current Assets
- Non-Current Assets (Property, Equipment, Intangibles)
Liabilities
- Current Liabilities
- Long-Term Liabilities ← Focus Area
- Bonds Payable
- Long-Term Debt
- Pension Obligations
- Deferred Tax Liabilities
- Lease Obligations
Shareholders’ Equity
- Common Stock
- Retained Earnings
The Current Portion of Long-Term Debt
As long-term debt approaches maturity, the portion due within 12 months reclassifies from long-term liabilities to current liabilities. This reclassification affects liquidity ratios like the current ratio.
Example: A company has $100 million in bonds maturing in 18 months. At the start of the year, $50 million (the amount due within 12 months) moves to current liabilities, while $50 million remains in long-term liabilities.
This reclassification can suddenly worsen liquidity metrics even though the total debt hasn’t changed. Investors must track debt maturity schedules to anticipate these shifts.
Impact on Financial Ratios
Long-term liabilities directly influence several critical financial metrics:
- Debt-to-Equity Ratio: Total Debt ÷ Shareholders’ Equity
- Debt Ratio: Total Liabilities ÷ Total Assets
- Capitalization Ratio: Long-Term Debt ÷ (Long-Term Debt + Equity)
Higher long-term liabilities increase these ratios, signaling greater financial leverage and risk. While leverage can amplify returns during growth periods, it magnifies losses during downturns.
Practical Application: When analyzing a potential investment, compare the company’s debt ratios to industry benchmarks. A technology company with a debt-to-equity ratio above 1.0 might signal excessive risk, while the same ratio might be normal for a utility company with stable cash flows.
Solvency Analysis: Measuring Long-Term Financial Health
Solvency refers to a company’s ability to meet long-term obligations and continue operations indefinitely. Unlike liquidity (which measures short-term payment capacity), solvency focuses on sustainable financial structure.
Key Solvency Ratios
1. Debt-to-Equity Ratio
This fundamental ratio compares total debt to shareholders’ equity:
Debt-to-Equity Ratio = Total Debt ÷ Shareholders’ Equity
Interpretation:
- < 0.5: Conservative capital structure, low financial risk
- 0.5 – 1.0: Moderate leverage, balanced approach
- 1.0 – 2.0: Aggressive leverage, higher risk
- > 2.0: Potentially dangerous leverage, significant default risk
Example: Company A has $500 million in total debt and $1 billion in equity, yielding a debt-to-equity ratio of 0.5. Company B has $2 billion in debt and $1 billion in equity, yielding a ratio of 2.0. Company B carries four times the financial risk.
The debt-to-equity ratio varies significantly by industry. Capital-intensive sectors like utilities and telecommunications typically operate with higher ratios (1.0-2.0) because stable cash flows support debt service. Technology and service companies usually maintain lower ratios (0.2-0.8).
2. Interest Coverage Ratio
This metric measures how easily a company can pay interest expenses from operating income:
Interest Coverage Ratio = EBITDA ÷ Interest Expense
Interpretation:
- < 1.5x: Distressed, struggling to cover interest
- 1.5 – 2.5x: Vulnerable, limited margin for error
- 2.5 – 5.0x: Adequate coverage, moderate safety
- > 5.0x: Strong coverage, low default risk
Example: A company generates $100 million in EBITDA and pays $20 million in annual interest. The interest coverage ratio is 5.0x, indicating strong debt service capacity.
When interest coverage falls below 2.0x, credit rating agencies often downgrade debt, increasing borrowing costs and creating a negative spiral. Companies with coverage below 1.0x must use cash reserves or additional borrowing to pay interest—an unsustainable situation.
3. Debt Service Coverage Ratio (DSCR)
The debt service coverage ratio expands beyond interest to include principal repayments:
DSCR = Net Operating Income ÷ Total Debt Service
Where total debt service includes both interest and principal payments.
Interpretation:
- < 1.0x: Insufficient cash flow to cover debt obligations
- 1.0 – 1.25x: Minimal coverage, high risk
- 1.25 – 2.0x: Adequate coverage, acceptable risk
- > 2.0x: Strong coverage, low risk
Lenders typically require DSCR above 1.25x for commercial loans. Real estate investors use this metric extensively when evaluating rental property investments.
The Altman Z-Score: Comprehensive Bankruptcy Prediction
The Altman Z-Score combines multiple financial ratios to predict bankruptcy probability. Long-term liabilities heavily influence this calculation through leverage and coverage components.
Z-Score Formula:
Z = 1.2(Working Capital/Total Assets) + 1.4(Retained Earnings/Total Assets) + 3.3(EBIT/Total Assets) + 0.6(Market Value of Equity/Book Value of Liabilities) + 1.0(Sales/Total Assets)
Interpretation:
- Z > 2.99: Safe zone, low bankruptcy risk
- 1.81 < Z < 2.99: Grey zone, moderate risk
- Z < 1.81: Distress zone, high bankruptcy risk
Companies with excessively long-term liabilities typically score poorly on the Z-score because high debt reduces working capital, increases interest expense (lowering EBIT), and decreases equity value relative to liabilities.
Case Study: During the 2008 financial crisis, Lehman Brothers’ Z-Score fell below 1.0 in the quarters preceding bankruptcy. The combination of massive long-term debt, declining asset values, and negative earnings created a perfect storm of insolvency indicators.[4]
Takeaway: Solvency ratios provide early warning signals of financial distress. Investors who monitor these metrics can avoid companies heading toward bankruptcy or restructuring.
Risk Implications of Long-Term Liabilities
Long-term liabilities create several distinct risk categories that investors must understand when evaluating companies or making personal financial decisions.
1. Default Risk
Default occurs when a borrower cannot meet contractual debt obligations. Long-term liabilities increase default risk because:
- Extended time horizons: Economic conditions can deteriorate significantly over 10-30 years
- Cumulative interest burden: Even low interest rates create substantial total payments over decades
- Refinancing requirements: Companies often must refinance maturing debt, which becomes difficult during credit crunches
Example: A company with $500 million in bonds maturing in 2026 faces refinancing risk. If credit markets tighten or the company’s financial condition weakens, refinancing might be impossible or prohibitively expensive.
During the 2020 pandemic, numerous retailers with high long-term debt loads filed bankruptcy (J.Crew, Neiman Marcus, J.C. Penney) because revenue collapse made debt service impossible.[5]
2. Interest Rate Risk
Long-term liabilities with variable interest rates expose companies to rising rate environments. As rates increase, debt service costs rise, reducing profitability and cash flow.
Example: A company has $200 million in variable-rate debt tied to LIBOR + 2%. If LIBOR rises from 1% to 4%, annual interest expense increases from $6 million to $12 million, a $6 million reduction in cash flow.
Fixed-rate debt eliminates interest rate risk but creates opportunity cost if rates decline. Companies must balance these considerations when structuring long-term financing.
3. Operational Inflexibility
High long-term debt creates fixed obligations that must be paid regardless of revenue performance. This reduces management’s flexibility during downturns.
Comparison:
- Low-debt company: Can reduce expenses, cut dividends, and weather revenue declines
- High-debt company: Must maintain debt service even during losses, potentially forcing asset sales or bankruptcy
This inflexibility explains why leveraged companies experience more volatile stock prices. Small changes in revenue create magnified impacts on earnings and cash flow available to equity holders.
4. Covenant Restrictions
Debt agreements typically include covenants, contractual restrictions that limit management actions. Common covenants include:
- Minimum interest coverage requirements
- Maximum debt-to-equity ratios
- Restrictions on additional borrowing
- Limits on dividend payments
- Asset sale restrictions
Violating covenants triggers default, even if the company makes scheduled payments. This gives lenders significant control over company operations.
Example: A company’s debt covenant requires maintaining a debt-to-equity ratio below 1.5. If losses reduce equity, the ratio might exceed 1.5, triggering technical default and allowing lenders to demand immediate repayment.
5. Credit Rating Impact
Credit rating agencies (Moody’s, S&P, Fitch) assess default risk and assign ratings that influence borrowing costs. Higher long-term liabilities typically result in lower credit ratings.
Rating Scale Impact:
- AAA/Aaa: Highest quality, lowest rates (2-3% for investment-grade bonds)
- BBB/Baa: Lowest investment grade (4-5%)
- BB/Ba: Speculative grade (“junk bonds”) (6-8%)
- CCC/Caa or below: High default risk (10%+)
A single-notch downgrade can increase borrowing costs by 0.5-1.0%, creating millions in additional annual interest expense for large companies.
Personal Finance Implications
Individuals face similar risks with personal long-term liabilities:
- Mortgages: Create 15-30 year payment obligations that must be met regardless of income changes
- Student loans: Cannot be discharged in bankruptcy and follow borrowers for decades
- Car loans: Depreciation often exceeds principal reduction, creating negative equity
The 20/4/10 rule for car buying and the 3x rent rule help individuals avoid excessive long-term obligations relative to income.
Risk Management Principle: Long-term liabilities should align with long-term cash flow capacity. Borrowing based on current income without considering recession scenarios creates dangerous vulnerability.
Long-Term Liabilities vs Current Liabilities: Critical Distinctions
Understanding the differences between long-term and current liabilities is essential for comprehensive financial analysis.
Time Horizon
Current Liabilities: Due within 12 months or one operating cycle
Long-Term Liabilities: Due beyond 12 months
This temporal distinction affects how analysts evaluate financial health. Current liabilities measure liquidity pressure, while long-term liabilities measure solvency and capital structure.
Impact on Working Capital
Working capital equals current assets minus current liabilities. Long-term liabilities don’t affect this calculation directly, but their reclassification to current liabilities as maturity approaches can suddenly reduce working capital.
Example: A company has:
- Current Assets: $100 million
- Current Liabilities: $60 million
- Working Capital: $40 million
If $30 million in long-term debt reclassifies to current liabilities, working capital falls to $10 million, a 75% reduction without any change in actual financial position.
Interest Rate Differences
Current liabilities often carry higher interest rates because:
- Lenders face greater administrative costs for short-term lending
- Companies typically use short-term debt for working capital rather than strategic investments
- Credit lines and commercial paper markets price in liquidity premiums
Long-term debt usually offers lower rates because lenders receive extended interest payment streams and can better predict default risk over time.
Strategic Uses
Current Liabilities fund:
- Inventory purchases
- Seasonal working capital needs
- Short-term operational expenses
Long-Term Liabilities fund:
- Capital expenditures (factories, equipment)
- Acquisitions
- Research and development
- Permanent working capital increases
Analytical Framework: Examine both liability categories together. A company with low current liabilities but massive long-term debt might appear liquid today, but face a solvency crisis tomorrow. Conversely, high current liabilities with minimal long-term debt might indicate short-term stress but long-term sustainability.
The relationship between assets and liabilities determines net worth for both companies and individuals. Sustainable wealth building requires acquiring appreciating assets while minimizing liabilities that don’t generate returns.
Managing Long-Term Liabilities: Corporate Strategies
Successful companies actively manage long-term liabilities to optimize capital structure and minimize risk. Several proven strategies exist:
1. Debt Maturity Laddering
Rather than concentrating debt maturities in single years, companies stagger maturities across multiple years. This reduces refinancing risk and smooths cash flow requirements.
Example: Instead of issuing $500 million in 10-year bonds, a company issues:
- $100 million maturing in Year 7
- $100 million maturing in Year 8
- $100 million maturing in Year 9
- $100 million maturing in Year 10
- $100 million maturing in Year 11
This approach ensures the company never faces massive refinancing needs in a single year when credit conditions might be unfavorable.
2. Interest Rate Hedging
Companies use interest rate swaps and other derivatives to convert variable-rate debt to fixed rates (or vice versa) based on rate expectations and risk tolerance.
Example: A company with $200 million in variable-rate debt enters a swap agreement that effectively converts it to a fixed 4.5% rate for five years. This eliminates interest rate risk during the hedge period.
3. Deleveraging
Deleveraging involves reducing total debt levels through debt repayment, asset sales, or equity issuance. Companies often deleverage after acquisitions or during economic uncertainty.
Process:
- Generate excess cash flow from operations
- Allocate cash to debt reduction rather than dividends or buybacks
- Improve debt ratios and credit ratings
- Reduce interest expense and financial risk
Example: After acquiring a competitor using $300 million in debt, a company dedicates 75% of free cash flow to debt repayment for three years, reducing the balance to $150 million.
4. Refinancing at Lower Rates
When interest rates decline or credit ratings improve, companies refinance existing debt at lower rates, reducing interest expense.
Example: A company issued $400 million in bonds at 6% in 2015. In 2020, with rates lower and creditworthiness improved, it issued new bonds at 3.5% and used proceeds to retire the 6% bonds. Annual interest expense falls from $24 million to $14 million.
5. Convertible Debt Strategy
Growth companies use convertible notes to minimize current interest expense while providing investors equity upside. If the company succeeds, the debt converts to equity, eliminating repayment obligations.
Trade-off: Conversion dilutes existing shareholders but eliminates the debt burden. Companies must balance dilution concerns against financial flexibility benefits.
6. Asset-Liability Matching
Companies match long-term asset investments with long-term liability financing. This ensures cash flows from assets align with debt service requirements.
Example: A utility company finances a 30-year power plant with 30-year bonds. As the plant generates revenue over three decades, those cash flows service the debt that funded construction.
Capital Structure Principle: Optimal capital structure balances the tax benefits of debt against bankruptcy costs. The capital structure decision affects company value, cost of capital, and financial flexibility.
Long-Term Liabilities in Investment Analysis
Investors must evaluate long-term liabilities when analyzing stocks, bonds, or entire portfolios. Several analytical approaches provide insights:
Screening for Financial Strength
Conservative Investment Criteria:
- Debt-to-Equity < 0.5
- Interest Coverage > 5.0x
- Debt Service Coverage > 2.0x
- Investment-grade credit rating (BBB+ or higher)
Companies meeting these criteria typically survive recessions and market downturns without financial distress. The best dividend stocks often maintain conservative balance sheets to ensure payment sustainability.
Industry-Specific Benchmarks
Compare companies to industry peers rather than absolute standards:
| Industry | Typical Debt-to-Equity | Typical Interest Coverage |
|---|---|---|
| Technology | 0.2 – 0.5 | 8.0x – 15.0x |
| Consumer Staples | 0.5 – 1.0 | 5.0x – 8.0x |
| Utilities | 1.0 – 2.0 | 3.0x – 5.0x |
| Real Estate | 1.5 – 3.0 | 2.0x – 4.0x |
| Airlines | 1.0 – 2.5 | 2.0x – 4.0x |
A utility with a debt-to-equity ratio of 1.5 might be financially sound, while a technology company with the same ratio faces significant risk.
Trend Analysis
Examine how long-term liabilities change over time:
- Rising debt with rising revenue: Potentially healthy growth financing
- Rising debt with flat revenue: A Warning sign of deteriorating fundamentals
- Declining debt with rising revenue: Strong financial management
- Declining debt with declining revenue: Possible distressed deleveraging
Example: Company A increased long-term debt from $100 million to $300 million over five years while revenue grew from $500 million to $1.2 billion. The debt-funded expansion generated returns. Company B increased debt from $100 million to $300 million while revenue remained flat at $500 million. This signals potential trouble.
Valuation Impact
High long-term liabilities reduce equity value through several mechanisms:
- Interest expense reduces earnings: Lower EPS decreases valuation multiples
- Financial risk increases discount rates: Higher required returns reduce present value
- Bankruptcy probability reduces terminal value: Risk of total loss lowers fair value
When using discounted cash flow analysis, heavily leveraged companies require higher discount rates to reflect financial risk, reducing calculated intrinsic value.
Bond Investment Considerations
For bond investors, long-term liabilities of other creditors affect recovery rates in default scenarios. Senior secured debt holders have priority over subordinated debt holders.
Credit Analysis Framework:
- Calculate total debt and debt service requirements
- Assess cash flow coverage and stability
- Evaluate asset values and collateral
- Determine seniority position in capital structure
- Estimate recovery rate in default scenarios
Risk-Adjusted Return: Higher-yielding bonds from leveraged companies might offer attractive returns, but investors must ensure compensation adequately reflects default risk.
Practical Examples: Long-Term Liabilities in Action
Example 1: Manufacturing Company Expansion
Scenario: A manufacturing company wants to build a $200 million factory expected to generate $40 million in annual EBITDA.
Financing Decision:
- Option A: Issue $200 million in equity (dilutes existing shareholders 20%)
- Option B: Issue $200 million in 20-year bonds at 5% interest
Analysis:
Option A (Equity):
- No debt service requirements
- Existing shareholders own 80% of the increased earnings
- No financial risk increase
- Dilution reduces EPS for current shareholders
Option B (Debt):
- Annual interest: $10 million
- Net cash flow to equity: $30 million ($40M EBITDA – $10M interest)
- Existing shareholders own 100% of the net cash flow
- Interest coverage: 4.0x (adequate but not exceptional)
- Financial risk increases significantly
Outcome: The company chooses debt financing because the project’s return (20% on $200M investment) exceeds the cost of debt (5%), creating value for existing shareholders. However, this decision increases financial leverage and reduces flexibility during potential downturns.
Example 2: Retail Chain Bankruptcy
Scenario: A retail chain has $800 million in long-term debt and generates $100 million in annual EBITDA. Interest expense totals $60 million annually.
Warning Signs:
- Interest coverage: 1.67x (vulnerable)
- Debt-to-EBITDA: 8.0x (excessive)
- Minimal free cash flow after debt service
Economic Shock: A recession reduces EBITDA by 30% to $70 million. Interest coverage falls to 1.17x, and the company cannot cover both interest and necessary capital expenditures.
Outcome: The company violates debt covenants, triggering default. It files Chapter 11 bankruptcy, restructures debt, and emerges with $300 million in debt and $500 million in new equity. Original shareholders lose 90% of their investment.
Lesson: Excessive long-term liabilities create fragility. Companies with high leverage cannot withstand significant revenue declines, making them poor investments during economic uncertainty.
Example 3: Technology Company Success
Scenario: A technology company maintains minimal long-term debt (debt-to-equity of 0.1) and generates $500 million in annual free cash flow.
Advantages:
- Financial flexibility to acquire competitors
- Ability to invest in R&D during downturns
- No covenant restrictions on operations
- Low bankruptcy risk attracts investors
Market Downturn Response: During a recession, competitors with high debt loads cut R&D and marketing. This company increases spending by $200 million, gaining market share and emerging stronger.
Outcome: The conservative capital structure enables opportunistic investments that create long-term competitive advantages. Stock price recovers faster than leveraged competitors.
Lesson: Low long-term liabilities provide strategic flexibility that creates value during volatile periods. This explains why many successful technology companies avoid significant debt.
Long-Term Liabilities and Personal Finance
The principles governing corporate long-term liabilities apply equally to personal financial management. Understanding these concepts helps individuals make better borrowing decisions.
Mortgage Decisions
A 30-year mortgage represents the most common personal long-term liability. The same analytical framework applies:
Example: A household earning $120,000 annually considers a $400,000 mortgage at 4% interest.
Analysis:
- Annual debt service: ~$23,000 (principal + interest)
- Debt service coverage: 5.2x ($120,000 ÷ $23,000)
- Debt-to-income: 19% (acceptable)
This represents manageable leverage. However, if the same household borrowed $700,000, debt service would rise to $40,000, reducing coverage to 3.0x and increasing vulnerability to income disruption.
The 50/30/20 rule for budgeting suggests allocating no more than 50% of after-tax income to necessities, including housing costs. This provides a practical framework for managing long-term housing obligations.
Student Loan Burden
Student loans represent long-term liabilities that cannot be discharged in bankruptcy, making them particularly dangerous when excessive.
Risk Assessment:
- Total student debt should not exceed the expected first-year salary
- Monthly payments should not exceed 10-15% of gross income
- Interest rates above 6% should be refinanced when possible
Example: A graduate with $80,000 in student loans at 5% interest faces $850 monthly payments for 10 years. With a $60,000 starting salary ($5,000 monthly gross), this represents 17% of income, manageable but tight. With only a $40,000 salary, the 21% burden creates severe financial stress.
The Wealth-Building Perspective
From a wealth-building standpoint, long-term liabilities should fund appreciating assets or income-generating investments. Borrowing for depreciating assets (cars, consumer goods) destroys wealth over time.
Productive Debt:
- Mortgages (real estate typically appreciates)
- Student loans (education increases earning capacity)
- Business loans (fund revenue-generating activities)
Destructive Debt:
- Auto loans (vehicles depreciate rapidly)
- Credit card debt (funds consumption, carries high rates)
- Personal loans for vacations or luxury goods
Wealth Formula: Net Worth = Assets – Liabilities
Increasing net worth requires either acquiring assets or reducing liabilities. The most effective strategy combines both: acquiring appreciating assets while minimizing non-productive liabilities.
Understanding active versus passive income helps individuals evaluate whether long-term liabilities align with income stability. Variable income sources create greater risk when combined with fixed debt obligations.
📊 Solvency Ratio Calculator
Analyze long-term financial health using key solvency metrics
Conclusion: Mastering Long-Term Liabilities for Financial Success
Long-term liabilities represent one of the most consequential elements of financial analysis for corporations, investors, and individuals alike. Understanding these obligations provides essential insights into solvency, risk exposure, and long-term sustainability.
The key principles covered in this guide form the foundation of sound financial decision-making:
For Investors: Evaluate long-term liabilities using solvency ratios (debt-to-equity, interest coverage, debt service coverage) to identify financially stable companies. Avoid businesses with excessive leverage unless risk tolerance and return expectations justify the exposure. Compare metrics to industry benchmarks rather than absolute standards, as capital structure norms vary significantly across sectors.
For Business Managers: Structure long-term liabilities to match asset lives and cash flow patterns. Ladder debt maturities to reduce refinancing risk. Maintain covenant compliance and preserve financial flexibility for opportunistic investments. Remember that optimal capital structure balances tax benefits against bankruptcy costs.
For Personal Finance: Apply corporate solvency principles to household decisions. Limit mortgage debt to manageable multiples of income. Ensure student loans align with realistic earning potential. Avoid long-term debt for depreciating assets. Build emergency reserves to weather income disruptions without defaulting on obligations.
Actionable Next Steps
- Analyze current holdings: Review the balance sheets of stocks in your portfolio. Calculate debt-to-equity and interest coverage ratios. Identify companies with concerning leverage.
- Establish screening criteria: Define acceptable solvency thresholds based on risk tolerance. Use these criteria when evaluating new investments.
- Monitor trends quarterly: Track how long-term liabilities change over time. Rising debt with flat revenue signals potential trouble.
- Evaluate personal obligations: Calculate your household debt-to-income ratio. Ensure long-term commitments remain sustainable under various income scenarios.
- Study industry patterns: Learn typical capital structures for sectors you invest in. Recognize when companies deviate from industry norms.
- Consider economic cycles: During late-cycle periods, favor companies with conservative balance sheets. These businesses survive downturns and emerge stronger.
The math behind money reveals that long-term liabilities amplify both gains and losses. Used wisely, they fund growth and create shareholder value. Used recklessly, they destroy companies and investor capital. Mastering this distinction separates successful investors from those who learn expensive lessons through portfolio losses.
Financial literacy demands understanding not just how to calculate ratios, but what they reveal about business sustainability and risk. Long-term liabilities provide a window into management quality, strategic thinking, and financial discipline, or the lack thereof.
By applying the frameworks, formulas, and analytical approaches outlined in this guide, readers gain the tools to evaluate solvency with confidence. This knowledge transforms balance sheet analysis from intimidating complexity to actionable insight, enabling better investment decisions and stronger personal financial management.
The evidence is clear: companies and individuals who manage long-term liabilities prudently build sustainable wealth. Those who ignore solvency metrics eventually face financial distress. Choose wisdom over recklessness, and let data guide decisions.
References
[1] Financial Accounting Standards Board (FASB). “Accounting Standards Codification Topic 210: Balance Sheet.” FASB.org.
[2] Moody’s Investors Service. “Rating Methodology: Corporate Bond Ratings.” Moody’s Analytics, 2024.
[3] U.S. Bureau of Labor Statistics. “National Compensation Survey: Employee Benefits in the United States.” BLS.gov, 2024.
[4] Federal Reserve Bank of New York. “The Failure of Lehman Brothers: A Case Study.” Federal Reserve Economic Research, 2019.
[5] S&P Global Market Intelligence. “U.S. Retail Bankruptcy Tracker 2020-2021.” S&P Global, 2021.
Author Bio
Max Fonji is the founder of The Rich Guy Math, a data-driven financial education platform dedicated to teaching the mathematical principles behind wealth building, investing, and risk management. With a background in economic analysis and a passion for making complex concepts accessible, Max helps readers understand the cause-and-effect relationships that govern money decisions. His evidence-based approach combines rigorous analysis with clear teaching, empowering individuals to make informed financial choices through numbers, logic, and proven frameworks.
Educational Disclaimer
This article provides educational information about long-term liabilities and financial analysis concepts. It does not constitute financial advice, investment recommendations, or professional accounting guidance. Financial decisions should be based on individual circumstances, risk tolerance, and objectives. Readers should consult qualified financial advisors, accountants, or other professionals before making investment or business decisions. The Rich Guy Math and its authors assume no liability for actions taken based on information contained in this article. Past performance does not guarantee future results. All investments carry risk, including potential loss of principal.
Frequently Asked Questions (FAQ)
What is the difference between long-term liabilities and current liabilities?
Long-term liabilities are financial obligations due beyond 12 months from the balance sheet date, while current liabilities must be paid within one year. This distinction affects liquidity analysis (current liabilities) versus solvency analysis (long-term liabilities). Examples of long-term liabilities include bonds payable, mortgages, and pension obligations. Current liabilities include accounts payable, wages payable, and short-term notes.
How do long-term liabilities affect a company’s financial health?
Long-term liabilities increase financial leverage, which amplifies both returns and risks. High debt levels create fixed interest obligations that must be paid regardless of revenue performance, reducing operational flexibility. Companies with excessive long-term debt face higher bankruptcy risk during economic downturns. However, moderate leverage can enhance returns on equity when investments generate returns exceeding borrowing costs.
What are good debt-to-equity ratio benchmarks?
Acceptable debt-to-equity ratios vary by industry. Technology and service companies typically maintain ratios below 0.5, while capital-intensive industries like utilities operate successfully with ratios of 1.0–2.0. Generally, ratios below 0.5 indicate conservative leverage, 0.5–1.0 represents moderate leverage, and above 2.0 signals potentially dangerous debt levels. Always compare companies to industry peers rather than using absolute standards.
How can I calculate interest coverage ratio?
Interest coverage ratio equals EBITDA divided by annual interest expense. For example, if a company generates $100 million in EBITDA and pays $20 million in interest, the coverage ratio is 5.0x. Ratios above 5.0x indicate strong coverage, 2.5–5.0x represents adequate coverage, and below 1.5x signals financial distress. This metric measures how easily a company can pay interest from operating earnings.
Should I avoid investing in companies with high long-term debt?
Not necessarily. Context matters significantly. Utilities, telecommunications, and real estate companies typically operate with higher debt levels due to stable, predictable cash flows. However, cyclical businesses (retail, airlines, commodities) with high debt face greater risk during downturns. Evaluate debt levels relative to industry norms, cash flow stability, and interest coverage capacity rather than using absolute rules.
What happens when a company cannot pay its long-term liabilities?
When companies cannot meet debt obligations, they default on loans or bonds. This typically triggers bankruptcy proceedings—either Chapter 11 (reorganization) or Chapter 7 (liquidation). During bankruptcy, debt holders negotiate new terms (reduced principal, lower interest, extended maturity) while equity holders often lose most or all of their investment. Credit ratings collapse, making future borrowing extremely expensive or impossible.
How do long-term liabilities appear on a balance sheet?
Long-term liabilities appear in the liabilities section of the balance sheet, listed after current liabilities. Common line items include Long-Term Debt, Bonds Payable, Pension Obligations, Deferred Tax Liabilities, and Long-Term Lease Obligations. The portion of long-term debt due within 12 months reclassifies to Current Portion of Long-Term Debt under current liabilities.
Can long-term liabilities be beneficial for a company?
Yes, when used strategically. Long-term debt enables companies to fund growth investments—such as factories, acquisitions, and R&D—without diluting shareholders through equity issuance. Interest payments are tax-deductible, reducing the effective cost of capital. Moderate leverage can enhance return on equity when investment returns exceed borrowing costs. The key is maintaining debt at sustainable levels relative to cash flow generation.
Related posts:
 What Is the 3x Rent Rule & How to Calculate It (With Examples)
 Portfolio Income: Definition, Examples, Tax Rules, and Strategies
 Bookkeeping vs Accounting: What’s the Difference & Which Do You Need?
 What Is Profitability Analysis & How to Do It: Metrics, Example & Tips
 Emergency Fund vs Savings: What’s the Real Difference and Why It Matters
 Debt Service Coverage Ratio (DSCR): Formula, Meaning & Examples