When Netflix invests billions in content production studios and streaming infrastructure, those costs don’t disappear if subscriber growth slows. When Tesla builds a massive Gigafactory, the facility expenses remain constant whether the company produces 100,000 vehicles or 500,000. This financial reality, where fixed costs stay unchanged regardless of sales volume, creates Operating Leverage, one of the most powerful yet misunderstood forces in business economics.
Operating Leverage measures how a company’s profit changes when sales volume changes, driven primarily by the relationship between fixed and variable costs. Understanding this concept reveals the math behind why some businesses can rapidly scale profits during growth periods while facing catastrophic losses during downturns.
This guide breaks down the mechanics, formulas, and strategic implications of operating leverage with clarity and precision.
Key Takeaways
- Operating leverage quantifies how fixed costs amplify profit changes when sales volume increases or decreases, creating both opportunity and risk
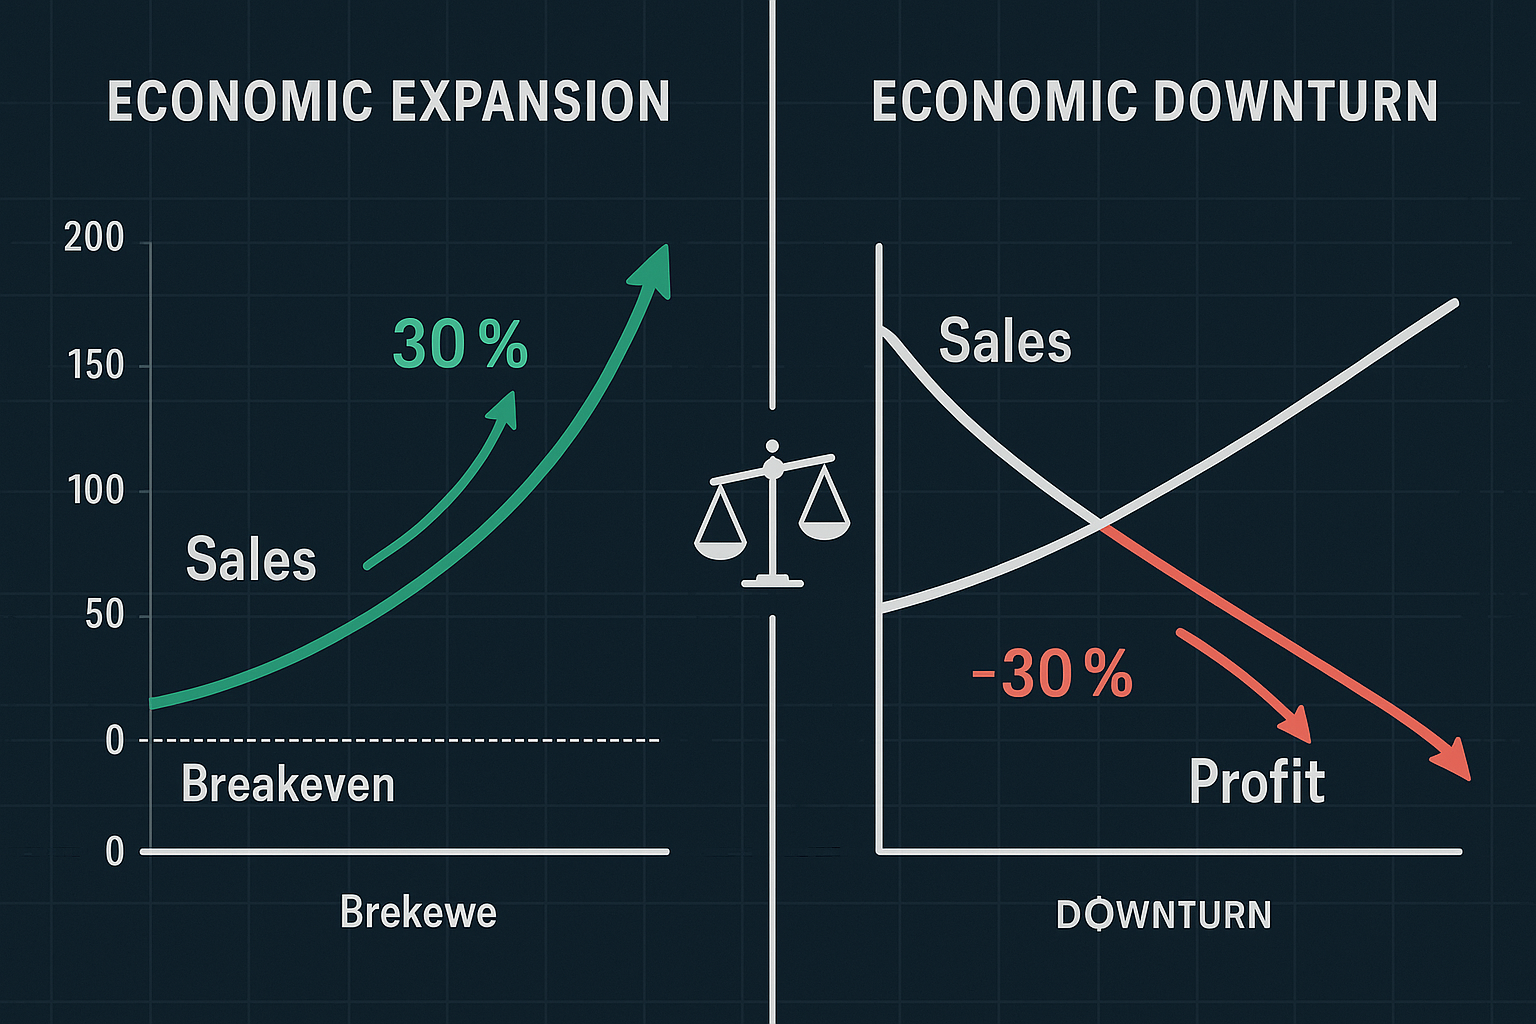
- High operating leverage means greater profit potential during growth, but significantly higher vulnerability during economic contractions
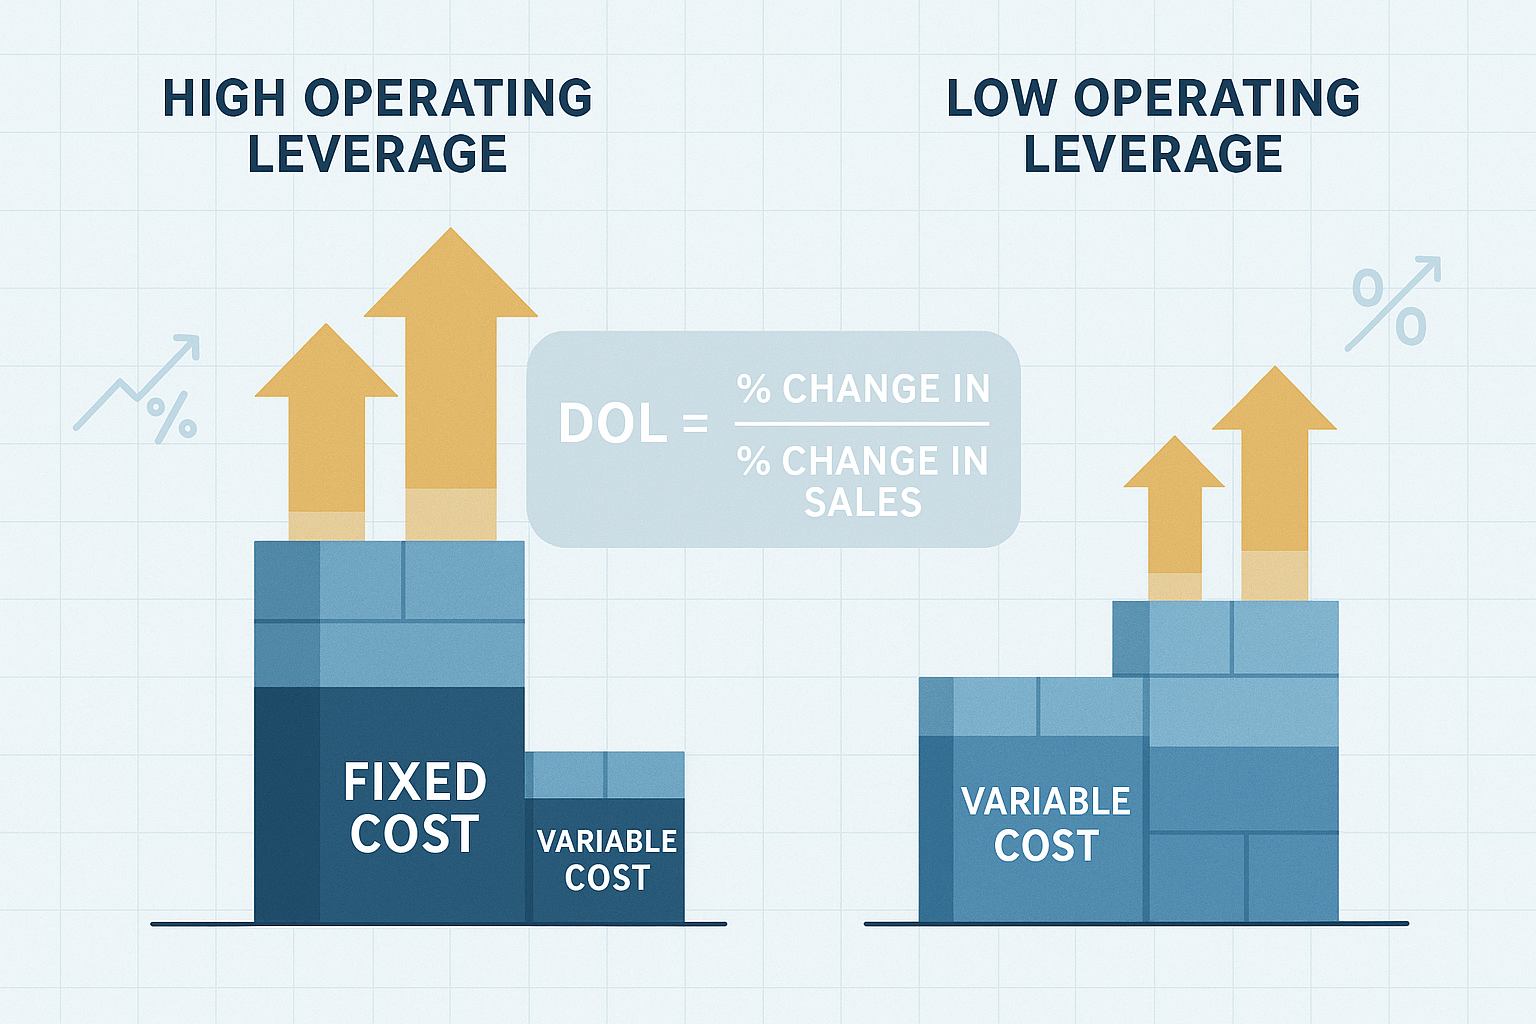
- The Degree of Operating Leverage (DOL) formula measures sensitivity by comparing percentage changes in operating income to percentage changes in sales
- Companies with substantial fixed costs (manufacturing, technology, airlines) typically exhibit high operating leverage compared to service businesses
- Understanding operating leverage improves investment decisions by revealing how revenue fluctuations translate into profitability changes
What Is Operating Leverage?
Operating leverage represents the proportion of fixed costs in a company’s cost structure and how those costs affect profitability as sales volume changes.
Fixed costs remain constant regardless of production or sales levels; these include factors such as factory rent, executive salaries, insurance premiums, and equipment depreciation. These expenses persist whether a company sells one unit or one million units.
Variable costs change directly with production volume, including raw materials, sales commissions, shipping expenses, and hourly labor. Double your production, and these costs roughly double as well.
The relationship between these cost types determines the intensity of operating leverage.
The Core Principle
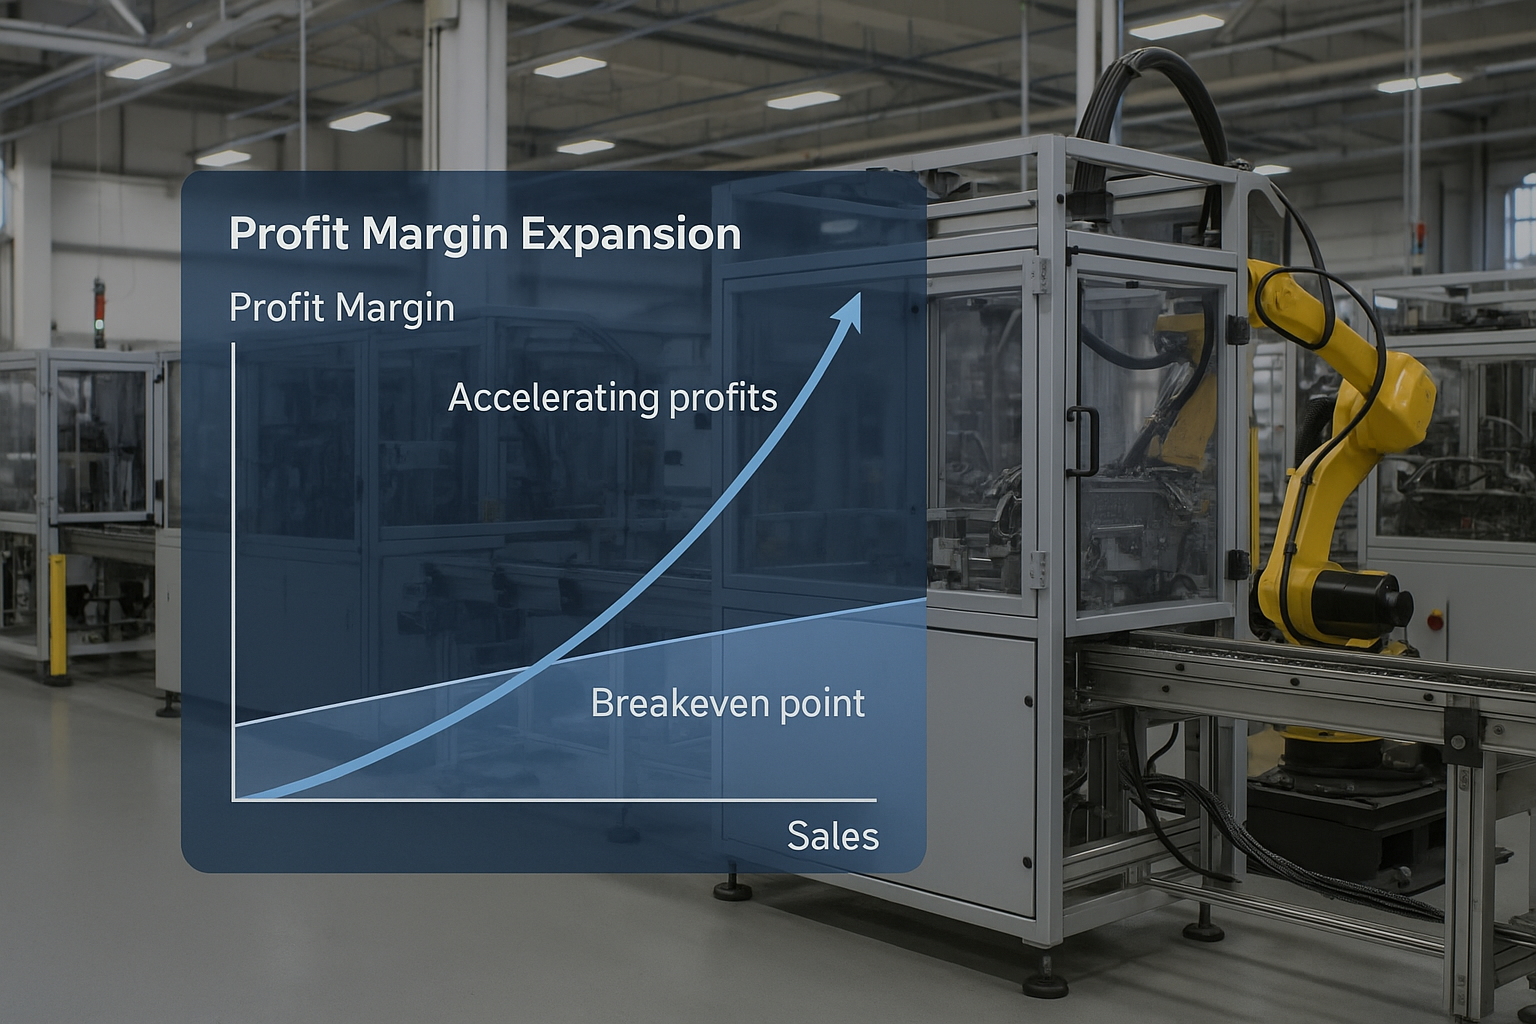
When a company has high fixed costs relative to variable costs, each additional sale contributes disproportionately to profit because those fixed costs are already covered. This creates operating leverage, the ability to convert revenue growth into accelerated profit growth.
Consider two companies, each generating $1 million in revenue:
Company A (High Operating Leverage):
- Fixed costs: $600,000
- Variable costs: $200,000
- Operating profit: $200,000
Company B (Low Operating Leverage):
- Fixed costs: $200,000
- Variable costs: $600,000
- Operating profit: $200,000
Both currently earn identical profits. But watch what happens when revenue increases by 20% to $1.2 million.
Company A:
- Fixed costs: $600,000 (unchanged)
- Variable costs: $240,000 (20% increase)
- Operating profit: $360,000 (80% profit increase)
Company B:
- Fixed costs: $200,000 (unchanged)
- Variable costs: $720,000 (20% increase)
- Operating profit: $280,000 (40% profit increase)
Company A’s profit jumped 80% from a mere 20% revenue increase; that’s the power of operating leverage. The fixed costs acted as a fulcrum, magnifying the profit impact of each incremental sale.
This mathematical relationship explains why accounting profit can vary dramatically between companies with similar revenue growth rates.
Why Operating Leverage Matters
Operating leverage directly influences:
- Profit volatility during economic cycles
- Breakeven point requirements
- Pricing strategy flexibility
- Competitive positioning in capital-intensive industries
- Investment risk assessment
Companies with high operating leverage experience greater profit swings, both positive and negative, making this concept essential for understanding business economics and risk management.
How to Calculate Operating Leverage: The DOL Formula
The Degree of Operating Leverage (DOL) quantifies the sensitivity of operating income to sales changes through a precise mathematical formula.
Primary DOL Formula
DOL = % Change in EBIT ÷ % Change in Sales
Where:
- EBIT = Earnings Before Interest and Taxes (operating income)
- % Change = [(New Value – Old Value) ÷ Old Value] × 100
This formula reveals how much operating profit changes for each 1% change in sales revenue.
Example Calculation
A manufacturing company reports:
- Year 1 Sales: $5,000,000 | EBIT: $800,000
- Year 2 Sales: $5,500,000 | EBIT: $1,040,000
Step 1: Calculate the percentage change in sales
- Sales change = [($5,500,000 – $5,000,000) ÷ $5,000,000] × 100 = 10%
Step 2: Calculate percentage change in EBIT
- EBIT change = [($1,040,000 – $800,000) ÷ $800,000] × 100 = 30%
Step 3: Calculate DOL
- DOL = 30% ÷ 10% = 3.0
Interpretation: This company has a DOL of 3.0, meaning every 1% increase in sales generates a 3% increase in operating income. Conversely, a 1% sales decline produces a 3% operating income decline.
Alternative DOL Formula
Financial analysts often use this contribution margin approach:
DOL = Contribution Margin ÷ Operating Income
Where:
- Contribution Margin = Sales Revenue – Variable Costs
- Operating Income = Contribution Margin – Fixed Costs
Using the same company with additional detail:
- Sales: $5,000,000
- Variable costs: $3,000,000
- Fixed costs: $1,200,000
- Contribution margin: $2,000,000
- Operating income: $800,000
DOL = $2,000,000 ÷ $800,000 = 2.5
This formula provides a snapshot DOL at a specific sales level, useful for forecasting and scenario analysis.
DOL Interpretation Guide
| DOL Value | Operating Leverage Level | Profit Sensitivity | Risk Profile |
|---|---|---|---|
| 1.0 – 1.5 | Low | Minimal amplification | Conservative |
| 1.5 – 3.0 | Moderate | Moderate amplification | Balanced |
| 3.0 – 5.0 | High | Significant amplification | Aggressive |
| 5.0+ | Very High | Extreme amplification | Speculative |
Understanding these calculations helps investors analyze how companies translate revenue growth into earnings per share expansion.
High vs Low Operating Leverage: Industry Examples
Operating leverage varies dramatically across industries based on cost structure requirements and business models.
High Operating Leverage Industries
1. Manufacturing
Automobile manufacturers exemplify high operating leverage. Tesla operates massive production facilities with billions invested in equipment, robotics, and factory infrastructure. These fixed costs remain constant whether production runs at 60% or 95% capacity.
When demand surges, Tesla can increase production with minimal additional cost per vehicle, primarily raw materials and some variable labor. This cost structure allows dramatic profit expansion during growth periods.
2. Airlines
Airlines face enormous fixed costs: aircraft purchases or leases, airport gate fees, pilot salaries, maintenance facilities, and regulatory compliance. A flight from New York to Los Angeles costs roughly the same whether 50 or 150 passengers board.
Each additional passenger generates nearly pure profit once fixed costs are covered, explaining why airlines obsessively pursue load factor optimization.
3. Software and Technology
Microsoft spent years and billions developing Windows and Office. Those development costs (now sunk) represented massive fixed investments. But distributing an additional software license costs essentially nothing—the marginal cost approaches zero.
This extreme operating leverage explains why successful software companies achieve extraordinary profit margins as they scale. The same principle applies to cloud infrastructure providers like Amazon Web Services.
4. Telecommunications
Building cellular networks requires billions in tower infrastructure, fiber optic cables, and spectrum licenses. Once built, adding another customer costs minimal incremental expense, just data transmission and customer service.
This cost structure drove industry consolidation, as larger networks spread fixed costs across more subscribers, creating competitive advantages.
Low Operating Leverage Industries
1. Consulting Services
Professional services firms like McKinsey or Deloitte have relatively low operating leverage. Their primary cost are variable, consultant salaries, and billable hours. Adding revenue requires adding consultants, maintaining a proportional cost-to-revenue relationship.
While some fixed costs exist (office space, administrative staff), they represent a smaller proportion of total costs compared to manufacturing or technology.
2. Retail Trade
Traditional retailers purchase inventory (variable cost) that scales directly with sales. While store leases and staff represent fixed costs, the cost of goods sold dominates the expense structure.
A grocery store selling twice as much product must purchase roughly twice as much inventory, limiting operating leverage compared to capital-intensive industries.
3. Restaurants
Food service businesses face moderate-to-low operating leverage. While rent and core staff represent fixed costs, food costs and hourly labor scale with customer volume. A restaurant serving 50% more customers needs significantly more ingredients and kitchen staff.
4. Construction
Construction companies typically operate with project-based cost structures. Labor and materials (variable costs) dominate expenses, while equipment and overhead represent smaller proportions. Revenue growth requires proportional increases in labor and material spending.
Strategic Implications by Industry
High operating leverage industries benefit from:
- Economies of scale that create competitive moats
- Barrier to entry from capital requirements
- Explosive profit growth during expansion cycles
- Market share advantages for established players
But they suffer from:
- Catastrophic losses during downturns
- Inflexibility in cost reduction
- Breakeven vulnerability requiring minimum sales volumes
- Capital intensity limits financial flexibility
Understanding these dynamics informs capital allocation strategies and investment selection.
Operating Leverage and Business Risk
Operating leverage creates a double-edged sword, amplifying both gains and losses as sales fluctuate.
The Upside: Profit Acceleration
During economic expansions or successful product launches, high operating leverage companies experience disproportionate profit growth. Because fixed costs remain constant, incremental revenue flows directly to operating income after covering variable costs.
Real-World Example: Netflix (2013-2020)
Netflix invested heavily in streaming infrastructure and content production, massive fixed costs. As subscriber growth accelerated globally, those fixed costs were spread across an expanding user base. Revenue growth of 20-30% annually translated into even faster operating income growth, demonstrating classic operating leverage dynamics.
The company’s EBITDA margin expanded significantly as fixed content costs were amortized across millions of additional subscribers, each paying monthly fees with minimal incremental service cost.
The Downside: Loss Amplification
The same mechanism works in reverse during downturns. When sales decline, fixed costs persist while contribution margin shrinks, creating accelerated losses.
Real-World Example: Airlines (2020 COVID-19 Pandemic)
When travel demand collapsed in March 2020, airlines couldn’t eliminate fixed costs; aircraft leases, airport contracts, and maintenance obligations continued. With revenue falling 70-90%, these companies experienced catastrophic losses despite grounding most aircraft.
Delta Air Lines reported a $5.7 billion loss in Q2 2020 despite operating only a fraction of normal flights. The fixed cost structure that generated strong profits during normal operations became an existential threat during the crisis.
Business Risk Components
Operating leverage contributes to business risk; the uncertainty of operating income is caused by sales volatility. This differs from financial risk (related to debt financing), though the two interact.
Total Business Risk = Operating Risk + Financial Risk
Companies with high operating leverage face elevated business risk because:
- Revenue volatility translates into magnified profit volatility
- Breakeven points require higher sales volumes
- Cost flexibility decreases during downturns
- Competitive pressure intensifies during weak demand
This risk profile affects debt-to-equity ratio decisions, as highly leveraged operations typically require more conservative capital structures.
Risk Management Strategies
Companies can manage operating leverage risk through:
1. Flexible Cost Structures
Converting fixed costs to variable costs where possible—using contract labor instead of permanent staff, leasing instead of purchasing equipment, or outsourcing non-core functions.
2. Diversification
Spreading operations across multiple markets, products, or customer segments to reduce dependence on single revenue sources.
3. Pricing Power
Building brand strength and competitive advantages that allow price increases during downturns, partially offsetting volume declines.
4. Financial Reserves
Maintaining strong balance sheets with cash reserves and available credit to weather revenue disruptions without forced asset sales.
5. Breakeven Analysis
Continuously monitoring the sales volume required to cover fixed costs, ensuring an adequate margin of safety during normal operations.
Understanding operating leverage risk helps investors assess a company’s vulnerability during economic cycles and evaluate appropriate diversification strategies.
Operating Leverage in Investment Analysis
Financial analysts and investors use operating leverage analysis to forecast earnings, assess risk, and make informed capital allocation decisions.
Earnings Forecasting
Operating leverage enables more accurate profit projections based on revenue assumptions.
Example Forecast:
A company with a DOL of 4.0 and a projected 15% revenue growth:
- Expected operating income growth = 15% × 4.0 = 60%
This relationship allows analysts to model various revenue scenarios and their profit implications, improving enterprise value calculations and investment thesis development.
Valuation Implications
High operating leverage companies often trade at different valuation multiples than low-leverage peers because:
- Earnings volatility affects risk-adjusted discount rates
- Growth amplification justifies premium multiples during expansion phases
- Cyclical sensitivity demands scenario-based valuation approaches
- Margin expansion potential creates optionality value
Investors analyzing dividend growth stocks must consider operating leverage when assessing dividend sustainability during economic downturns.
Competitive Analysis
Operating leverage reveals competitive dynamics within industries:
- Market share battles become more intense in high-leverage industries because volume gains generate outsized profit increases
- Pricing discipline matters more when fixed costs dominate, as price wars can quickly push companies below breakeven
- Barriers to entry strengthen in capital-intensive industries where operating leverage requires scale to achieve profitability
M&A Due Diligence
Investment bankers analyze operating leverage during merger and acquisition evaluations to:
- Identify synergies from combining fixed cost structures
- Assess integration risk related to redundant fixed costs
- Model post-merger profitability under various revenue scenarios
- Evaluate strategic fit based on complementary cost structures
Understanding the target company’s operating leverage helps acquirers forecast post-merger economic profit and justify premium valuations.
Portfolio Construction
Investors building diversified portfolios should consider operating leverage exposure:
Conservative Portfolios:
- Emphasize low operating leverage companies
- Prioritize stable earnings over growth amplification
- Focus on defensive sectors (consumer staples, utilities)
- Reduce cyclical exposure
Aggressive Portfolios:
- Include high operating leverage companies
- Accept volatility for growth potential
- Overweight cyclical sectors (technology, industrials)
- Time entries based on economic cycle positioning
This framework complements traditional asset allocation approaches by incorporating operating characteristics alongside financial metrics.
Operating Leverage vs Financial Leverage
While both concepts involve “Leverage: The Complete Guide for Investors and Businesses,” they operate through different mechanisms and affect different parts of the income statement.
Operating Leverage Recap
Operating leverage stems from fixed operating costs and affects the relationship between sales and operating income (EBIT). It represents business model characteristics and cost structure decisions.
Location on Income Statement: Revenue → Operating Income
Financial Leverage Defined
Financial leverage stems from debt financing and affects the relationship between operating income and net income. It represents capital structure decisions and financing choices.
Location on Income Statement: Operating Income → Net Income
Financial Leverage Formula:
Degree of Financial Leverage (DFL) = % Change in EPS ÷ % Change in EBIT
Or alternatively:
DFL = EBIT ÷ (EBIT – Interest Expense)
Combined Leverage Effect
The two leverage types multiply to create total leverage or degree of combined leverage (DCL):
DCL = DOL × DFL
This formula reveals how sales changes ultimately affect earnings per share, incorporating both operating and financing decisions.
Example: Combined Leverage
A company with:
- DOL = 3.0 (high operating leverage)
- DFL = 2.0 (moderate financial leverage)
- DCL = 3.0 × 2.0 = 6.0
A 10% revenue increase produces:
- Operating income increase: 10% × 3.0 = 30%
- EPS increase: 30% × 2.0 = 60%
- Or directly: 10% × 6.0 = 60%
This demonstrates how companies with both high operating leverage and significant debt financing experience extreme earnings volatility.
Strategic Differences
| Aspect | Operating Leverage | Financial Leverage |
|---|---|---|
| Source | Fixed operating costs | Debt financing |
| Affects | Operating income | Net income & EPS |
| Management Control | Business model choice | Capital structure choice |
| Flexibility | Difficult to change short-term | Can refinance or restructure |
| Risk Type | Business risk | Financial risk |
| Measurement | DOL | DFL |
Risk Interaction
Companies must balance both leverage types carefully. High operating leverage companies often maintain conservative financial leverage (low debt) to avoid excessive total risk. Conversely, low operating leverage businesses can typically sustain higher debt levels safely.
This relationship affects capitalization ratio decisions and optimal capital structure determination.
Practical Applications and Strategic Decisions
Operating leverage analysis informs critical business and investment decisions across multiple domains.
1. Pricing Strategy
Understanding operating leverage helps companies set optimal prices.
High Operating Leverage Companies:
- Can offer aggressive pricing to gain market share because incremental volume generates high marginal profit
- Must maintain pricing discipline to avoid industry-wide margin destruction
- Benefit from premium pricing strategies once fixed costs are covered
Low Operating Leverage Companies:
- Have less pricing flexibility since variable costs consume most revenue
- Can compete on price more sustainably without catastrophic margin compression
- Must focus on operational efficiency to improve profitability
2. Capacity Planning
Operating leverage drives expansion timing decisions.
Companies with high fixed costs must carefully plan capacity additions because:
- Underutilization of new capacity creates immediate losses
- Optimal timing requires confident demand forecasts
- Scale matters more than in variable-cost businesses
This explains why capital-intensive industries experience cyclical boom-bust patterns, companies simultaneously add capacity during good times, creating oversupply and subsequent downturns.
3. Make vs. Buy Decisions
Operating leverage influences outsourcing and vertical integration choices.
When to Internalize (Build Operating Leverage):
- Stable, predictable demand justifies fixed cost investment
- Volume reaches a scale where fixed costs per unit become competitive
- Proprietary technology or quality control requires direct ownership
- Strategic control provides a competitive advantage
When to Outsource (Reduce Operating Leverage):
- Demand volatility makes fixed costs risky
- Volume insufficient to justify capital investment
- Suppliers offer economies of scale advantages
- Flexibility and cost variability provide strategic value
4. Breakeven Analysis
Operating leverage directly determines breakeven points, the sales volume at which total revenue equals total costs.
Breakeven Formula:
Breakeven Sales = Fixed Costs ÷ Contribution Margin Ratio
Where:
- Contribution Margin Ratio = (Sales – Variable Costs) ÷ Sales
Example:
- Fixed costs: $500,000
- Sales price per unit: $100
- Variable cost per unit: $60
- Contribution margin per unit: $40
- Contribution margin ratio: 40%
Breakeven Sales = $500,000 ÷ 0.40 = $1,250,000
Or in units: $500,000 ÷ $40 = 12,500 units
High operating leverage companies have higher breakeven points, requiring greater sales volumes before achieving profitability. This creates both opportunity (rapid profit growth beyond breakeven) and risk (larger losses below breakeven).
Understanding breakeven dynamics complements budget planning and financial forecasting.
5. Competitive Strategy
Operating leverage shapes competitive positioning and strategic choices.
High Operating Leverage Strategies:
- Pursue market share aggressively to spread fixed costs
- Invest in brand building and customer acquisition
- Focus on capacity utilization optimization
- Create switching costs to protect volume
Low Operating Leverage Strategies:
- Emphasize flexibility and rapid market response
- Compete on customization and service quality
- Maintain lean operations and cost control
- Accept a smaller scale in exchange for stability
6. Investment Timing
Investors can use operating leverage analysis to time cyclical investments.
Economic Expansion Phase:
- High operating leverage companies offer superior profit growth potential
- Increasing capacity utilization drives margin expansion
- Revenue growth translates into amplified earnings growth
Economic Contraction Phase:
- Reduce exposure to high operating leverage companies
- Shift toward stable, low-leverage business models
- Protect capital from amplified downside risk
This cyclical approach enhances returns when combined with dollar cost averaging strategies that reduce timing risk.
Common Misconceptions About Operating Leverage
Several misunderstandings persist about operating leverage that can lead to analytical errors.
Misconception 1: “High Operating Leverage Is Always Bad”
Reality: Operating leverage is neither inherently good nor bad—it’s a risk-return tradeoff.
High operating leverage creates volatility, but that volatility includes significant upside during growth periods. For investors with appropriate risk tolerance and long time horizons, high-leverage companies can generate superior returns.
The key is matching operating leverage exposure to investment objectives and economic cycle positioning.
Misconception 2: “Operating Leverage Equals Financial Leverage”
Reality: These are distinct concepts affecting different income statement sections.
Operating leverage relates to the business model and cost structure. Financial leverage relates to capital structure and debt financing. While both amplify returns, they operate through different mechanisms and require separate analysis.
Confusing the two leads to incomplete risk assessment and flawed investment decisions.
Misconception 3: “Only Manufacturing Has Operating Leverage”
Reality: Operating leverage exists across all industries, though intensity varies.
Software companies exhibit extreme operating leverage despite minimal physical assets. Airlines, telecommunications, and even some service businesses demonstrate significant operating leverage. The determining factor is the fixed-to-variable cost ratio, not industry classification.
Misconception 4: “Operating Leverage Is Static”
Reality: Companies can modify operating leverage through strategic decisions.
Businesses continuously adjust cost structures through:
- Automation investments (increasing operating leverage)
- Outsourcing decisions (decreasing operating leverage)
- Capacity expansion or contraction
- Technology adoption
- Business model evolution
Operating leverage represents the current cost structure but changes over time based on management decisions and competitive dynamics.
Misconception 5: “Low Operating Leverage Means Low Risk”
Reality: Low operating leverage reduces one risk component but doesn’t eliminate business risk.
Companies with low operating leverage still face:
- Competitive pressure
- Market disruption
- Execution risk
- Management quality issues
- Industry-specific challenges
Operating leverage analysis must complement comprehensive due diligence, not replace it.
How to Use Operating Leverage in Your Investment Strategy
Implementing operating leverage analysis improves investment decision-making through systematic evaluation and portfolio construction.
Step 1: Calculate DOL for Target Companies
Begin by determining the degree of operating leverage for companies under consideration:
- Gather financial data from income statements (10-K filings)
- Calculate contribution margin (Revenue – Variable Costs)
- Identify fixed costs from financial statement notes
- Compute DOL using the contribution margin formula
- Compare DOL across competitors and industry averages
This quantitative foundation enables objective comparison and risk assessment.
Step 2: Assess Economic Cycle Position
Operating leverage impact varies by economic cycle stage:
Early Expansion:
- High operating leverage companies begin recovering
- Increasing capacity utilization drives margin improvement
- Consider initiating positions in cyclical, high-leverage sectors
Mid-Expansion:
- Operating leverage companies deliver peak earnings growth
- Maintain positions but monitor for overcapacity signals
- Valuation multiples may expand beyond historical norms
Late Expansion:
- Begin reducing high operating leverage exposure
- Profit growth may decelerate as capacity constraints emerge
- Shift toward defensive, low-leverage positions
Contraction:
- Minimize high operating leverage holdings
- Focus on companies with flexible cost structures
- Preserve capital for eventual recovery opportunities
This cyclical framework enhances active income generation through strategic positioning.
Step 3: Diversify Across Operating Leverage Profiles
Build portfolio resilience by combining different operating leverage exposures:
Core Holdings (40-50%):
- Moderate operating leverage companies
- Balanced risk-return profiles
- Steady earnings growth potential
Growth Allocation (20-30%):
- High operating leverage companies
- Selected during favorable economic conditions
- Accept volatility for amplified upside
Defensive Allocation (20-30%):
- Low operating leverage companies
- Stable earnings during uncertainty
- Downside protection during contractions
Cash Reserve (10%):
- Opportunistic deployment capability
- Reduces forced selling during downturns
- Enables contrarian positioning
This structure balances growth potential with risk management, similar to principles underlying the 50/30/20 rule.
Step 4: Monitor Operating Leverage Changes
Track how companies modify cost structures over time:
- Quarterly earnings calls: Listen for capacity expansion announcements
- Capital expenditure trends: Rising capex often increases operating leverage
- Margin analysis: Expanding margins during revenue growth confirm operating leverage
- Industry dynamics: Technology adoption and automation affect leverage profiles
Identifying operating leverage shifts before market recognition creates investment opportunities.
Step 5: Integrate with Valuation Analysis
Combine operating leverage assessment with traditional valuation metrics:
For High Operating Leverage Companies:
- Use scenario analysis with multiple revenue assumptions
- Apply higher discount rates reflecting volatility
- Focus on normalized earnings power, not current results
- Consider cyclically-adjusted valuation multiples
For Low Operating Leverage Companies:
- Accept lower growth rates in exchange for stability
- Apply standard valuation multiples
- Emphasize consistent cash flow generation
- Value predictability premium appropriately
This integrated approach produces more accurate intrinsic value estimates and improves capital gains potential.
Real-World Case Study: Operating Leverage in Action
Company: Southwest Airlines (2019-2023)
This case study demonstrates operating leverage dynamics through a complete economic cycle.
Pre-Pandemic (2019): Operating Leverage Advantage
Financial Profile:
- Revenue: $22.4 billion
- Operating expenses: $19.8 billion
- Operating income: $2.6 billion
- Operating margin: 11.6%
Cost Structure:
- Fixed costs (aircraft, facilities, core staff): ~$12 billion
- Variable costs (fuel, landing fees, variable labor): ~$7.8 billion
- High operating leverage profile
Performance:
Southwest operated near capacity with load factors exceeding 83%. The fixed cost base was spread across maximum passenger volume, generating strong profitability. Each additional passenger contributed significantly to operating income since fixed costs were already covered.
Pandemic Impact (2020): Operating Leverage Downside
Financial Profile:
- Revenue: $9.0 billion (-60% decline)
- Operating expenses: $14.4 billion
- Operating loss: -$5.4 billion
- Operating margin: -60%
Analysis:
The 60% revenue decline produced a catastrophic swing from $2.6 billion profit to $5.4 billion loss—a $8 billion deterioration. This amplified loss demonstrates operating leverage working in reverse.
Fixed costs (aircraft leases, airport contracts, minimum staffing) persisted despite grounded aircraft. The company couldn’t proportionally reduce expenses with revenue, creating massive losses.
DOL Calculation:
- Revenue change: -60%
- Operating income change: -308% (from +$2.6B to -$5.4B)
- Implied DOL: 308% ÷ 60% = 5.1
This extreme DOL confirms Southwest’s high operating leverage and explains the amplified loss during the crisis.
Recovery Phase (2021-2022): Operating Leverage Upside
As travel demand recovered, operating leverage worked favorably:
2021 Financial Profile:
- Revenue: $15.8 billion (+76% from 2020)
- Operating loss: -$1.2 billion (improving from -$5.4B)
2022 Financial Profile:
- Revenue: $23.8 billion (+51% from 2021)
- Operating income: $2.4 billion (return to profitability)
Analysis:
The 51% revenue increase in 2022 produced a $3.6 billion operating income improvement (from -$1.2B to +$2.4B). Fixed costs remained relatively stable while contribution margin expanded dramatically with volume recovery.
Investment Implications
Optimal Entry Points:
- Late 2020: Maximum pessimism, depressed valuation, high risk but asymmetric upside
- Mid-2021: Recovery confirmation, reduced risk, still attractive valuation
Optimal Exit Points:
- Late 2022: Full recovery priced in, normalized valuation multiples
- Early 2023: Economic uncertainty increasing, cyclical risks rising
Lessons:
- High operating leverage creates extreme volatility requiring strong conviction
- Understanding cost structure enables contrarian positioning during crises
- Recovery periods offer amplified returns when operating leverage works favorably
- Timing matters significantly for high-leverage cyclical investments
This case study illustrates why operating leverage analysis improves investment outcomes through better risk assessment and opportunity identification
📊 Operating Leverage Calculator
Calculate your company’s Degree of Operating Leverage (DOL) and understand profit sensitivity
Conclusion
Operating leverage represents one of the most fundamental yet frequently overlooked concepts in business economics and investment analysis. The relationship between fixed costs, variable costs, and profitability determines how companies perform across economic cycles and why seemingly similar businesses generate vastly different returns.
The core principle is straightforward: Companies with high fixed costs relative to variable costs experience amplified profit changes when sales volume changes. This amplification creates both opportunity and risk—exceptional growth potential during expansions and significant vulnerability during contractions.
Key Implementation Steps
For Investors:
- Calculate DOL for companies in your portfolio or watchlist
- Assess economic cycle position to determine appropriate operating leverage exposure
- Diversify across leverage profiles to balance growth potential with stability
- Monitor cost structure changes that signal shifting risk-return characteristics
- Integrate leverage analysis with traditional valuation and quality metrics
For Business Leaders:
- Understand your cost structure and resulting operating leverage profile
- Plan capacity expansion carefully based on confident demand forecasts
- Make strategic decisions about automation, outsourcing, and vertical integration with leverage implications in mind
- Maintain financial flexibility through conservative financial leverage when operating leverage is high
- Communicate leverage dynamics to investors and stakeholders for appropriate expectations
The Math Behind Money
Operating leverage exemplifies how mathematical relationships drive financial outcomes. The simple ratio of contribution margin to operating income reveals profound insights about business economics, competitive dynamics, and investment risk.
Understanding these quantitative relationships, the math behind money, separates sophisticated investors from those who rely on surface-level analysis. Operating leverage analysis requires no complex models or advanced mathematics, yet provides powerful insights that improve decision-making and enhance returns.
Next Steps
Apply operating leverage analysis to your current investments or business operations:
- Review recent financial statements to identify fixed and variable cost components
- Calculate DOL for key holdings or competitors
- Assess whether current operating leverage exposure aligns with the economic outlook and risk tolerance
- Consider rebalancing toward appropriate leverage profiles based on cycle position
- Monitor quarterly results for margin trends that confirm or contradict leverage assumptions
Operating leverage analysis complements other investing fundamentals and valuation principles to build a comprehensive understanding of business economics. Master this concept, and you’ll view companies, industries, and investment opportunities through a more sophisticated analytical lens—one that reveals opportunities others miss and avoids risks others overlook.
The companies that dominate their industries, the investments that generate exceptional returns, and the business decisions that create lasting value all reflect a deep understanding of operating leverage dynamics. Now you possess that understanding. Use it wisely.
References
[1] Brigham, E. F., & Ehrhardt, M. C. (2020). Financial Management: Theory & Practice (16th ed.). Cengage Learning.
[2] Damodaran, A. (2022). “Operating Leverage.” NYU Stern School of Business. Retrieved from https://pages.stern.nyu.edu/~adamodar/
[3] CFA Institute. (2023). CFA Program Curriculum Level I: Corporate Finance. CFA Institute.
[4] Securities and Exchange Commission. (2024). “Financial Statement Analysis.” SEC Investor Publications. Retrieved from https://www.sec.gov/
[5] Investopedia. (2025). “Operating Leverage.” Retrieved from https://www.investopedia.com/
[6] Federal Reserve Bank of St. Louis. (2024). “Economic Research Data.” FRED Economic Data. Retrieved from https://fred.stlouisfed.org/
[7] Morningstar. (2025). “Financial Analysis and Valuation Metrics.” Morningstar Investment Research. Retrieved from https://www.morningstar.com/
Author Bio
Max Fonji is the founder of The Rich Guy Math, a data-driven financial education platform dedicated to teaching the mathematical principles behind wealth building, investing, and risk management. With expertise in financial analysis and valuation, Max translates complex financial concepts into clear, actionable insights for investors at all experience levels. His evidence-based approach emphasizes understanding cause-and-effect relationships in finance, empowering readers to make informed decisions based on logic and data rather than emotion or speculation.
Educational Disclaimer
This article is provided for educational and informational purposes only and does not constitute financial, investment, tax, or legal advice. The content represents general principles of operating leverage analysis and should not be considered personalized recommendations for any specific investment or business decision.
Operating leverage analysis involves assumptions and estimates that may not reflect actual future results. Past performance does not guarantee future outcomes. All investments carry risk, including potential loss of principal. Companies with high operating leverage face elevated business risk that may not be suitable for all investors.
Readers should conduct independent research, consider their individual financial circumstances, risk tolerance, and investment objectives, and consult qualified financial, tax, and legal professionals before making investment or business decisions. The Rich Guy Math and its authors assume no liability for decisions made based on information contained in this article.
Financial markets and business conditions change continuously. Information presented here reflects conditions as of 2025 and may become outdated. Always verify current data and seek professional guidance for important financial decisions.
Frequently Asked Questions (FAQ)
What is operating leverage in simple terms?
Operating leverage measures how a company’s profits change when sales change, based on the proportion of fixed costs in the business. Companies with high fixed costs experience larger profit swings when sales increase or decrease compared to companies with mostly variable costs.
How do you calculate the degree of operating leverage?
DOL is calculated using the formula: DOL = Contribution Margin ÷ Operating Income, where Contribution Margin equals Sales minus Variable Costs. Alternatively, use DOL = % Change in EBIT ÷ % Change in Sales when comparing two periods.
Is high operating leverage good or bad?
High operating leverage is neither inherently good nor bad—it represents a risk-return tradeoff. High leverage amplifies profits during growth periods but magnifies losses during downturns.
What industries have the highest operating leverage?
Industries such as manufacturing, airlines, telecommunications, software, utilities, and other capital-intensive sectors typically have high operating leverage due to heavy fixed costs.
How does operating leverage differ from financial leverage?
Operating leverage is tied to fixed operating costs and affects the relationship between sales and operating income. Financial leverage is tied to debt and affects the relationship between operating income and net income.
Can a company change its operating leverage?
Yes. Companies can alter operating leverage through automation, outsourcing, capacity changes, technology adoption, and business model adjustments. These changes usually take time and capital.
What is a good DOL ratio?
DOL between 1.5 and 3.0 indicates moderate leverage. DOL above 3.0 suggests high leverage and elevated risk, while DOL below 1.5 indicates a more stable business structure.
How does operating leverage affect stock prices?
High operating leverage increases earnings volatility, which can lead to greater stock price swings. In strong markets, these companies may have higher valuations, while in downturns, they often face sharper declines.
Related posts:
 What Is SmartPass? Raptor Digital Hall Pass Explained for K-12 Schools
 What Is the 3x Rent Rule & How to Calculate It (With Examples)
 Portfolio Income: Definition, Examples, Tax Rules, and Strategies
 Bookkeeping vs Accounting: What’s the Difference & Which Do You Need?
 What Is Profitability Analysis & How to Do It: Metrics, Example & Tips
 Emergency Fund vs Savings: What’s the Real Difference and Why It Matters