

In 1999, during the dot-com bubble, investors paid $100 for every $1 of earnings in some technology stocks. By 2002, many of those companies had vanished, taking billions in investor capital with them. The warning signal was there all along, hidden in plain sight: the PE ratio.
The P/E ratio (Price-to-Earnings ratio) represents the single most widely used metric in stock valuation. It reveals exactly how much investors pay for each dollar a company earns. Understanding this fundamental metric transforms investing from speculation into evidence-based decision-making.
This comprehensive guide explains the math behind the P/E ratio, demonstrates how to calculate and interpret it correctly, and shows precisely when to use it and when to avoid it in your investment analysis.
Key Takeaways
- The P/E ratio measures stock price relative to earnings: Calculated as Current Stock Price ÷ Earnings Per Share, it shows how many dollars investors pay for each dollar of company profit.
- Industry context matters more than absolute numbers: A P/E of 30 might signal overvaluation in utilities but undervaluation in high-growth technology sectors.
- The S&P 500 P/E ratio in 2025 stands at 37.1. This represents an 80.9% premium over the historical average of 20.5, indicating elevated market valuations
- Trailing vs. forward P/E ratios serve different purposes: Trailing P/E uses actual past earnings, while forward P/E relies on analyst projections for future performance.
- The PEG ratio adjusts for growth expectations: Dividing P/E by growth rate creates a more complete valuation picture, with values below 1.0 generally suggesting undervaluation.
What Is the P/E Ratio? Definition and Core Concept
The P/E ratio (Price-to-Earnings ratio) measures the relationship between a company’s stock price and its earnings per share. This metric answers a fundamental question: How much are investors willing to pay for each dollar of company earnings?
The formula is straightforward:
P/E Ratio = Current Stock Price ÷ Earnings Per Share (EPS)
If a stock trades at $50 per share and the company earned $2.50 per share over the past year, the P/E ratio equals 20 ($50 ÷ $2.50 = 20). This means investors pay $20 for every $1 of annual earnings.
Think of the P/E ratio as a payback period. A P/E of 20 suggests it would take 20 years of current earnings to recoup your investment if you owned the entire company and captured all profits. This simplified view helps investors grasp valuation at a glance.
The P/E ratio belongs to a family of valuation principles that help investors determine whether a stock trades at fair value, premium pricing, or a discount. Unlike subjective opinions about a company’s future, the P/E ratio provides objective, quantifiable data.
Why the P/E Ratio Matters in Stock Analysis
The PE ratio serves three critical functions in investment analysis:
- Valuation benchmark: It reveals whether a stock appears expensive or cheap relative to its earnings power
- Comparative tool: Investors use P/E ratios to compare companies within the same industry or against broader market indices
- Market sentiment indicator: High P/E ratios reflect optimism about future growth, while low ratios may signal pessimism or undervaluation
The relationship between price and earnings creates a direct mathematical connection. When stock prices rise faster than earnings, P/E ratios expand. When earnings grow faster than prices, P/E ratios contract. This dynamic reveals the market’s collective assessment of a company’s prospects.
Insight: The P/E ratio transforms abstract stock prices into concrete valuation metrics. A $500 stock isn’t necessarily expensive, and a $5 stock isn’t automatically cheap. The PE ratio provides the context that raw prices cannot.
How to Calculate the P/E Ratio: Step-by-Step Formula
Calculating the P/E ratio requires two data points: the current stock price and earnings per share. Both figures are readily available through financial websites, brokerage platforms, and company financial statements.
The Basic Calculation
Step 1: Identify the current stock price
- Check any financial website or your brokerage account
- Use the most recent closing price for accuracy
Step 2: Determine earnings per share (EPS)
- Find EPS on the company’s income statement
- Use trailing twelve months (TTM) earnings for the current P/E
- Or use projected earnings for forward P/E
Step 3: Divide price by EPS
- PE Ratio = Stock Price ÷ EPS
Practical Example
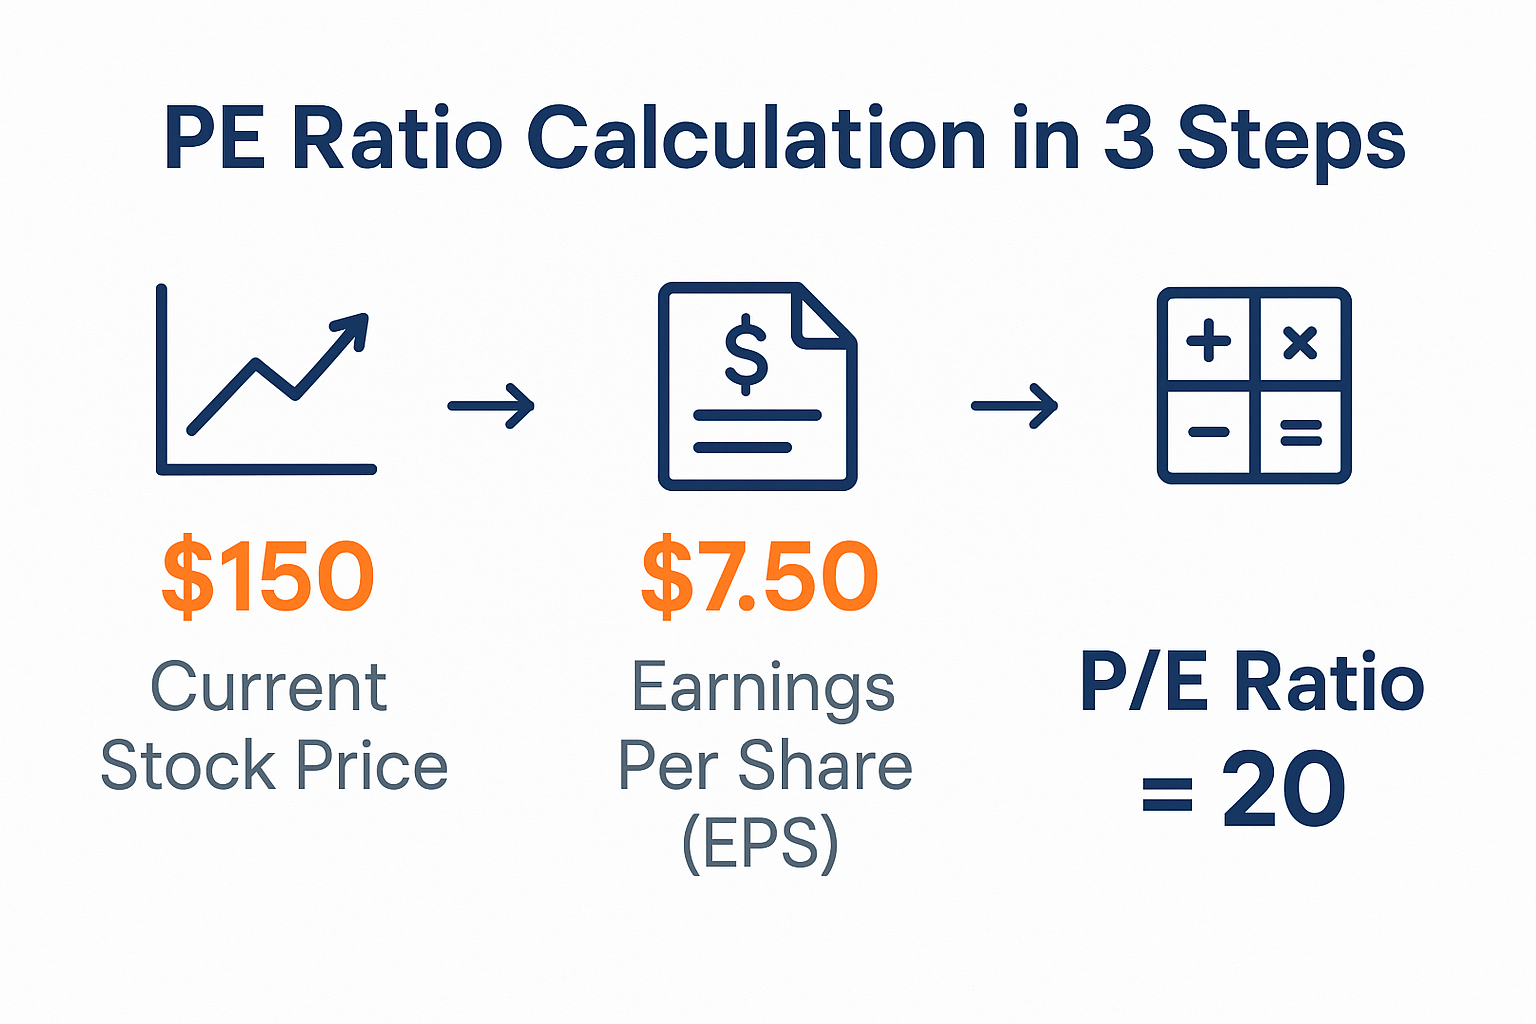
Consider a hypothetical company, TechGrowth Inc:
- Current stock price: $150
- Trailing twelve-month EPS: $7.50
- PE ratio calculation: $150 ÷ $7.50 = 20
This PE of 20 means investors pay $20 for each $1 of TechGrowth’s annual earnings. Whether this represents good value depends on industry context, growth expectations, and historical comparisons.
Understanding Earnings Per Share (EPS)
EPS represents the portion of the company’s profit allocated to each outstanding share. Companies calculate EPS using this formula:
EPS = (Net Income – Preferred Dividends) ÷ Weighted Average Shares Outstanding
Most financial platforms display both basic EPS and diluted EPS. Diluted EPS accounts for potential share dilution from stock options, convertible securities, and warrants. Conservative investors prefer using diluted EPS for PE calculations because it reflects potential ownership dilution.
The quality of earnings matters significantly. Companies with consistent, growing earnings from core operations deserve higher P/E multiples than businesses with volatile or declining accounting profit.
Trailing P/E Ratio vs Forward P/E Ratio: Key Differences
The PE ratio comes in two primary variations: trailing and forward. Each serves distinct analytical purposes and carries different reliability profiles.
Trailing PE Ratio (TTM PE)
The trailing P/E ratio uses actual reported earnings from the past twelve months. This backward-looking metric relies on verified financial data rather than projections.
Advantages of trailing P/E:
- Based on real, audited financial results
- Eliminates estimation errors and analyst bias
- Provides objective historical performance data
- Useful for stable, mature companies with predictable earnings
Limitations of trailing P/E:
- Doesn’t account for recent business changes
- May not reflect current economic conditions
- Less useful for rapidly growing or declining companies
- Historical earnings don’t guarantee future performance
Forward P/E Ratio (Projected P/E)
The forward P/E ratio uses analyst estimates for future earnings, typically for the next twelve months. This forward-looking approach attempts to value companies based on expected performance.
Advantages of forward PE:
- Incorporates growth expectations and future potential
- Adjusts for known upcoming changes in business operations
- More relevant for high-growth companies
- Reflects current analyst consensus
Limitations of forward P/E:
- Relies on estimates that may prove inaccurate
- Subject to analyst bias and forecasting errors
- Can change dramatically as estimates are revised
- Less reliable during economic uncertainty
Which P/E Ratio Should You Use?
The choice between trailing and forward P/E depends on your investment approach and the company’s characteristics:
Use trailing P/E when:
- Analyzing mature, stable companies with predictable earnings
- You want objective, verified data
- Comparing historical valuation trends
- Evaluating value stocks in established industries
Use forward P/E when:
- Analyzing growth companies with rapidly changing earnings
- Recent business developments make historical data less relevant
- You understand the risks of relying on projections
- Comparing growth expectations across similar companies
Many sophisticated investors examine both metrics simultaneously. A large gap between trailing and forward P/E ratios signals either expected growth (forward P/E lower than trailing) or anticipated decline (forward P/E higher than trailing).
Understanding expected return requires incorporating both historical performance and future projections into your analysis.
What Is a Good P/E Ratio? Industry Benchmarks and Context
No universal “good” P/E ratio exists. Valuation context depends on industry dynamics, growth expectations, interest rates, and market conditions. A P/E of 15 might signal overvaluation in one sector and undervaluation in another.
Historical Market Benchmarks
The S&P 500 provides useful baseline data for market-wide P/E expectations:
- Historical average P/E: 20.5 (modern era)
- 2025 current P/E: 37.1
- Premium over average: 80.9%
These numbers reveal that as of 2025, the broader market trades at historically elevated valuations. This doesn’t automatically signal an impending crash, but it does indicate that investors are paying premium prices for earnings.
Traditional P/E Ratio Interpretation
| Growth expectations, market leaders, and competitive advantages | General Interpretation | Typical Characteristics |
|---|---|---|
| 0-10 | Potentially undervalued or distressed | Value stocks, cyclical lows, troubled companies, mature industries |
| 10-20 | Fair to moderate valuation | Established companies, moderate growth, stable earnings |
| 20-30 | Premium valuation | Growth expectations, market leaders, competitive advantages |
| 30+ | High valuation or high growth | Technology, biotech, disruptive businesses, speculative investments |
| Negative | Company losing money | Unprofitable startups, turnaround situations |
Industry-Specific PE Benchmarks
Different industries command different P/E multiples based on growth rates, capital requirements, and risk profiles:
High PE Industries (30+):
- Software and technology services
- Biotechnology and pharmaceuticals
- E-commerce and digital platforms
- Renewable energy and emerging sectors
Moderate PE Industries (15-25):
- Consumer goods and retail
- Healthcare services
- Industrial manufacturing
- Financial services
Low PE Industries (5-15):
- Utilities and infrastructure
- Basic materials and commodities
- Traditional banking
- Mature telecommunications
When evaluating the best stocks to invest in 2025, comparing P/E ratios within the same industry provides more meaningful insights than absolute P/E values.
The Role of Growth in PE Valuation
Growth expectations justify higher P/E ratios through a simple mathematical relationship. A company growing earnings at 25% annually deserves a higher multiple than one growing at 5%, because future earnings will be substantially larger.
This relationship led to the development of the PEG ratio, which we’ll explore in detail in the next section.
Insight: A low P/E ratio doesn’t automatically signal a bargain. Companies facing structural decline, regulatory challenges, or competitive disruption often trade at low multiples for valid reasons. Similarly, high P/E ratios aren’t always overvaluation—they may reflect genuine growth potential and competitive advantages.
The PEG Ratio: Adjusting PE for Growth
The PEG ratio (Price/Earnings-to-Growth ratio) enhances basic PE analysis by incorporating growth expectations. This metric addresses a fundamental limitation of P/E ratios: they don’t account for different growth rates across companies.
PEG Ratio Formula and Calculation
PEG Ratio = P/E Ratio ÷ Annual EPS Growth Rate
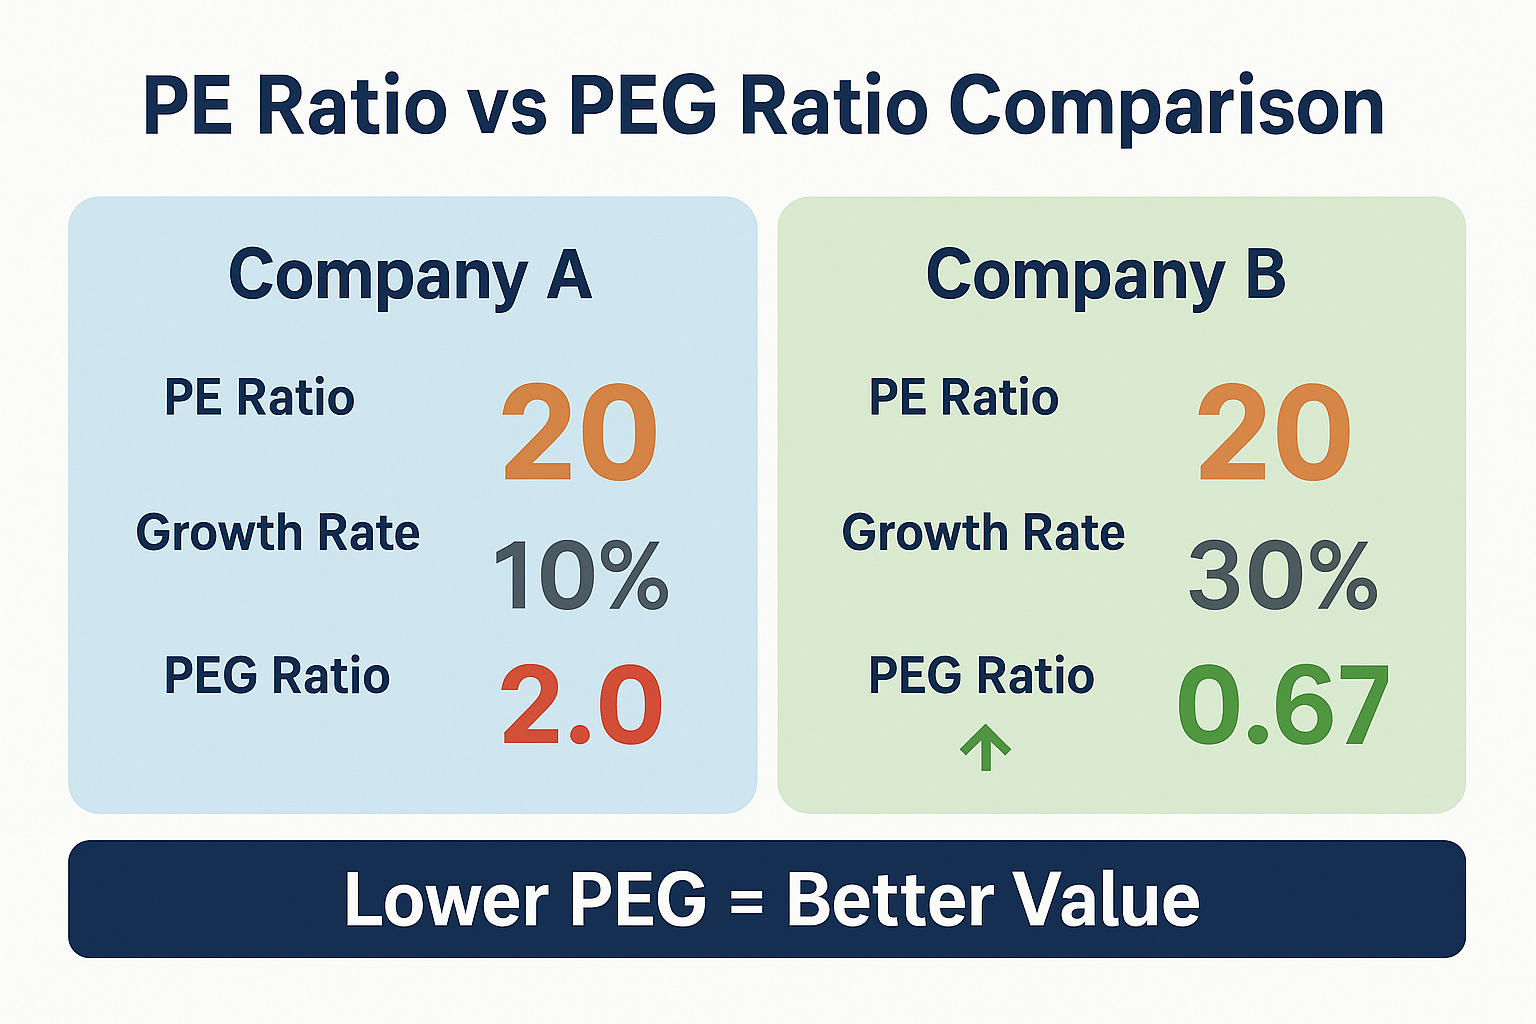
Consider two companies with identical PE ratios of 20:
- Company A: Growing earnings at 10% annually
- Company B: Growing earnings at 30% annually
Company A PEG: 20 ÷ 10 = 2.0
Company B PEG: 20 ÷ 30 = 0.67
Despite identical P/E ratios, Company B appears more attractively valued when growth is factored in. The lower PEG suggests investors aren’t paying a premium for the superior growth rate.
Interpreting PEG Ratios
PEG below 1.0: Potentially undervalued relative to growth prospects
PEG around 1.0: Fair valuation relative to growth
PEG above 1.0: Potentially overvalued relative to growth
These guidelines provide starting points, not absolute rules. Industry context, growth sustainability, and competitive positioning all influence appropriate PEG levels.
PEG Ratio Limitations
While the PEG ratio improves upon basic PE analysis, it carries important limitations:
- Growth rate selection varies: Different analysts use different time periods (1-year, 3-year, 5-year growth rates)
- Assumes linear growth: Real business growth rarely follows straight lines
- Ignores growth quality: Organic growth differs from acquisition-driven expansion
- Doesn’t account for profitability: High growth at low margins may not create value
- Less useful for mature companies: Low-growth businesses often show artificially high PEG ratios
The PEG ratio works best for comparing growth companies within the same industry. It helps identify which high-P/E stocks might justify their valuations through superior growth trajectories.
Investors focused on dividend growth stocks often find PEG ratios less useful than dividend-adjusted valuation metrics.
How to Use P/E Ratios in Stock Valuation
The P/E ratio serves as a starting point for valuation analysis, not a complete investment decision framework. Effective investors combine PE analysis with multiple valuation approaches and qualitative assessments.
Comparative Valuation Approach
P/E ratios work best when comparing similar companies or tracking individual stocks over time:
1. Peer Comparison
Identify 3-5 direct competitors in the same industry. Compare their P/E ratios to identify potential outliers:
- Significantly lower PE: Potential undervaluation or fundamental weakness
- Significantly higher PE: Premium valuation or superior growth prospects
- Similar PE range: Market consensus on sector valuation
2. Historical Comparison
Track a company’s PE ratio over 5-10 years:
- Current PE below historical average: Potential buying opportunity
- Current PE above historical average: Elevated valuation or improved prospects
- Expanding PE trend: Market recognizing improving fundamentals
3. Market Comparison
Compare individual stock PES to broader market indices:
- PE below S&P 500 average: Relative value opportunity
- PE above S&P 500 average: Premium valuation requiring justification
- PE trend versus market: Relative strength or weakness
Combining PE with Other Valuation Metrics
Sophisticated investors never rely on PE ratios in isolation. Comprehensive valuation requires multiple perspectives:
Price-to-Book (P/B) Ratio: Compares stock price to book value per share, useful for asset-heavy businesses
Price-to-Sales (P/S) Ratio: Evaluates valuation relative to revenue, helpful for unprofitable growth companies
Enterprise Value: Accounts for debt and cash, providing a complete company valuation
Free Cash Flow Yield: Measures actual cash generation relative to market value
Dividend Yield: For income investors, dividend metrics complement PE analysis
When analyzing dividend stocks, combine PE ratios with payout ratios and dividend growth rates for a complete assessment.
Earnings Quality Considerations
Not all earnings deserve equal PE multiples. High-quality earnings share these characteristics:
Consistent and predictable: Steady earnings growth over multiple years
Cash-backed: Earnings supported by actual cash flow, not just accounting entries
Organic growth: Revenue expansion from core business, not acquisitions
Sustainable margins: Profitability maintained through economic cycles
Conservative accounting: Prudent revenue recognition and expense policies
Companies with high-quality earnings deserve premium P/E multiples. Businesses with volatile, cash-poor, or accounting-dependent earnings warrant discounted valuations.
The Earnings Yield Alternative
Some investors prefer earnings yield (the inverse of P/E ratio) because it enables direct comparison with bond yields:
Earnings Yield = EPS ÷ Stock Price = 1 ÷ PE Ratio
A stock with a PE of 20 has an earnings yield of 5% (1 ÷ 20 = 0.05). This can be compared directly to:
- 10-year Treasury yield
- Corporate bond yields
- Expected returns from alternative investments
When the earnings yield exceeds quality bond yields by a comfortable margin (typically 3-5 percentage points), stocks may offer attractive relative value. This approach integrates equity valuation into broader portfolio allocation decisions.
Common P/E Ratio Mistakes and Misconceptions
Even experienced investors fall into common traps when interpreting P/E ratios. Avoiding these mistakes improves investment decision-making.
Mistake #1: Assuming Lower PE Always Means Better Value
The misconception: “This stock has a PE of 8 while its competitor trades at 15. It must be undervalued!”
The reality: Low PE ratios often reflect genuine business challenges:
- Declining industry facing structural headwinds
- Company-specific operational problems
- Regulatory or legal risks
- Technological disruption threats
- Poor management or governance issues
A stock trading at a P/E of 8 when industry peers average 15 deserves investigation, not automatic purchase. The market frequently prices in known risks correctly.
Mistake #2: Ignoring Cyclical Business Dynamics
Cyclical companies (automotive, construction, commodities) show dramatically different P/E ratios at different points in the economic cycle:
At cycle peaks:
- Earnings temporarily high
- PE ratios appear low (price ÷ high earnings)
- Trap: Buying based on low PE right before earnings collapse
At cycle troughs:
- Earnings temporarily depressed
- PE ratios appear high (price ÷ low earnings)
- Opportunity: Selling based on high PE right before recovery
For cyclical businesses, use normalized earnings (average earnings across the full cycle) rather than current earnings for more accurate PE calculations.
Mistake #3: Comparing PE Ratios Across Different Industries
Comparing a utility company’s PE of 12 to a software company’s PE of 40 provides little useful information. Different industries operate under different economic models:
Capital-intensive industries (utilities, telecommunications): Lower PE ratios reflect:
- Slower growth rates
- Higher capital requirements
- Regulated returns
- Mature market dynamics
Asset-light industries (software, services): Higher PE ratios reflect:
- Faster growth potential
- Scalable business models
- Lower capital needs
- Innovation opportunities
Always compare companies within the same industry or against industry-specific benchmarks.
Mistake #4: Overlooking Accounting Manipulation
Earnings can be manipulated through aggressive accounting practices:
- Premature revenue recognition
- Understating expenses
- Capitalizing costs that should be expensed
- Channel stuffing
- Non-recurring gains are presented as operational income
A suspiciously low P/E ratio combined with deteriorating cash flow often signals earnings quality problems. Cross-reference P/E analysis with cash flow metrics and balance sheet health.
Mistake #5: Ignoring Interest Rate Environment
P/E ratios don’t exist in a vacuum—they respond to the broader interest rate environment:
Low interest rate periods: Higher P/E ratios become justified because:
- Lower discount rates increase the present value of future earnings
- Bonds offer a less attractive alternative to returns
- Cost of capital decreases, improving profitability
High interest rate periods: Lower P/E ratios become normal because:
- Higher discount rates reduce the present value of future earnings
- Bonds offer competitive alternative returns
- Cost of capital increases, pressuring profitability
The 2025 market PE of 37.1 must be evaluated in the context of current interest rates, inflation expectations, and alternative investment yields.
Insight: The P/E ratio is a tool, not a decision. It raises questions that require deeper analysis. A low PE might signal opportunity or danger. A high PE might indicate overvaluation or a justified growth premium. Context, comparison, and comprehensive analysis determine which interpretation applies.
P/E Ratio in Different Market Conditions
Market cycles dramatically influence appropriate PE valuations. Understanding how PE ratios behave across different economic environments improves investment timing and risk management.
Bull Markets and PE Expansion
During bull markets, PE ratios typically expand as investor optimism grows:
Characteristics of bull market PE expansion:
- Stock prices rise faster than earnings growth
- Forward P/E ratios incorporate optimistic growth assumptions
- Market-wide PE ratios exceed historical averages
- Investors willingly pay premium multiples
Investment implications:
- Higher P/E ratios don’t automatically signal sell signals in strong economies
- Focus on companies with earnings growth supporting valuation
- Monitor PE expansion rate versus earnings growth rate
- Maintain diversification as valuations stretch
The current 2025 S&P 500 PE of 37.1 reflects an extended bull market environment where investors have bid up valuations significantly above historical norms.
Bear Markets and PE Compression
Bear markets cause PE compression as pessimism and risk aversion dominate:
Characteristics of bear market PE compression:
- Stock prices fall faster than earnings decline
- Forward P/E ratios incorporate pessimistic assumptions
- Market-wide PE ratios drop below historical averages
- Investors demand discounts for perceived risk
Investment implications:
- Lower PE ratios create value opportunities for patient investors
- Quality companies trading at depressed multiples offer the best risk/reward
- PE compression often overshoots fundamental deterioration
- Gradual accumulation strategies work well
Historical data show that buying when market PE ratios fall below 15 has produced superior long-term returns.
Recession Periods
Recessions create unique PE ratio dynamics:
Early recession:
- Earnings begin declining
- Stock prices often fall faster (anticipating worse to come)
- PE ratios may appear reasonable despite falling prices
Mid-recession:
- Earnings reach trough levels
- PE ratios appear artificially high (low earnings denominator)
- Best buying opportunities often occur here
Late recession/early recovery:
- Earnings begin recovering
- PE ratios normalize
- Stock prices typically lead earnings recovery
Investors using PE ratios during recessions should focus on normalized earnings power rather than trough earnings levels.
Growth vs. Value Cycles
Market leadership rotates between growth stocks (high PE) and value stocks (low PE):
Growth leadership periods:
- High-PE technology and innovation stocks outperform
- Investors prioritize revenue growth over current profitability
- PE expansion drives returns
- Best growth stocks command premium multiples
Value leadership periods:
- Low-PE established companies outperform
- Investors prioritize cash flow and dividends over growth
- PE compression in growth stocks, expansion in value
- Dividend aristocrats and mature businesses attract capital
Understanding these cycles helps investors position portfolios appropriately. Neither growth nor value maintains permanent leadership—cycles alternate over time.
Advanced P/E Ratio Concepts
Beyond basic PE analysis, sophisticated investors employ advanced techniques to extract deeper insights from earnings multiples.
Shiller P/E Ratio (CAPE)
The Cyclically Adjusted Price-to-Earnings ratio (CAPE or Shiller PE) uses inflation-adjusted earnings averaged over 10 years:
CAPE = Current Price ÷ 10-Year Average Inflation-Adjusted Earnings
This approach smooths cyclical earnings volatility and provides more stable valuation benchmarks. The CAPE ratio has proven particularly effective for predicting long-term market returns.
Historical CAPE insights:
- CAPE above 30: Associated with below-average subsequent 10-year returns
- CAPE below 15: Associated with above-average subsequent 10-year returns
- Current 2025 levels: Elevated relative to historical norms
Sector-Adjusted P/E Analysis
Rather than comparing absolute PE ratios, calculate relative PE positions:
Relative PE = Company PE ÷ Sector Average PE
A relative PE of 1.2 means the company trades at a 20% premium to sector peers. Tracking relative PE over time reveals:
- Whether the premium/discount is expanding or contracting
- Market recognition of competitive advantages or disadvantages
- Potential mean reversion opportunities
PE Ratio and Capital Allocation
Companies with identical PE ratios may deserve different valuations based on capital allocation strategies:
Superior capital allocators:
- Reinvest earnings at high returns on invested capital
- Make accretive acquisitions
- Return excess cash through buybacks and dividends
- Deserve premium PE multiples
Poor capital allocators:
- Destroy value through bad acquisitions
- Maintain excessive cash hoards earning minimal returns
- Invest in low-return projects
- Warrant discounted PE multiples
Management quality and capital allocation discipline justify PE premium or discount beyond simple earnings analysis.
International PE Comparisons
Comparing PE ratios across countries requires adjusting for:
- Accounting standards: GAAP vs. IFRS differences
- Tax rates: Higher corporate taxes reduce reported earnings
- Growth rates: Emerging markets often justify higher PEs
- Risk premiums: Political and currency risks affect valuations
- Interest rates: Vary significantly across economies
A PE of 15 in a high-growth emerging market may represent relative overvaluation, while the same PE in a mature, low-growth economy might signal opportunity.
P/E Ratio Calculation Tools and Resources
Modern investors access PE ratio data through multiple platforms and tools, each offering different features and analytical capabilities.
Where to Find P/E Ratio Data
Free resources:
- Yahoo Finance: Provides trailing and forward P/E for all publicly traded stocks
- Google Finance: Basic PE data with a clean interface
- Morningstar: PE ratios plus comprehensive fundamental analysis
- Company investor relations pages: Official financial data and presentations
- SEC EDGAR database: Raw financial statements for independent calculation
Premium platforms:
- Bloomberg Terminal: Professional-grade data with historical P/E trends
- FactSet: Institutional research platform with detailed valuation metrics
- S&P Capital IQ: Comprehensive financial data and peer comparisons
- Koyfin: Advanced charting and valuation screening tools
Screening for P/E Ratio Opportunities
Stock screeners enable filtering thousands of stocks by PE criteria:
Value screening approach:
- P/E ratio < 15
- Positive earnings growth (past 5 years)
- Debt-to-equity < 0.5
- Return on equity > 12%
- Dividend yield > 2%
Growth at a reasonable price (GARP) screening:
- PEG ratio < 1.5
- Earnings growth > 15%
- P/E ratio < sector average × 1.2
- Revenue growth > 10%
- Positive free cash flow
Quality at fair value screening:
- P/E ratio between 15-25
- Return on invested capital > 15%
- Consistent earnings growth (10 consecutive years)
- Strong balance sheet (current ratio > 1.5)
- Competitive moat indicators
Building a P/E Ratio Tracking Spreadsheet
Create a simple tracking system to monitor P/E ratios over time:
Essential columns:
- Company name and ticker
- Current stock price
- Trailing twelve-month EPS
- Current PE ratio
- 5-year average PE
- Sector average PE
- Relative PE (company PE ÷ sector PE)
- PEG ratio
- Date of analysis
Update quarterly after earnings releases to track valuation trends and identify opportunities as they emerge.
For investors building passive income through dividends, add dividend yield and payout ratio columns to integrate income metrics with valuation analysis.
Real-World PE Ratio Examples and Case Studies
Examining actual companies demonstrates how PE ratios function in practice and reveals the importance of context in interpretation.
Case Study 1: Technology Growth Stock
Company Profile: High-growth cloud software company
- Current PE ratio: 45
- 5-year average PE: 52
- Sector average PE: 38
- Revenue growth: 35% annually
- PEG ratio: 1.3
Analysis: Despite appearing expensive at 45× earnings, this company trades below its historical average and only slightly above sector peers. The 35% revenue growth partially justifies the premium multiple, though the PEG ratio above 1.0 suggests limited margin of safety. Investors should monitor whether growth rates can sustain the valuation.
Case Study 2: Mature Dividend Payer
Company Profile: Established consumer goods manufacturer
- Current PE ratio: 18
- 5-year average PE: 21
- Sector average PE: 19
- Earnings growth: 4% annually
- Dividend yield: 3.8%
Analysis: Trading slightly below both historical and sector averages, this company offers modest value. The low growth rate limits upside, but the substantial dividend yield provides income while waiting for potential P/E expansion. Total return expectations should remain moderate given the mature business profile.
Case Study 3: Cyclical Value Trap
Company Profile: Automotive manufacturer
- Current PE ratio: 6
- 5-year average PE: 12
- Sector average PE: 9
- Recent earnings: Record high
- Industry outlook: Peak cycle
Analysis: The extremely low P/E ratio appears attractive but reflects peak cyclical earnings. As the automotive cycle turns, earnings will likely decline significantly, causing the P/E ratio to expand even if the stock price falls. This represents a classic value trap where low P/E signals danger rather than opportunity.
Case Study 4: Turnaround Situation
Company Profile: Retail chain undergoing transformation
- Current PE ratio: Negative (company unprofitable)
- Projected PE (2 years out): 15
- Sector average PE: 18
- Turnaround progress: Early stages
Analysis: Current negative earnings make P/E ratio analysis impossible. Investors must evaluate the turnaround thesis independently of PE metrics. If successful, the company could trade at sector-average multiples within 2-3 years, creating significant upside. However, turnaround investments carry elevated risk.
These examples demonstrate that PE ratio interpretation requires understanding business context, industry dynamics, and economic cycles. Numbers alone never tell the complete story.
Integrating PE Ratios Into Your Investment Strategy
The P/E ratio serves as one component of a comprehensive investment framework. Successful investors integrate PE analysis with broader financial literacy and disciplined processes.
Building a Valuation Framework
Create a systematic approach to stock evaluation:
Step 1: Initial screening
- Use PE and PEG ratios to identify potential candidates
- Filter for reasonable valuations relative to growth and sector
Step 2: Quality assessment
- Analyze business model and competitive advantages
- Review management track record and capital allocation
- Evaluate balance sheet strength and cash flow quality
Step 3: Valuation analysis
- Calculate intrinsic value using multiple methods
- Compare PE to historical ranges and peer companies
- Assess the margin of safety between price and value
Step 4: Risk evaluation
- Identify key business and financial risks
- Determine position sizing based on conviction and risk
- Establish price targets and exit criteria
Position Sizing Based on PE Valuation
Adjust position sizes based on valuation comfort:
Deeply undervalued (PE significantly below fair value):
- Larger position sizes (3-5% of portfolio)
- Higher conviction allocation
- Longer holding period intention
Fairly valued (PE near historical/sector averages):
- Standard position sizes (2-3% of portfolio)
- Moderate conviction
- Monitor for changes in fundamentals or valuation
Overvalued (PE significantly above fair value):
- Smaller position sizes (1-2% of portfolio) or avoid
- Require exceptional growth visibility
- Shorter holding period or tactical approach
This approach aligns position sizing with valuation-based risk assessment, a core principle of risk management in portfolio construction.
Combining PE Analysis with Dollar-Cost Averaging
For long-term investors, dollar-cost averaging can be enhanced with P/E awareness:
Standard DCA: Invest fixed amounts at regular intervals regardless of price
PE-adjusted DCA: Increase investment amounts when P/E ratios fall below historical averages, decrease when P/E ratios exceed historical ranges
This modified approach maintains the behavioral benefits of systematic investing while incorporating valuation discipline.
When to Ignore P/E Ratios
Certain situations make P/E ratios less useful or misleading:
Unprofitable companies: Negative earnings create meaningless P/E ratios
Turnaround situations: Historical earnings don’t reflect future potential
Asset plays: Companies valued for assets rather than earnings power
Deep value situations: Liquidation value exceeds market capitalization
Special situations: Mergers, spinoffs, and restructurings create temporary distortions
In these cases, alternative valuation approaches (price-to-book, price-to-sales, sum-of-parts, discounted cash flow) provide better frameworks.
Understanding when PE ratios apply and when they don’t separates sophisticated investors from those who mechanically apply formulas without context.
Conclusion: Making PE Ratios Work for Your Investment Strategy
The P/E ratio represents one of the most accessible yet powerful tools in stock valuation. It distills complex business performance into a single, comparable metric that reveals how the market values each dollar of corporate earnings.
Yet as this comprehensive guide demonstrates, the P/E ratio is a starting point for analysis, not a destination. The math behind money requires understanding context, comparison, and causation—not just calculation.
Key principles for effective P/E ratio analysis:
Always compare within context: Industry peers, historical ranges, and growth expectations matter more than absolute PE values
Combine multiple metrics: Use PE alongside PEG, earnings yield, cash flow analysis, and balance sheet strength for comprehensive valuation.
Understand the business: High-quality earnings from sustainable competitive advantages deserve premium multiples.
Recognize limitations: PE ratios don’t work well for unprofitable companies, cyclical businesses at extremes, or asset-heavy industries.
Monitor trends over time: PE expansion or compression reveals changing market sentiment and valuation dynamics.
The current 2025 market environment, with the S&P 500 PE at 37.1—significantly above the historical average of 20.5—demands particular attention to valuation discipline. Elevated P/E ratios don’t automatically signal an impending crash, but they do indicate that investors are paying premium prices for earnings.
Your Next Steps
Building wealth through evidence-based investing requires continuous learning and disciplined application of investing fundamentals:
- Calculate PE ratios for your current holdings: Understand whether you own fairly valued, premium, or discounted assets
- Build a watchlist with PE tracking: Monitor valuation changes quarterly to identify opportunities
- Compare PE ratios within industries: Develop sector-specific benchmarks for your investment universe
- Integrate PE analysis with comprehensive research: Combine quantitative metrics with qualitative business assessment
- Practice valuation discipline: Avoid overpaying for even excellent companies
The P/E ratio won’t guarantee investment success, but it provides essential data for making informed decisions. When combined with patience, diversification, and a long-term perspective, PE-based valuation analysis becomes a powerful component of wealth-building strategy.
Understanding the P/E ratio transforms you from a stock price speculator into a business value investor. That shift in perspective—from watching prices to analyzing earnings power—represents the foundation of sustainable, evidence-based wealth creation.
📊 PE Ratio Calculator
Calculate Price-to-Earnings ratio and PEG ratio instantly
💡 Interpretation
Author Bio
Max Fonji is a data-driven financial educator and the voice behind The Rich Guy Math. With a background in financial analysis and a passion for teaching investing fundamentals, Max breaks down complex financial concepts into clear, actionable insights. His analytical approach combines rigorous quantitative methods with practical investment wisdom, helping readers understand the math behind money and build wealth through evidence-based strategies.
Educational Disclaimer
This article is provided for educational and informational purposes only. It does not constitute financial advice, investment recommendations, or an offer to buy or sell any securities. The PE ratio analysis and examples presented are for illustrative purposes and should not be interpreted as specific investment guidance.
Stock market investing involves risk, including the potential loss of principal. Past performance does not guarantee future results. P/E ratios represent one analytical tool among many and should not be used in isolation for investment decisions.
Before making any investment decisions, consult with a qualified financial advisor who understands your specific financial situation, goals, risk tolerance, and time horizon. Always conduct thorough due diligence and consider multiple valuation approaches when evaluating potential investments.
The market data and P/E ratios cited in this article reflect conditions as of 2025 and will change over time. Readers should verify current data before making investment decisions.
References
[1] S&P Dow Jones Indices. “S&P 500 Earnings and Estimates.” S&P Global, 2025.
[2] Shiller, Robert J. “Cyclically Adjusted Price-to-Earnings Ratio.” Yale University Department of Economics, 2025.
[3] CFA Institute. “Equity Valuation: Applications and Processes.” CFA Program Curriculum, 2025.
[4] Morningstar. “Understanding Price-to-Earnings Ratios.” Morningstar Investment Research, 2025.
[5] U.S. Securities and Exchange Commission. “Beginners’ Guide to Financial Statements.” SEC Investor Education, 2025.
[6] Graham, Benjamin, and Dodd, David. “Security Analysis.” McGraw-Hill Education, Classic Edition.
[7] Federal Reserve Economic Data (FRED). “Stock Market Valuations and Interest Rates.” Federal Reserve Bank of St. Louis, 2025.
[8] Financial Accounting Standards Board (FASB). “Earnings Per Share Calculation Standards.” FASB Accounting Standards Codification, 2025
FAQ:
What does a P/E ratio of 20 mean?
A P/E ratio of 20 means investors pay $20 for every $1 of annual earnings the company generates. It can also be viewed as a 20-year payback period—the years of current earnings needed to recover the purchase price if you owned the entire company and received all profits.
Is a high P/E ratio good or bad?
A high P/E ratio is not automatically good or bad. High P/Es may signal strong growth expectations, competitive advantages, or market optimism. But they can also indicate overvaluation. Always compare a company’s P/E with industry peers, its historical averages, and its growth rate to decide whether the valuation is justified.
What is a good P/E ratio for stocks in 2025?
There is no universal “good” P/E ratio because it varies by sector, growth potential, and market conditions. In general, P/E ratios between 15–25 are typical for established companies. High-growth tech companies may justify P/Es of 30–50+, while mature sectors like utilities often trade at 10–15. Always compare within the same industry.
How do you know if a stock is overvalued using the P/E ratio?
A stock may be overvalued if its P/E ratio exceeds: (1) its 5–10 year historical average, (2) the industry average, (3) the market average (e.g., S&P 500), and (4) the PEG ratio relative to expected earnings growth. If the P/E is high without strong growth, competitive advantages, or improving fundamentals, overvaluation is likely.
What is the difference between trailing P/E and forward P/E?
Trailing P/E uses actual earnings from the last 12 months and provides objective historical data. Forward P/E uses analyst estimates for the next 12 months, offering insight into expected growth but with added uncertainty. Smart investors review both to understand past performance and future expectations.
Can the P/E ratio be negative?
Yes. P/E ratios turn negative when a company reports negative earnings. A negative P/E has no real valuation meaning, so investors use alternative metrics such as Price-to-Sales, Price-to-Book, or discounted cash flow analysis for unprofitable companies.
Why do tech stocks have higher P/E ratios?
Tech stocks often carry higher P/E ratios because they typically show stronger revenue and earnings growth, scalable business models, lower marginal costs, higher long-term margins, and network-effects potential. Investors pay more for companies with faster growth and stronger competitive advantages.