
When a business faces unexpected expenses or a sudden cash crunch, inventory won’t save it. A warehouse full of products means nothing if creditors demand payment tomorrow and those goods take months to sell.
This is why savvy investors and financial analysts rely on the Quick Ratio, a liquidity metric that reveals whether a company can survive short-term financial pressure using only its most liquid assets. Unlike broader measures that include inventory, the Quick Ratio shows the math behind a company’s immediate financial resilience.
Understanding this fundamental ratio transforms how investors evaluate business health, assess risk, and make data-driven decisions about where to allocate capital.
Key Takeaways
- The Quick Ratio measures a company’s ability to cover short-term liabilities using only highly liquid assets, excluding inventory and prepaid expenses
- A Quick Ratio of 1.0 or higher indicates sufficient liquidity to meet immediate obligations without selling inventory
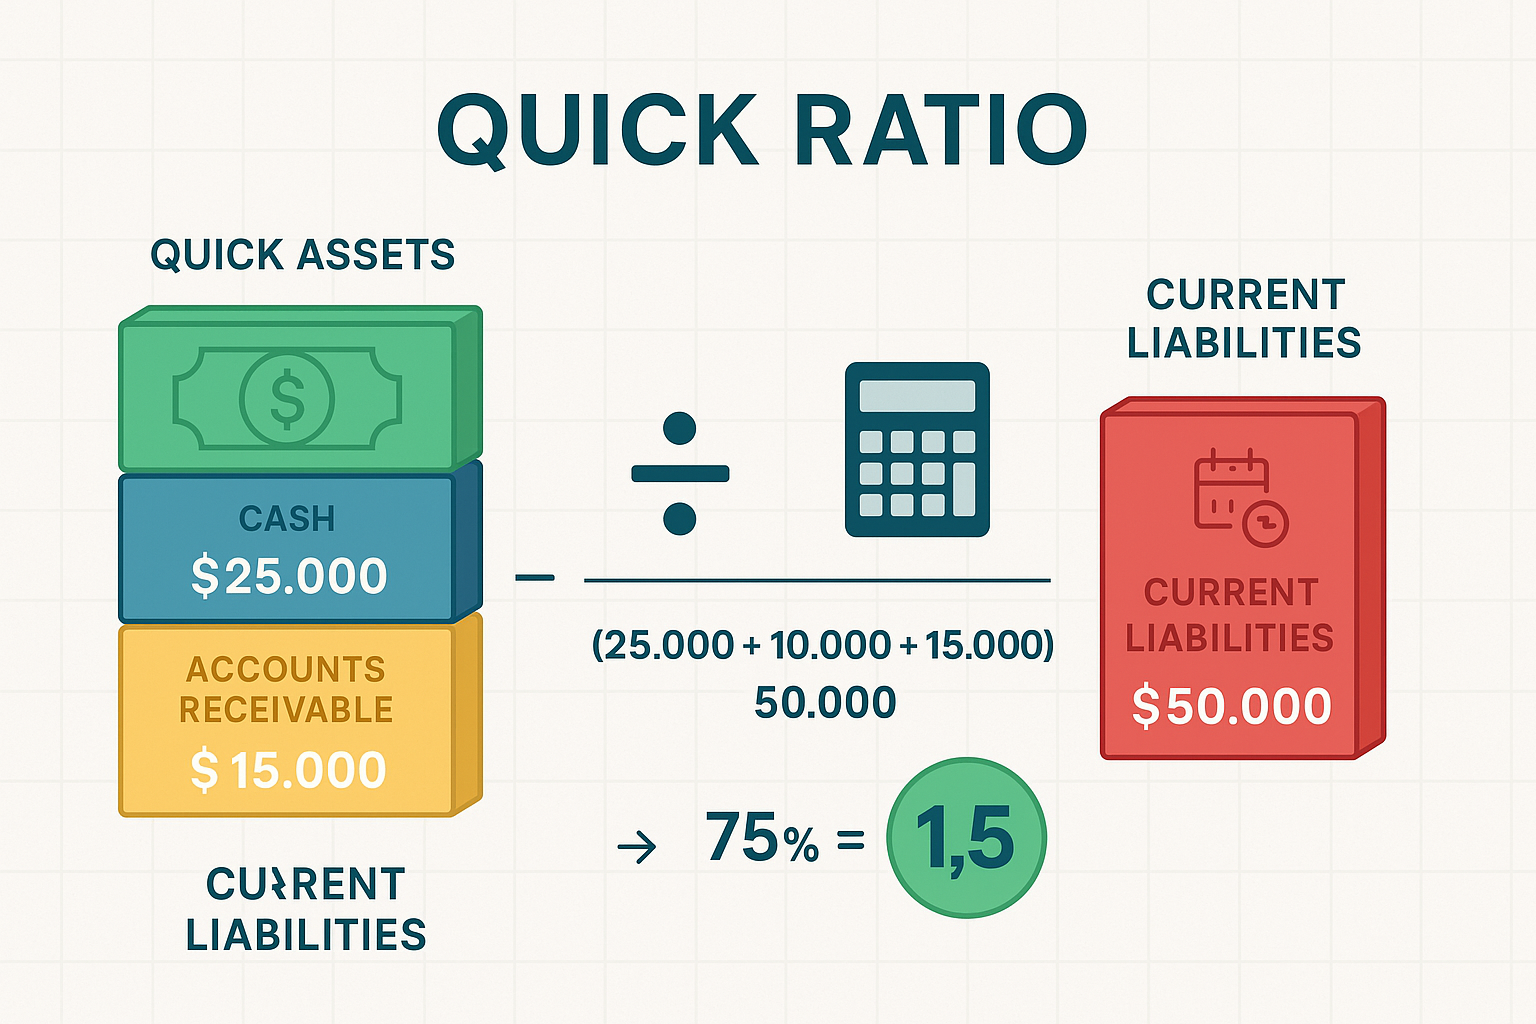
- The formula is: (Cash + Marketable Securities + Accounts Receivable) ÷ Current Liabilities
- This metric is more conservative than the Current Ratio because it excludes assets that cannot be quickly converted to cash
- Industry context matters; acceptable Quick Ratios vary significantly across different business sectors
What Is the Quick Ratio?
The Quick Ratio, also called the acid-test ratio or liquidity ratio, measures a company’s capacity to pay short-term obligations using only its most liquid assets.
Think of it as a financial stress test. If every creditor demanded payment tomorrow, could the company survive without liquidating inventory at fire-sale prices?
The Quick Ratio answers this question with mathematical precision. It focuses exclusively on assets that convert to cash within days or weeks, not months. This conservative approach reveals true financial flexibility during crisis moments.
Why “Quick” and “Acid-Test”?
The term “quick” refers to assets that quickly become cash. The “acid-test” name comes from gold mining, where miners used acid to test whether the metal was genuine gold or worthless ore. Similarly, this ratio tests whether a company’s liquidity is genuine or inflated by slow-moving inventory.
Financial analysts developed this metric because the Current Ratio can be misleading. A company might show strong current assets on paper while holding massive amounts of unsellable inventory.
The Quick Ratio cuts through this illusion by excluding inventory entirely. It reveals the unvarnished truth about immediate payment capacity.
Quick Assets vs Current Assets
Quick assets represent the subset of current assets that convert to cash almost immediately:
- Cash and cash equivalents (checking accounts, money market funds)
- Marketable securities (stocks, bonds, Treasury bills that trade actively)
- Accounts receivable (money customers owe, typically collected within 30-90 days)
Current assets include everything above, plus:
- Inventory (products waiting to be sold)
- Prepaid expenses (insurance, rent paid in advance)
The difference matters because inventory requires finding buyers, negotiating prices, and completing sales, processes that take time and often require discounts. Prepaid expenses cannot be converted back to cash at all.
This distinction makes the Quick Ratio a superior measure of liquidity for risk management purposes.
The Quick Ratio Formula Explained
Two formulas calculate the Quick Ratio, both producing identical results:
Primary Formula (Additive Method)
Quick Ratio = (Cash + Cash Equivalents + Marketable Securities + Accounts Receivable) ÷ Current Liabilities
This formula explicitly lists each liquid asset category, making it easier to understand which components create liquidity.
Alternative Formula (Subtractive Method)
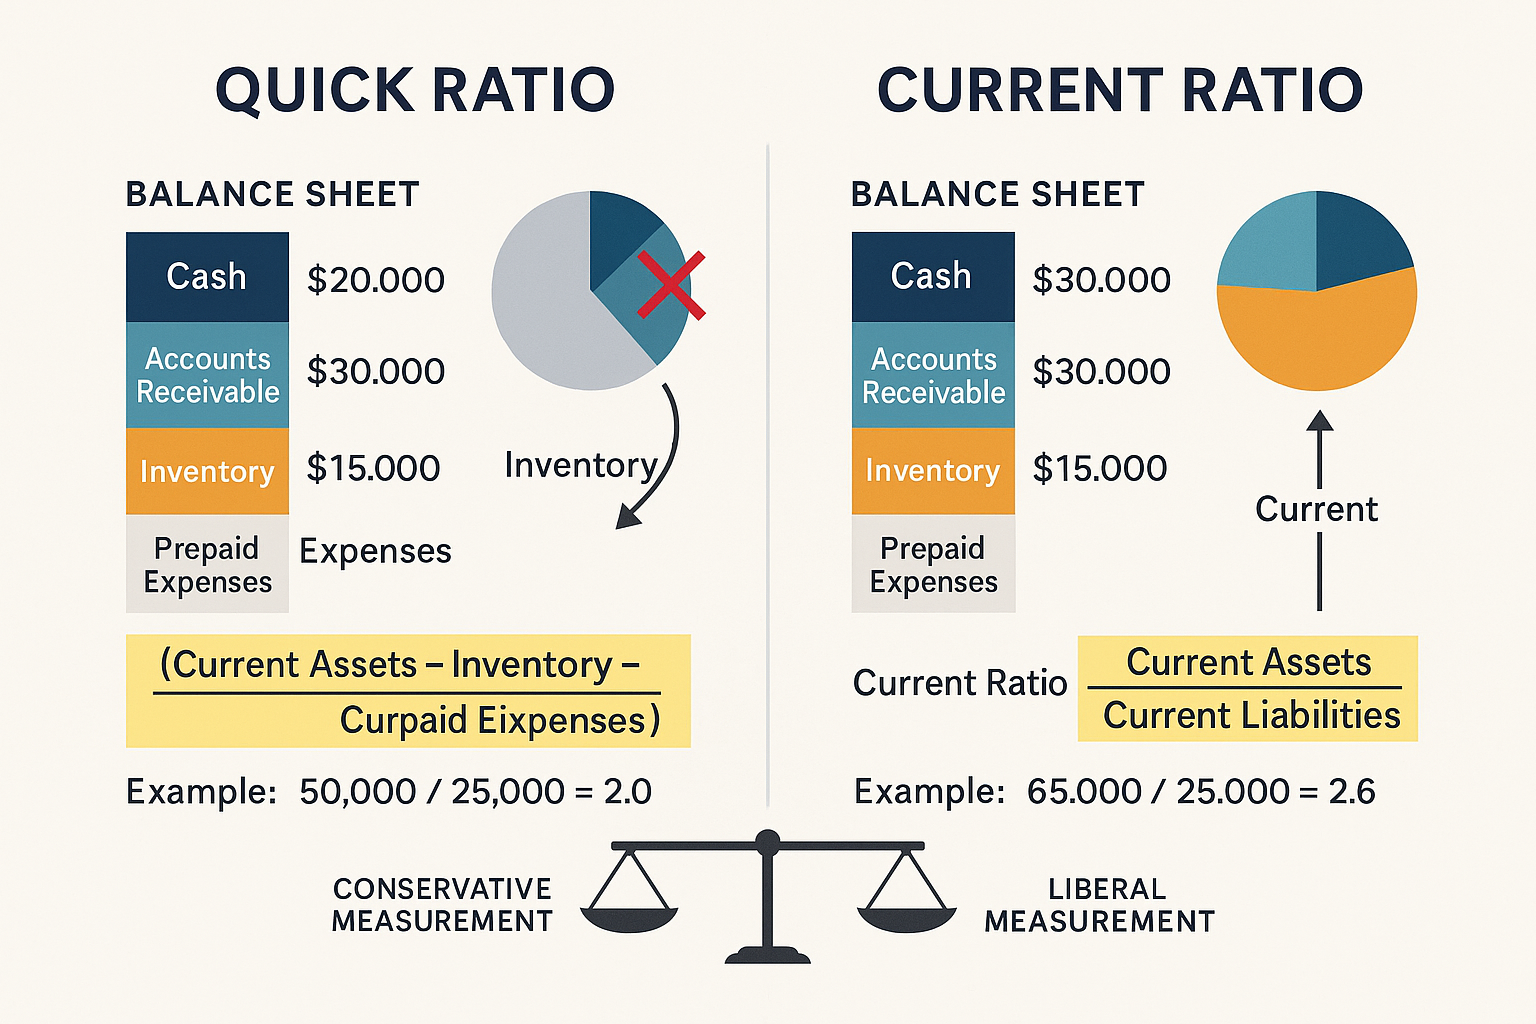
Quick Ratio = (Current Assets – Inventory – Prepaid Expenses) ÷ Current Liabilities
This version starts with total current assets and removes illiquid items. Many analysts prefer this approach when working with balance sheet data because it requires fewer line items.
Both formulas produce the same result. Choose whichever fits your data source and analytical workflow.
Formula Components Breakdown
Let’s examine each element:
Numerator (Quick Assets):
- Cash & Cash Equivalents: Physical currency, checking accounts, savings accounts, and instruments convertible to cash within 90 days
- Marketable Securities: Publicly traded stocks and bonds that can be sold within days on active markets
- Accounts Receivable: Money owed by customers for goods or services already delivered
Learn more about accounts receivable and how they differ from accounts payable in our detailed guides.
Denominator (Current Liabilities):
All obligations due within one year:
- Accounts payable (money owed to suppliers)
- Short-term debt and credit lines
- Accrued expenses (wages, taxes, interest)
- Current portion of long-term debt
The denominator represents the financial pressure a company faces in the near term. The numerator shows the resources available to meet that pressure.
Practical Calculation Example
Consider a retail company with these balance sheet figures:
| Account | Amount |
|---|---|
| Cash | $150,000 |
| Marketable Securities | $75,000 |
| Accounts Receivable | $225,000 |
| Inventory | $400,000 |
| Prepaid Expenses | $25,000 |
| Total Current Assets | $875,000 |
| Accounts Payable | $180,000 |
| Short-term Debt | $120,000 |
| Accrued Expenses | $50,000 |
| Total Current Liabilities | $350,000 |
Using the Primary Formula:
Quick Ratio = ($150,000 + $75,000 + $225,000) ÷ $350,000
Quick Ratio = $450,000 ÷ $350,000
Quick Ratio = 1.29
Using the Alternative Formula:
Quick Ratio = ($875,000 – $400,000 – $25,000) ÷ $350,000
Quick Ratio = $450,000 ÷ $350,000
Quick Ratio = 1.29
Both methods confirm this company has $1.29 in liquid assets for every $1.00 of current liabilities, a comfortable liquidity position.
How to Interpret Quick Ratio Results
Numbers without context create confusion. A Quick Ratio of 0.8 might signal danger for one company but represent normal operations for another.
Interpretation requires understanding benchmarks, industry norms, and business models.
The Benchmark: 1.0 as the Critical Threshold
Quick Ratio = 1.0 represents the equilibrium point where liquid assets exactly match current liabilities.
- Below 1.0: The company lacks sufficient liquid assets to cover short-term obligations without selling inventory or securing additional financing
- At 1.0: The company can precisely meet current liabilities using quick assets alone
- Above 1.0: The company maintains a liquidity cushion and can handle unexpected expenses or revenue disruptions
This benchmark provides a starting point, but context determines whether any specific ratio signals strength or weakness.
Interpretation Zones
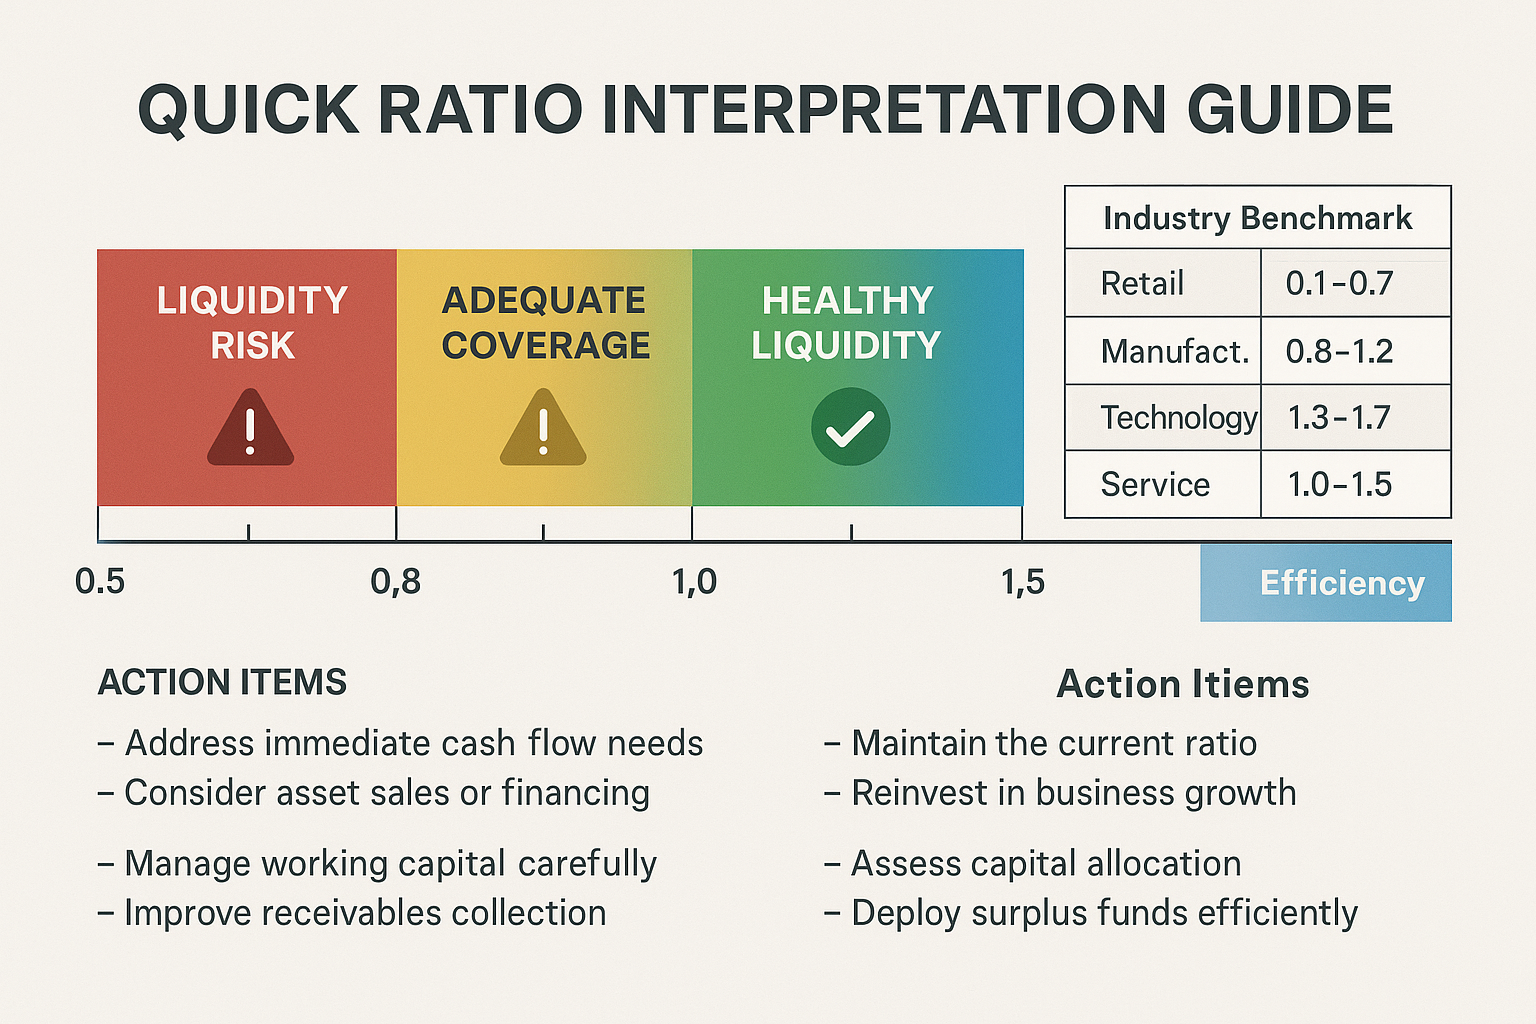
Critical Zone (Below 0.5)
Severe liquidity risk. The company has less than 50 cents in liquid assets for every dollar of short-term debt. This situation demands immediate attention, either raising capital, restructuring debt, or dramatically improving cash conversion.
Caution Zone (0.5 – 1.0)
Moderate liquidity concern. The company can cover some but not all current liabilities with quick assets. Management must monitor cash flow closely and maintain access to credit lines. Many businesses operate successfully in this range, especially those with predictable revenue and strong vendor relationships.
Healthy Zone (1.0 – 1.5)
Solid liquidity position. The company maintains sufficient liquid assets to weather short-term disruptions while avoiding excessive cash hoarding. This range typically indicates balanced financial management.
Excess Zone (Above 1.5)
Strong liquidity but potential inefficiency. While financial safety is high, the company may be holding too much cash instead of investing in growth opportunities or returning capital to shareholders. Extremely high ratios sometimes indicate poor capital allocation.
Industry Variations Matter
Different business models require different liquidity levels:
Technology & Software Companies (Typical range: 1.5 – 3.0)
- Minimal inventory
- High cash generation
- Low capital requirements
- Quick Ratios above 2.0 are common and healthy
Retail & Consumer Goods (Typical range: 0.6 – 1.2)
- Heavy inventory investment
- Seasonal cash flow patterns
- Quick Ratios below 1.0 may be acceptable if inventory turns quickly
Manufacturing (Typical range: 0.8 – 1.3)
- Moderate inventory levels
- Longer production cycles
- Quick Ratios near 1.0 indicate adequate liquidity
Service Businesses (Typical range: 1.0 – 2.0)
- Minimal inventory
- Receivables-heavy balance sheets
- Higher Quick Ratios reflect asset-light models
Always compare companies within the same industry. A Quick Ratio of 0.7 might be alarming for a software company, but perfectly normal for a grocery chain with daily inventory turnover.
What the Quick Ratio Reveals (and Hides)
The Quick Ratio Shows:
- Immediate payment capacity
- Financial flexibility during crises
- Conservative liquidity assessment
- Management’s approach to cash management
The Quick Ratio Doesn’t Show:
- Profitability or earnings quality
- Long-term financial health
- Cash flow generation ability
- Quality of receivables (some may be uncollectible)
For comprehensive financial analysis, combine the Quick Ratio with other metrics like the debt-to-equity ratio, cash flow statements, and profitability measures.
Quick Ratio vs Current Ratio: Understanding the Difference
Both ratios measure liquidity, but they answer different questions with different levels of conservatism.
The Current Ratio Formula
Current Ratio = Current Assets ÷ Current Liabilities
This broader measure includes all current assets, cash, securities, receivables, inventory, and prepaid expenses. It provides a general view of near-term financial health but can overstate true liquidity.
Key Differences
| Aspect | Quick Ratio | Current Ratio |
|---|---|---|
| Assets Included | Only highly liquid assets | All current assets |
| Inventory | Excluded | Included |
| Prepaid Expenses | Excluded | Included |
| Conservatism | More conservative | Less conservative |
| Best For | Assessing immediate liquidity | General short-term health |
| Typical Range | 0.5 – 1.5 | 1.0 – 2.0 |
When Each Ratio Matters
Use the Quick Ratio when:
- Evaluating companies with slow-moving inventory
- Assessing crisis resilience
- Analyzing businesses where inventory might become obsolete (technology, fashion)
- Making credit decisions or lending determinations
Use the Current Ratio when:
- Analyzing companies with fast inventory turnover
- Conducting broad financial screening
- Comparing general liquidity across many companies
- Inventory represents genuine near-term value
Practical Example: Same Company, Different Stories
Return to our earlier retail company example:
Quick Ratio Calculation:
$450,000 ÷ $350,000 = 1.29
Current Ratio Calculation:
$875,000 ÷ $350,000 = 2.50
The Current Ratio suggests strong liquidity with $2.50 in current assets per dollar of liabilities. The Quick Ratio reveals a more modest $1.29 when inventory is excluded.
This gap highlights the company’s dependence on inventory conversion. If that $400,000 inventory becomes difficult to sell, the company’s true liquidity position is closer to 1.29 than 2.50.
The difference between these ratios tells a story. A large gap indicates heavy inventory reliance. A small gap suggests an asset-light business model with naturally strong liquidity.
Understanding both metrics provides dimensional insight that neither offers alone. Learn more about comprehensive liquidity analysis in our guide to balance sheet basics.
Why Inventory and Prepaid Expenses Are Excluded
The Quick Ratio’s power comes from what it excludes. Understanding why certain assets don’t qualify as “quick” reveals the ratio’s underlying logic.
The Inventory Problem
Inventory requires three uncertain steps to become cash:
- Finding buyers – No guarantee of immediate demand
- Negotiating prices – Urgent sales often require steep discounts
- Completing transactions – Takes time, even with willing buyers
Real-world inventory challenges:
- Obsolescence risk: Technology products, seasonal goods, and fashion items lose value rapidly
- Liquidation discounts: Desperate sellers might receive 30-50% below book value
- Time requirements: Even fast-moving inventory takes weeks to convert to cash
- Quality variations: Some inventory may be damaged, outdated, or unsellable
Consider a clothing retailer holding $500,000 in winter coats. In March, those coats might sell for only $200,000 if the company needs immediate cash. The balance sheet shows $500,000, but the quick-sale reality is far less.
This is why conservative financial analysis excludes inventory from liquidity calculations. Book value doesn’t equal emergency liquidation value.
The Prepaid Expense Problem
Prepaid expenses represent payments made in advance for future benefits:
- Insurance premiums paid for the next 12 months
- Rent paid quarterly in advance
- Annual software subscriptions
- Retainer fees for professional services
Why they’re excluded:
These payments are non-refundable in most cases. A company that prepaid $24,000 for annual insurance cannot call the insurer and request a refund to pay creditors. The money is spent, and only the future benefit remains.
Prepaid expenses provide value but not liquidity. They reduce future cash outflows but cannot address current cash shortfalls.
The Conservative Principle
Excluding inventory and prepaid expenses reflects a fundamental principle: liquidity analysis should assume stress conditions, not ideal circumstances.
During financial pressure:
- Inventory sells slowly and at discounts
- Prepaid expenses cannot be recovered
- Only genuinely liquid assets provide flexibility
The Quick Ratio embraces this conservative view. It answers: “If everything goes wrong tomorrow, can this company survive?”
This makes it invaluable for risk management, credit analysis, and crisis preparation.
Practical Applications: Using the Quick Ratio in Real-World Analysis
Theory matters, but application creates value. Here’s how investors, lenders, and business owners use the Quick Ratio to make better decisions.
For Equity Investors
Pre-Investment Screening
Before buying stock, calculate the Quick Ratio to assess financial stability. Companies with ratios below 0.8 face a higher bankruptcy risk during economic downturns.
Red Flag Detection
A declining Quick Ratio over multiple quarters signals deteriorating liquidity. This often precedes larger problems, such as slowing sales, collection difficulties, or poor cash management.
Sector Comparison
Compare Quick Ratios across competitors to identify the strongest and weakest players in an industry. The company with superior liquidity often survives market disruptions while weaker competitors fail.
Combine Quick Ratio analysis with other valuation metrics like enterprise value and EBITDA for comprehensive investment decisions.
For Lenders and Creditors
Credit Approval Decisions
Banks and suppliers use Quick Ratios to evaluate loan applications and credit terms. A ratio above 1.0 increases approval likelihood and may secure better interest rates.
Ongoing Monitoring
Loan covenants often require minimum Quick Ratio maintenance. Falling below covenant thresholds triggers technical default, even if payments remain current.
Collection Priority
When multiple customers face financial difficulty, creditors prioritize collection efforts based on Quick Ratios. Companies with ratios below 0.5 receive immediate attention because default risk is highest.
For Business Owners and CFOs
Cash Management Strategy
Track your Quick Ratio monthly to ensure adequate liquidity cushions. If the ratio falls toward 1.0, accelerate collections, delay non-essential purchases, or arrange backup credit lines.
Vendor Negotiations
A strong Quick Ratio (above 1.3) provides leverage when negotiating payment terms. Suppliers offer better terms to financially stable customers.
Growth Planning
Before major investments or expansion, ensure your Quick Ratio can absorb the temporary cash drain. Dropping below 1.0 during growth phases creates unnecessary risk.
Understanding your company’s liquidity position helps with broader financial planning, similar to how the 50/30/20 budgeting rule helps individuals manage personal cash flow.
For Financial Analysts
Trend Analysis
Calculate Quick Ratios for the past 5-10 years to identify patterns. Consistently improving ratios suggest strengthening financial management. Declining trends warrant investigation.
Peer Benchmarking
Create comparison tables showing Quick Ratios for all companies in a sector. This reveals which businesses maintain superior liquidity management.
Scenario Testing
Model how various scenarios affect the Quick Ratio:
- What if receivables collection slows by 20%?
- What if a major customer delays payment?
- What if credit lines are reduced?
These stress tests reveal vulnerabilities before they become crises.
Improving Your Quick Ratio: Practical Strategies
A weak Quick Ratio isn’t permanent. Companies can strengthen liquidity through strategic actions targeting both sides of the equation.
Increase Quick Assets (Numerator)
1. Accelerate Receivables Collection
- Offer early payment discounts (2% off if paid within 10 days)
- Tighten credit policies for new customers
- Implement automated payment reminders
- Factor or sell receivables to specialized firms
- Require deposits or progress payments for large orders
2. Convert Excess Inventory to Cash
While inventory doesn’t count in the Quick Ratio, selling it generates cash that does:
- Run clearance sales for slow-moving items
- Negotiate bulk sales to liquidators
- Implement just-in-time inventory systems
- Return unsold goods to suppliers when possible
3. Improve Cash Generation
- Negotiate better payment terms with customers (shorter payment windows)
- Implement subscription or recurring revenue models
- Require advance payments for services
- Sell non-essential fixed assets
4. Increase Marketable Securities
- Invest excess cash in liquid, short-term securities
- Maintain a portfolio of Treasury bills or money market funds
- Ensure investments can be sold within days without significant loss
Decrease Current Liabilities (Denominator)
1. Extend Payables (Carefully)
- Negotiate longer payment terms with suppliers
- Take advantage of full payment windows (pay on day 30, not day 10)
- Consolidate purchases with fewer vendors for better terms
- Balance this against early payment discounts—sometimes paying early saves more than extending terms
2. Restructure Short-Term Debt
- Convert short-term loans to long-term financing
- Refinance high-interest debt with lower rates
- Establish revolving credit lines for flexibility
- Pay down debt principal using excess cash
3. Reduce Accrued Expenses
- Negotiate quarterly rather than monthly rent payments
- Adjust tax withholding to match actual liability
- Prepay certain expenses to move them off current liabilities
Strategic Considerations
Balance is Essential
Improving the Quick Ratio shouldn’t compromise business operations. Aggressive collection tactics might damage customer relationships. Delaying supplier payments risks losing favorable terms or reliable partners.
Industry Context Matters
A technology company should target ratios above 1.5. A grocery retailer might function perfectly well at 0.7. Improve your ratio relative to industry benchmarks, not absolute standards.
Monitor the Trade-offs
Every liquidity improvement has costs:
- Early payment discounts reduce revenue
- Selling inventory quickly means accepting lower prices
- Converting growth investments to cash sacrifices future returns
The goal isn’t maximizing the Quick Ratio but optimizing it for your business model and risk tolerance.
Similar to how the 4% rule helps retirees balance spending and sustainability, the Quick Ratio helps businesses balance liquidity and efficiency.
Common Mistakes and Limitations
The Quick Ratio is powerful but imperfect. Understanding its limitations prevents misinterpretation and flawed decisions.
Mistake #1: Ignoring Receivables Quality
The Problem: Not all accounts receivable are equally collectible.
A company might show $500,000 in receivables, but if $200,000 is more than 90 days overdue, the true quick asset value is closer to $300,000. The Quick Ratio treats all receivables equally, potentially overstating liquidity.
The Solution: Analyze the accounts receivable aging schedule. Adjust calculations to exclude or discount seriously overdue accounts.
Mistake #2: Overlooking Industry Context
The Problem: Comparing Quick Ratios across different industries produces meaningless conclusions.
A software company with a 0.9 Quick Ratio has serious problems. A supermarket with the same ratio operates normally because inventory turns over daily.
The Solution: Always benchmark against industry peers, not absolute standards. Use sector-specific ratio ranges for interpretation.
Mistake #3: Focusing on a Single Point in Time
The Problem: The Quick Ratio is a snapshot, not a movie.
A company might show a strong 1.4 ratio on December 31 but operate at 0.7 for most of the year. Seasonal businesses often manipulate year-end balance sheets to appear stronger.
The Solution: Calculate quarterly or monthly Quick Ratios to identify trends and seasonal patterns. One measurement reveals little; a series reveals everything.
Mistake #4: Assuming Higher Is Always Better
The Problem: Extremely high Quick Ratios (above 2.0 for most industries) can indicate poor capital allocation.
Excess cash sitting idle generates minimal returns. Companies should invest surplus liquidity in growth opportunities, debt reduction, or shareholder returns—not hoard cash indefinitely.
The Solution: Evaluate whether high ratios reflect prudent reserves or inefficient capital deployment. Consider management’s stated strategy and industry reinvestment requirements.
Limitation #1: No Information About Cash Flow
The Issue: The Quick Ratio uses balance sheet data, which shows positions at a moment in time, not flows over time.
A company might have a strong 1.5 Quick Ratio but a negative operating cash flow. Without ongoing cash generation, even strong ratios deteriorate quickly.
The Complement: Always review cash flow statements alongside liquidity ratios. Positive operating cash flow sustains healthy ratios; negative cash flow erodes them.
Limitation #2: Doesn’t Measure Profitability
The Issue: Liquidity and profitability are different concepts.
A company can maintain a strong Quick Ratio while losing money every quarter. Eventually, losses consume liquid assets, but the ratio won’t predict when this occurs.
The Complement: Combine Quick Ratio analysis with profitability metrics like EBITDA margin and accounting profit.
Limitation #3: Susceptible to Window Dressing
The Issue: Companies can temporarily manipulate ratios before reporting dates.
Tactics include:
- Delaying purchases until after quarter-end
- Accelerating customer collections before reporting
- Paying down payables just before the balance sheet dates
- Temporarily converting inventory to cash
The Awareness: Recognize that reported ratios may not reflect typical operations. Look for unusual quarter-end patterns or significant changes between periods.
Quick Ratio in Different Business Contexts
The Quick Ratio’s meaning shifts dramatically across business types. Context transforms interpretation.
Startups and Early-Stage Companies
Typical Range: 0.3 – 0.8
Why Lower Ratios Are Common:
- Heavy cash burn before profitability
- Minimal receivables (few customers)
- Venture funding comes in stages, not continuously
- Growth investments consume cash faster than operations generate it
What to Watch:
- Months of runway remaining (cash ÷ monthly burn rate)
- Proximity to the next funding round
- Revenue growth trajectory
- Path to positive cash flow
For startups, the Quick Ratio matters less than cash runway and growth metrics. A 0.5 ratio with 18 months of runway is far safer than a 1.0 ratio with 3 months remaining.
Mature, Profitable Companies
Typical Range: 1.0 – 1.8
Why Ratios Stabilize:
- Predictable cash generation
- Established customer relationships
- Efficient working capital management
- Access to credit facilities
What to Watch:
- Ratio consistency over time
- Comparison to industry peers
- Dividend sustainability
- Debt service coverage
For mature businesses, the Quick Ratio should remain stable. Significant changes signal operational shifts or management strategy changes.
Cyclical Industries
Typical Range: Varies with the economic cycle
Special Considerations:
- Ratios strengthen during economic expansions
- Ratios weaken during contractions
- Counter-cyclical cash management is essential
- Building liquidity cushions during good times prevents crises during downturns
What to Watch:
- Ratio trends relative to economic indicators
- Management’s recession preparation
- Credit facility availability during downturns
- Historical ratio patterns across previous cycles
Companies in construction, automotive, and industrial manufacturing must maintain higher Quick Ratios than average because revenue volatility creates liquidity risk.
Seasonal Businesses
Typical Range: Varies dramatically by season
Special Considerations:
- Retail companies build inventory before holiday seasons
- Quick Ratios drop as inventory rises
- Ratios spike after seasonal sales convert inventory to cash
- Year-end ratios may not reflect typical operations
What to Watch:
- Ratio patterns across multiple years
- Seasonal cash flow management
- Inventory buildup and liquidation efficiency
- Credit line usage during low seasons
For seasonal businesses, calculate Quick Ratios at consistent points in the annual cycle—comparing December to December, not December to June.
Advanced Analysis: Quick Ratio Trends and Patterns
Single measurements inform. Trends reveal truth.
Trend Analysis Framework
Improving Quick Ratio (Consecutive Quarters)
Positive Interpretations:
- Strengthening financial management
- Improving collection processes
- Successful debt reduction
- Growing cash generation
Caution Signals:
- Ratio improving due to declining sales (shrinking liabilities faster than assets)
- Excessive cash hoarding instead of reinvestment
- Preparation for a known crisis (management sees trouble ahead)
Declining Quick Ratio (Consecutive Quarters)
Negative Interpretations:
- Deteriorating liquidity position
- Slowing collections
- Increasing short-term debt
- Cash flow problems
Acceptable Explanations:
- Planned growth investments
- Strategic acquisitions
- Seasonal patterns
- Deliberate efficiency improvements (reducing excess cash)
Pattern Recognition
The Sawtooth Pattern (Alternating high and low quarters)
- Indicates seasonal business
- Normal for retail, agriculture, and tourism
- Evaluate year-over-year, not quarter-over-quarter
The Steady Decline (Consistent quarterly drops)
- Red flag requiring immediate investigation
- Often precedes financial distress
- Check operating cash flow and profitability trends
The Sudden Spike (Sharp one-quarter increase)
- May indicate an asset sale or a financing event
- Review the cash flow statement for large inflows
- Determine if the spike is sustainable or temporary
The Plateau (Stable ratio over many periods)
- Suggests mature, well-managed operations
- Indicates consistent working capital management
- Generally positive for established companies
Comparative Analysis
Peer Comparison Table Example:
| Company | Quick Ratio | Industry Avg | Interpretation |
|---|---|---|---|
| Company A | 1.45 | 1.20 | Above average liquidity |
| Company B | 0.95 | 1.20 | Below average, monitor closely |
| Company C | 2.10 | 1.20 | Excess liquidity, possible inefficiency |
| Company D | 1.18 | 1.20 | In line with sector norm |
This comparison reveals relative positioning. Company C might be the safest but potentially the least efficient capital allocator. Company B faces the highest liquidity risk.
📊 Quick Ratio Calculator
Calculate your company’s liquidity position in seconds
Interpretation
Enter your values and calculate to see interpretation.
Real-World Example: Analyzing Two Competitors
Theory becomes clear through comparison. Consider two hypothetical retail companies:
Company Alpha
Balance Sheet Highlights (in millions):
- Cash: $45
- Marketable Securities: $20
- Accounts Receivable: $85
- Inventory: $200
- Prepaid Expenses: $10
- Total Current Assets: $360
- Current Liabilities: $150
Quick Ratio Calculation:
($45 + $20 + $85) ÷ $150 = 1.00
Current Ratio:
$360 ÷ $150 = 2.40
Company Beta
Balance Sheet Highlights (in millions):
- Cash: $30
- Marketable Securities: $15
- Accounts Receivable: $60
- Inventory: $120
- Prepaid Expenses: $5
- Total Current Assets: $230
- Current Liabilities: $100
Quick Ratio Calculation:
($30 + $15 + $60) ÷ $100 = 1.05
Current Ratio:
$230 ÷ $100 = 2.30
Comparative Analysis
Surface Level:
Both companies appear similar. Current Ratios are nearly identical (2.40 vs. 2.30), suggesting comparable liquidity.
Quick Ratio Reveals:
Both maintain adequate liquidity (1.00 and 1.05), but Company Beta has a slight edge in liquid asset coverage.
Deeper Insight:
Company Alpha carries significantly more inventory ($200M vs. $120M) relative to its size. This creates two risks:
- Obsolescence exposure: If inventory becomes outdated, Alpha faces larger write-downs
- Liquidation dependency: Alpha relies more heavily on converting inventory to cash to maintain operations
Company Beta’s learner inventory position suggests:
- More efficient inventory management
- Less capital tied up in slow-moving stock
- Greater operational agility
Investment Implication:
If both companies face a demand shock, Beta’s superior Quick Ratio and lower inventory exposure provide better downside protection. Alpha might need to discount inventory heavily to generate cash, damaging profitability.
This example demonstrates why the Quick Ratio reveals risks that broader metrics miss.
Conclusion: Making the Quick Ratio Work for You
The Quick Ratio is more than a formula; it’s a lens for viewing financial reality with clarity and conservatism.
By excluding inventory and prepaid expenses, this metric reveals the truth about immediate liquidity that broader measures obscure. It answers the critical question every business faces: “Can we survive if everything goes wrong tomorrow?”
For investors, the Quick Ratio identifies companies with genuine financial resilience versus those with artificially inflated current assets. It separates businesses that will weather storms from those that will struggle.
For business owners, tracking this ratio monthly provides an early warning of liquidity deterioration. It guides decisions about credit policies, inventory management, and capital structure.
For lenders and creditors, the Quick Ratio offers a conservative assessment of repayment capacity. It helps prioritize collection efforts and structure appropriate loan covenants.
Your Action Plan
If you’re an investor:
- Calculate Quick Ratios for all portfolio companies and watch list candidates
- Compare ratios to industry benchmarks and historical trends
- Investigate any company with declining ratios over consecutive quarters
- Use the Quick Ratio as one component of a comprehensive financial analysis alongside cash flow statements and profitability metrics
If you’re a business owner or CFO:
- Calculate your Quick Ratio monthly and track trends
- Benchmark against competitors and industry standards
- Set internal targets based on your business model and risk tolerance
- Develop action plans for both improving weak ratios and deploying excess liquidity efficiently
- Include Quick Ratio targets in management dashboards and board reports
If you’re a lender or credit analyst:
- Require Quick Ratio disclosures as part of credit applications
- Establish industry-specific minimum thresholds for approval
- Include Quick Ratio maintenance covenants in loan agreements
- Monitor borrower ratios quarterly to identify early warning signs
The Math Behind Financial Resilience
Understanding the Quick Ratio represents financial literacy in action. It demonstrates how simple mathematical relationships reveal complex business realities.
The formula itself is straightforward: liquid assets divided by current liabilities. But the insight it provides, the ability to assess survival capacity under stress, is invaluable.
This is the math behind money. Not complicated equations, but clear cause-and-effect relationships that drive wealth building and risk management.
Master the Quick Ratio, and you’ve mastered a fundamental tool for evaluating business quality, protecting capital, and making evidence-based financial decisions.
The numbers tell the story. The Quick Ratio helps you read it.
References
[1] Corporate Finance Institute. “Quick Ratio (Acid-Test Ratio).” CFI Education. https://corporatefinanceinstitute.com/resources/accounting/quick-ratio-acid-test/
[2] Investopedia. “Quick Ratio Definition and Formula.” https://www.investopedia.com/terms/q/quickratio.asp
[3] U.S. Securities and Exchange Commission. “Beginners’ Guide to Financial Statements.” https://www.sec.gov/reportspubs/investor-publications/investorpubsbegfinstmtguidehtm.html
[4] Financial Accounting Standards Board. “Accounting Standards Codification.” https://www.fasb.org/
[5] CFA Institute. “Financial Analysis Techniques.” CFA Program Curriculum Level I.
Author Bio
Max Fonji is the founder of The Rich Guy Math, a data-driven financial education platform dedicated to teaching the mathematical principles behind wealth building, investing, and risk management. With expertise in financial analysis and valuation, Max translates complex financial concepts into clear, actionable insights for investors and business owners. His evidence-based approach emphasizes understanding cause-and-effect relationships in finance rather than following trends or hype.
Educational Disclaimer
This article is provided for educational and informational purposes only. It does not constitute financial, investment, accounting, or legal advice. The Quick Ratio is one of many financial metrics used to assess business liquidity and should be evaluated alongside other financial indicators and qualitative factors.
Financial ratios are based on reported accounting data, which may not reflect current market conditions or future performance. Past financial metrics do not guarantee future results. Every business situation is unique, and acceptable Quick Ratio levels vary by industry, business model, and economic conditions.
Before making investment decisions, extending credit, or implementing significant changes to business financial strategy, consult with qualified financial advisors, accountants, or legal professionals who understand your specific circumstances.
The Rich Guy Math and its authors are not responsible for any financial decisions made based on this content. Always conduct thorough due diligence and seek professional guidance for important financial matters.
Frequently Asked Questions (FAQ)
What is a good Quick Ratio?
A Quick Ratio between 1.0 and 1.5 is generally considered healthy for most industries. A ratio of 1.0 means the company has exactly enough liquid assets to cover current liabilities. Ratios above 1.5 indicate strong liquidity but may suggest underutilized capital. However, acceptable ranges vary significantly by industry—technology companies often maintain ratios above 2.0, while retailers may operate successfully at 0.7.
How is the Quick Ratio different from the Current Ratio?
The Quick Ratio is more conservative than the Current Ratio because it excludes inventory and prepaid expenses. The Current Ratio includes all current assets, while the Quick Ratio focuses only on assets that can be converted to cash within days or weeks. This makes the Quick Ratio a better measure of immediate liquidity and crisis resilience.
Why is inventory excluded from the Quick Ratio?
Inventory is excluded because it cannot be quickly converted to cash at full value. Selling inventory requires finding buyers, negotiating prices, and completing transactions—processes that take time. During financial stress, companies often must discount inventory by 30–50% to generate immediate cash. The Quick Ratio assumes worst-case scenarios where inventory liquidation isn’t feasible at book value.
Can a company have too high of a Quick Ratio?
Yes. Quick Ratios significantly above 2.0 (for most industries) may indicate inefficient capital allocation. Excess cash sitting idle generates minimal returns compared to growth investments, debt reduction, or shareholder distributions. While high ratios provide safety, they can signal that management isn’t optimizing capital deployment for shareholder value.
How often should I calculate the Quick Ratio?
For business owners and CFOs, calculate the Quick Ratio monthly to monitor liquidity trends. Investors should review it quarterly when companies release financial statements. Lenders often require Quick Ratio calculations as part of ongoing loan covenant compliance, sometimes monthly or quarterly depending on credit agreement terms.
What’s the minimum acceptable Quick Ratio?
There’s no universal minimum, but ratios below 0.5 indicate severe liquidity risk requiring immediate attention. Ratios between 0.5 and 1.0 suggest moderate concern—manageable for some business models but requiring close monitoring. The minimum acceptable ratio depends on industry norms, business model, cash flow predictability, and access to credit facilities.
Does the Quick Ratio predict bankruptcy?
The Quick Ratio alone doesn’t predict bankruptcy, but consistently declining ratios often precede financial distress. Combine Quick Ratio analysis with other metrics like the Altman Z-Score, operating cash flow, and profitability measures for comprehensive bankruptcy risk assessment. A company can maintain a strong Quick Ratio while losing money, or have a weak ratio while remaining profitable.
How do I improve my company’s Quick Ratio?
Improve your Quick Ratio by: (1) accelerating receivables collection through early payment discounts and tighter credit policies, (2) converting excess inventory to cash through sales or liquidation, (3) extending payment terms with suppliers, (4) restructuring short-term debt into long-term financing, and (5) improving operating cash flow. Balance improvements against operational needs—aggressive tactics can damage customer and supplier relationships.


