Picture this: You’re at a coffee shop, and your friend just told you she invested $10,000 in two different companies. One turned her money into $1,500 profit in a year, while the other made only $300. Same investment amount, wildly different results. Which company is actually better at putting shareholder money to work? That’s exactly what Return on Equity tells you, and it’s one of the most powerful metrics investors use to separate winning companies from the rest. Investopedia
Return on Equity (ROE) is like a company’s report card for how well it turns your investment into profits. Warren Buffett calls it one of his favorite metrics, and for good reason. It cuts through the noise and shows you the cold, hard truth: Is this company actually good at making money with the money you gave them?
Whether you’re just starting your investing journey or looking to level up your stock-picking game, understanding ROE will transform how you evaluate companies. Let’s dive in.
Key Takeaways
- Return on Equity (ROE) measures how efficiently a company generates profits from shareholder equity; higher percentages generally indicate better performance.
- The basic ROE formula is: Net Income ÷Shareholders’s Equity × 100, typically expressed as a percentage.
- A “good” ROE varies by industry, but generally 15-20% or higher is considered strong for most sectors.
- ROE can be manipulated through debt, so always analyze it alongside other metrics like the debt-to-equity ratio
- Consistent ROE over multiple years matters more than a single year’s performance; look for stability and growth trends.
What is Return on Equity (ROE)?
Return on Equity is a profitability ratio that measures how much profit a company generates with the money shareholders have invested. Think of it as the efficiency score for turning equity into earnings.
When you buy stock in a company, you’re essentially handing over your money and saying, “Here, make this grow.” ROE tells you how good they are at that job. A company with a 20% ROE turns every dollar of equity into 20 cents of profit annually. Another company with only 5% ROE? They’re making just 5 cents per dollar, not nearly as impressive. Morningstar
Why ROE Matters to Investors
ROE matters because it reveals:
- Management effectiveness: How well executives deploy capital
- Competitive advantage: Companies with sustainable high ROE often have moats
- Growth potential: Higher ROE companies can reinvest profits more efficiently
- Comparison tool: Easy way to compare companies within the same industry
“The best businesses have high returns on equity while employing little or no debt.” — Warren Buffett
Understanding why the stock market goes up over time becomes clearer when you realize that companies with strong ROE compound shareholder value year after year.
The Return on Equity Formula Explained
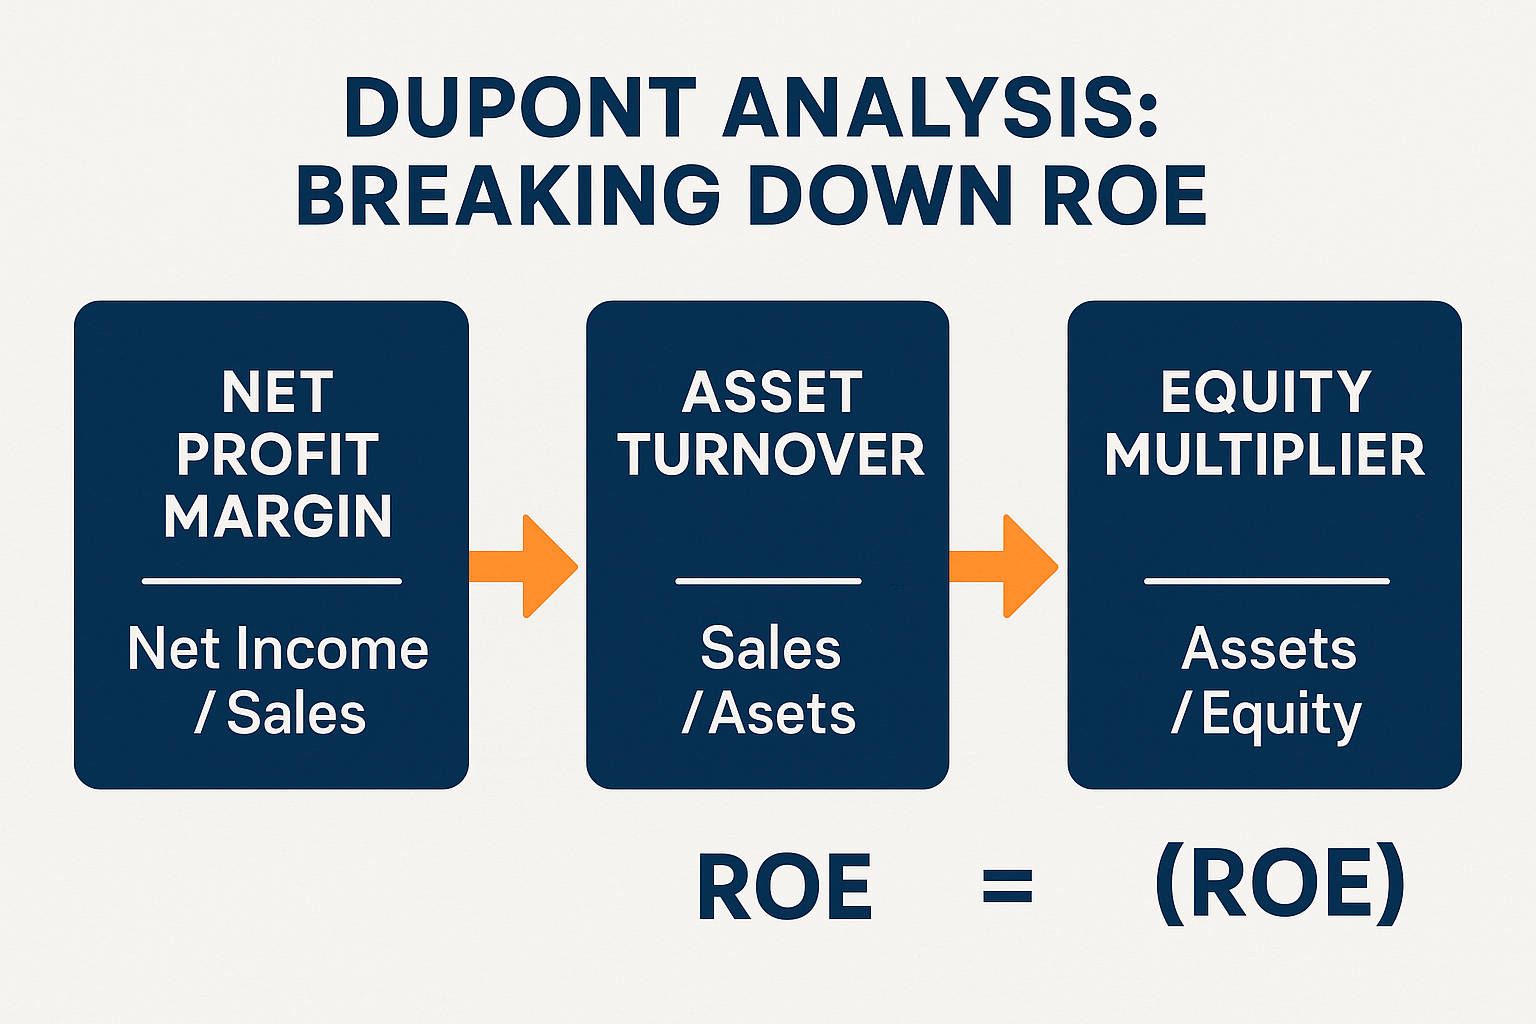
The basic ROE formula is beautifully simple:
ROE = (Net Income ÷ Shareholder’s Equity) × 100
Let’s break down each component:
Net Income
This is the company’s total profit after all expenses, taxes, and costs have been deducted. You’ll find this number at the bottom of the income statement (that’s why it’s also called the “bottom line”).
Where to find it: Income Statement, last line
Shareholder’s Equity
Also called “stockholders’ equity” or “book value,” this represents the net worth of the company, what would be left if the company sold all assets and paid all debts.
Formula: Total Assets – Total Liabilities
Where to find it: Balance Sheet
Putting It Together: A Simple Example
Let’s say Company ABC has:
- Net Income: $5 million
- Shareholder’s Equity: $25 million
ROE Calculation:
ROE = ($5 million ÷ $25 million) × 100 = 20%
This means Company ABC generated a 20% return on the equity shareholders invested in the business. Not bad!
How to Calculate ROE: Step-by-Step Guide
Let’s walk through a real-world example using actual numbers.
Example: Calculating ROE for a Retail Company
Step 1: Find Net Income
Looking at the annual income statement:
- Revenue: $100 million
- Cost of Goods Sold: $60 million
- Operating Expenses: $25 million
- Interest & Taxes: $5 million
- Net Income: $10 million ✓
Step 2: Find Shareholders’ Equity
Looking at the balance sheet:
- Total Assets: $80 million
- Total Liabilities: $30 million
- Shareholders’ Equity: $50 million ✓
Step 3: Apply the Formula
ROE = ($10 million ÷ $50 million) × 100 = 20%
Step 4: Interpret the Result
A 20% ROE means this retail company generated $0.20 in profit for every $1.00 of shareholder equity. For the retail industry, this is generally considered excellent performance. Corporate Finance Institute
Important Note: Average vs Year-End Equity
For more accuracy, many analysts use the average shareholder’s equity over the year:
Average Equity = (Beginning Equity + Ending Equity) ÷ 2
This smooths out any major changes that happened during the year and gives a more representative picture.
Interactive ROE Calculator
📊 ROE Calculator
Calculate Return on Equity in seconds
What's a "Good" Return on Equity?
Here's the million-dollar question: What ROE should you look for?
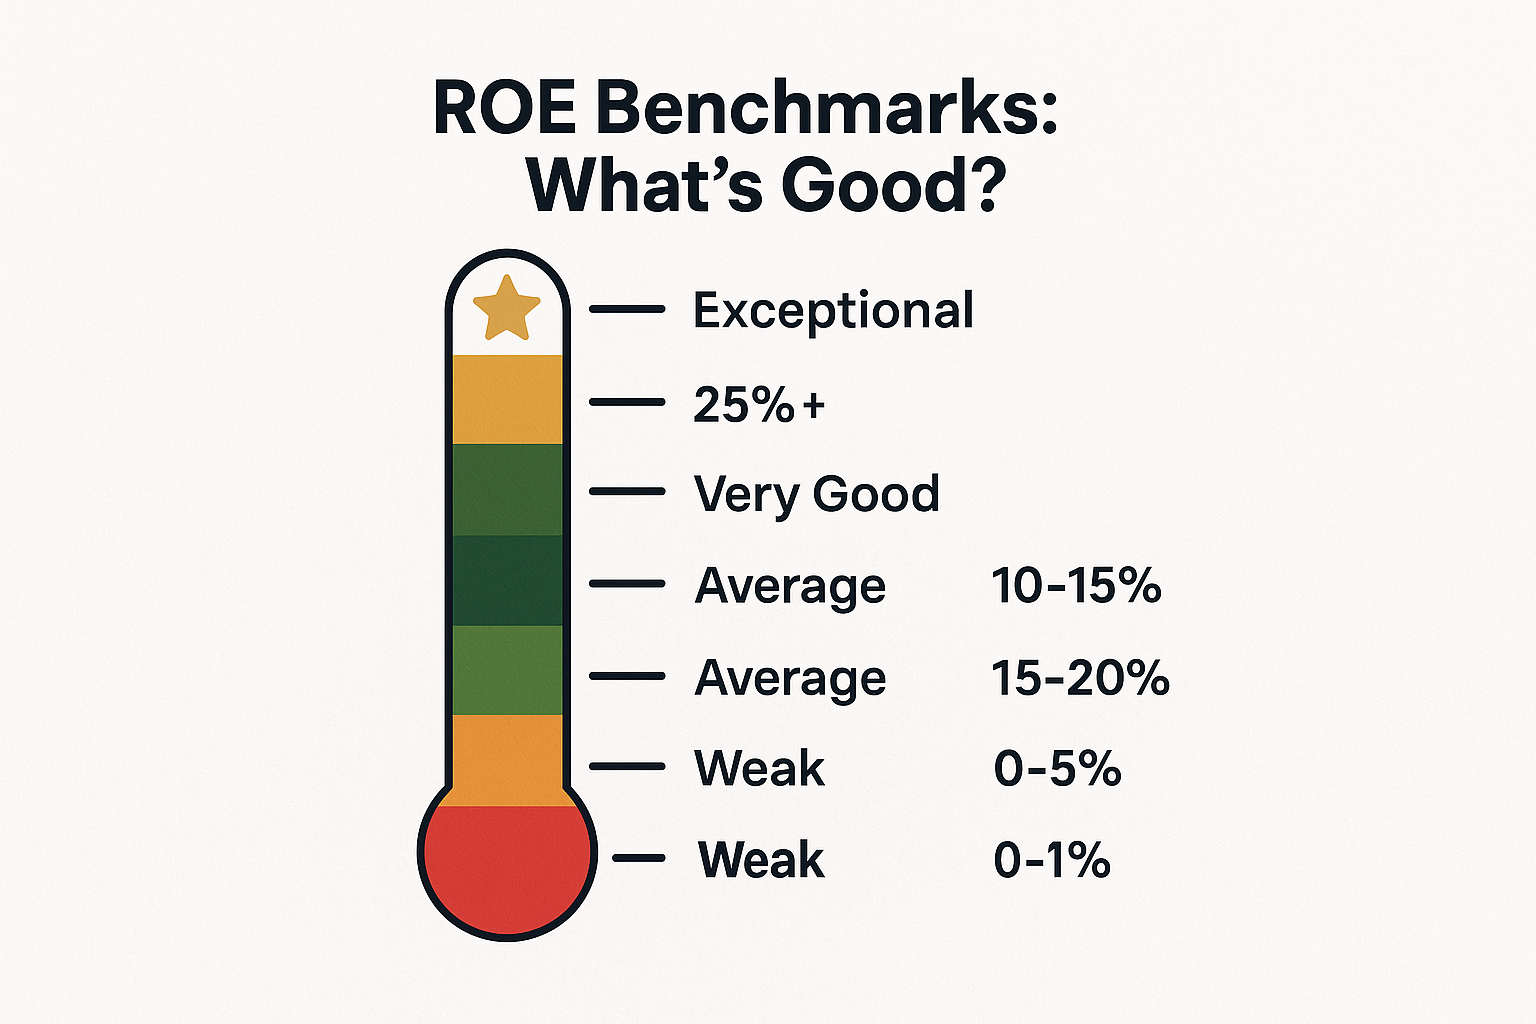
The answer isn't one-size-fits-all. A "good" ROE depends heavily on the industry, but here are some general guidelines:
ROE Benchmarks by Performance Level
| ROE Range | Rating | Interpretation |
|---|---|---|
| Below 0% | ❌ Poor | Company is losing money |
| 0-5% | 🔴 Weak | Very inefficient use of equity |
| 5-10% | 🟡 Below Average | Room for improvement |
| 10-15% | 🟢 Average | Acceptable for many industries |
| 15-20% | ⭐ Good | Strong performance |
| 20-25% | ⭐⭐ Very Good | Excellent management efficiency |
| Above 25% | 🌟 Exceptional | Outstanding (but verify it's sustainable) |
Industry-Specific ROE Expectations
Different industries have different capital requirements, which affects typical ROE ranges:
High ROE Industries (20%+):
- Software & Technology
- Consumer Goods
- Pharmaceuticals
- Financial Services
Moderate ROE Industries (10-20%):
- Retail
- Healthcare
- Manufacturing
- Telecommunications
Lower ROE Industries (5-15%):
- Utilities
- Real Estate
- Heavy Industry
- Transportation
Pro Tip: Always compare a company's ROE to its industry peers, not just to an absolute number. A utility with 12% ROE might be stellar, while a software company with the same ROE could be underperforming.
The DuPont Analysis: Breaking Down ROE
The DuPont Analysis (developed by the DuPont Corporation in the 1920s) breaks ROE into three components, revealing how a company achieves its ROE:
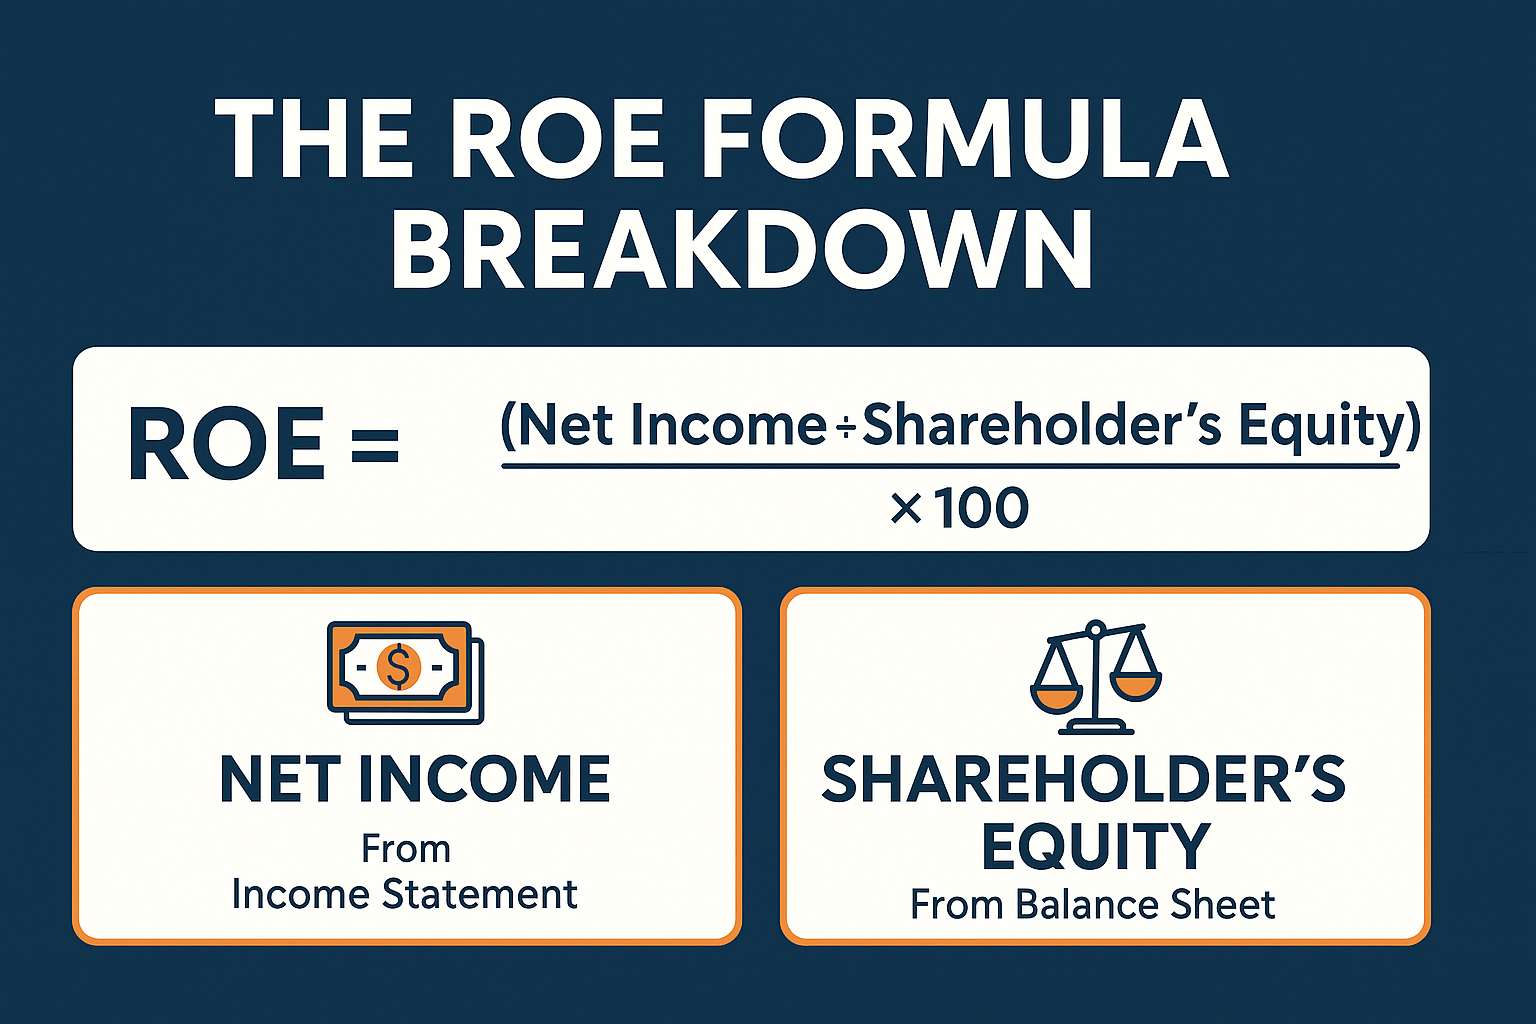
ROE = Net Profit Margin × Asset Turnover × Equity Multiplier
Or written another way:
ROE = (Net Income/Sales) × (Sales/Assets) × (Assets/Equity)
The Three Components Explained
1. Net Profit Margin (Net Income ÷ Sales)
- Measures how much profit the company makes per dollar of sales
- Higher = better pricing power or cost control
2. Asset Turnover (Sales ÷ Assets)
- Measures how efficiently the company uses assets to generate sales
- Higher = more efficient operations
3. Equity Multiplier (Assets ÷ Equity)
- Measures financial leverage (how much debt the company uses)
- Higher = more debt relative to equity
Why DuPont Analysis Matters
Two companies can have identical 20% ROE but achieve it completely differently:
Company A: High profit margins, low turnover, low debt
Company B: Low margins, high turnover, high debt
Company A's ROE is probably more sustainable and less risky. Company B might be one recession away from trouble.
This is why understanding smart investing moves means looking beyond surface-level metrics.
Real-World Case Studies
Let's examine three real companies to see ROE in action (numbers simplified for illustration):
Case Study 1: Tech Giant (Apple-Style Company)
Company Profile: Premium consumer electronics and services
Financial Data (2024):
- Net Income: $100 billion
- Shareholders' Equity: $50 billion
- ROE: 200%
Analysis:
Wait, 200%? That seems crazy high! Here's what's happening:
Apple-style companies often have negative equity or very low equity because they:
- Return massive amounts of cash to shareholders through buybacks
- Have strong cash flow but maintain lean balance sheets
- Use debt strategically while returning equity to investors
This creates an artificially inflated ROE. While impressive, it's not necessarily comparable to other companies. The lesson? Context matters.
Case Study 2: Stable Dividend Payer (Coca-Cola-Style)
Company Profile: Established consumer beverage company
Financial Data (2024):
- Net Income: $9 billion
- Shareholders' Equity: $25 billion
- ROE: 36% ⭐
Analysis:
This is what sustainable, high-quality ROE looks like:
- Consistent performance over decades
- Strong brand moat creating pricing power
- Efficient operations with global scale
- Moderate debt levels
Companies like this are perfect for dividend investing strategies, as they generate strong returns while paying reliable dividends.
Case Study 3: Struggling Retailer
Company Profile: Traditional brick-and-mortar retail chain
Financial Data (2024):
- Net Income: $200 million
- Shareholder's Equity: $5 billion
- ROE: 4%
Analysis:
This low ROE signals trouble:
- Thin profit margins due to competition
- Heavy asset base (stores, inventory) with poor returns
- Difficulty competing with e-commerce
- Potential value destruction
This is exactly the type of company that causes people to lose money in the stock market when they don't do proper research.
ROE Red Flags and Limitations
ROE is powerful, but it's not perfect. Here are critical limitations every investor must understand:
1. The Debt Problem
High debt artificially inflates ROE.
Remember the equity multiplier in the DuPont formula? A company can boost ROE simply by taking on more debt, which reduces equity. But more debt = more risk.
Example:
- Company X: $10M income, $50M equity = 20% ROE
- Company Y: $10M income, $25M equity = 40% ROE
Company Y looks better, but what if it achieved that by taking on $25M in debt? That's much riskier, especially during downturns.
Solution: Always check ROE alongside the debt-to-equity ratio.
2. Share Buybacks Distortion
When companies buy back their own shares, they reduce shareholder equity, which mathematically increases ROE, even if actual profitability hasn't changed.
This isn't necessarily bad, but it can mask stagnant or declining business fundamentals.
3. Industry Incomparability
Comparing a software company's ROE to a utility's ROE is like comparing apples to oranges. Different business models require different capital structures.
4. Negative Equity Scenarios
Some companies have negative shareholder equity (liabilities exceed assets). This makes ROE calculations meaningless or misleading.
5. Short-Term Manipulation
Companies can temporarily boost ROE through:
- One-time asset sales
- Accounting adjustments
- Delaying capital investments
Always look at ROE trends over 5-10 years, not just one year.
How to Use ROE in Your Investment Strategy
Now that you understand ROE inside and out, here's how to actually use it when evaluating stocks:
Step 1: Calculate or Find the ROE
Most financial websites (Yahoo Finance, Morningstar, Seeking Alpha) show ROE automatically. But now you know how to verify it yourself.
Step 2: Compare to Industry Peers
Pull up 3-5 competitors in the same industry and compare their ROE. The company with consistently higher ROE likely has competitive advantages.
Step 3: Check the Trend
Look at ROE for the past 5-10 years. You want to see:
- ✅ Stable or rising ROE
- ✅ ROE maintained during recessions
- ❌ Avoid volatile or declining ROE
Step 4: Run a DuPont Analysis
Break down the ROE to understand how the company achieves it. Is it from great margins, efficient operations, or just lots of debt?
Step 5: Cross-Reference Other Metrics
Never use ROE alone. Check:
- Debt-to-Equity Ratio: Is high ROE from excessive debt?
- Return on Assets (ROA): How efficiently are assets used?
- Free Cash Flow: Is the company actually generating cash?
- P/E Ratio: Is the stock reasonably priced?
Step 6: Consider the Business Model
Understanding the fundamentals of how businesses work helps you interpret ROE in context. A capital-light business (software) should have a higher ROE than a capital-intensive one (manufacturing).
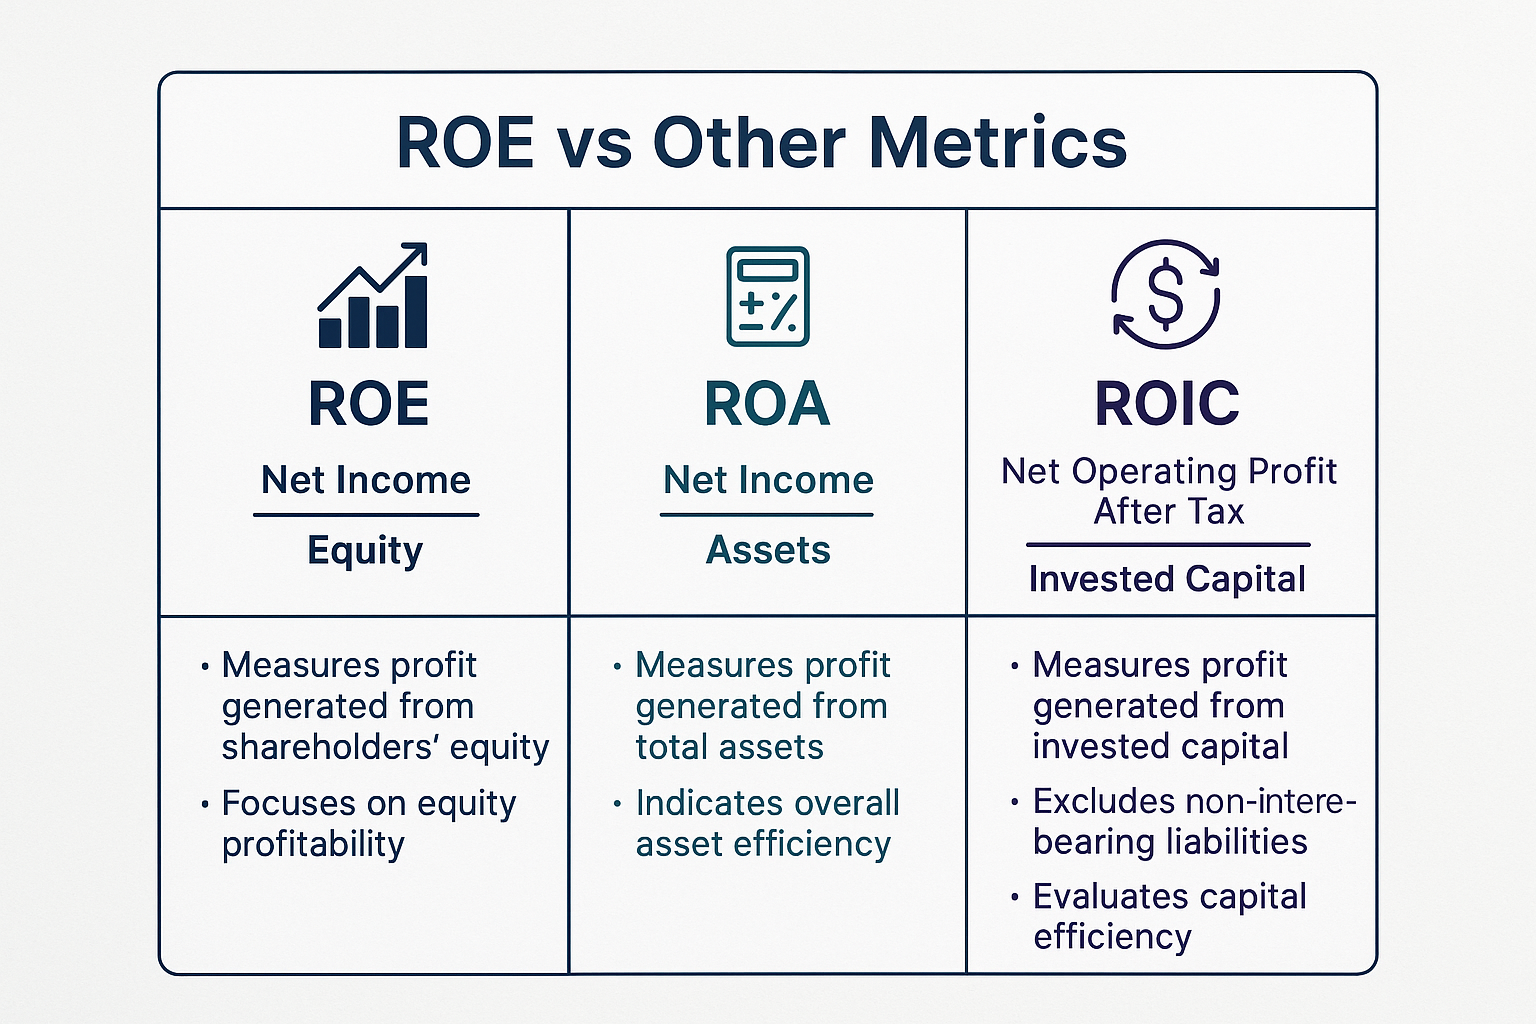
ROE vs Other Financial Metrics
Let's compare ROE to related metrics to understand when to use each:
ROE vs ROA (Return on Assets)
ROA = Net Income ÷ Total Assets
- ROA shows how efficiently a company uses all assets (debt + equity)
- ROE shows returns specifically to equity holders
- ROA is better for comparing companies with different debt levels
- ROE is better for understanding shareholder returns
ROE vs ROIC (Return on Invested Capital)
ROIC = Net Operating Profit After Tax ÷ Invested Capital
- ROIC measures returns on all capital (debt + equity)
- Better for comparing companies across different capital structures
- More complex to calculate
- ROE is simpler and more commonly used
ROE vs Dividend Yield
For high dividend stocks, ROE and dividend yield tell different stories:
- High ROE + Low Dividend = Company reinvesting for growth
- High ROE + High Dividend = Mature, profitable company sharing wealth
- Low ROE + High Dividend = Potentially unsustainable dividend
Creating a Simple ROE Screening Strategy
Here's a beginner-friendly strategy for finding quality stocks using ROE:
The "Quality ROE" Screen
Criteria:
- ROE > 15% (above average)
- ROE stable or increasing over 5 years
- Debt-to-Equity < 1.0 (not overleveraged)
- Positive earnings growth
- Market cap > $1 billion (established companies)
Where to screen:
- Finviz.com (free stock screener)
- Yahoo Finance
- Morningstar
- Your brokerage platform
This simple screen will filter out thousands of stocks and leave you with quality companies worth researching further.
Advanced: The "Buffett-Style" Screen
Warren Buffett loves companies with:
- ROE consistently above 20%
- Little to no debt
- Strong competitive moats
- Shareholder-friendly management
Add these criteria:
- ROE > 20% for 10+ consecutive years
- Debt-to-Equity < 0.5
- Free cash flow growth > 10% annually
- Share buybacks at reasonable prices
This is much more restrictive but can identify truly exceptional businesses.
Real Investor Story: The Return on Equity Wake-Up Call
Let me share a story from a friend named Marcus who learned about ROE the hard way.
Marcus was excited about a retail stock trading at what seemed like a bargain price. The P/E ratio was low, the company had been around for decades, and his dad had shopped there as a kid. Seemed like a safe bet.
He bought $5,000 worth of shares.
Two years later, his investment was worth $3,200. What happened?
When Marcus finally looked at the ROE, he discovered it had been declining for five years, from 12% down to just 4%. The company was slowly dying, unable to compete with online retailers. The "cheap" price wasn't a bargain; it was the market telling him this business was in trouble.
The lesson? A low stock price means nothing if the business can't generate good returns on equity. Marcus now checks ROE before buying anything, and his portfolio performance has improved dramatically.
This ties into understanding the cycle of market emotions; sometimes what feels like a "bargain" is actually a value trap.
Teaching ROE to the Next Generation
If you're working on making your kid a millionaire, teaching them about ROE is invaluable.
Kid-Friendly ROE Explanation
"Imagine you and your friend both start lemonade stands. You each get $100 from your parents to start.
At the end of summer:
- You made $25 profit
- Your friend made $10 profit
You both started with the same $100, but you turned it into more money. That's basically what ROE measures—how good a company is at turning investment money into profits."
Practical Exercise for Teens
Have your teenager:
- Pick three companies they know (Apple, Nike, McDonald's, etc.)
- Look up their ROE on Yahoo Finance
- Compare the numbers
- Research why one might be higher than others
- Decide which they'd invest in and why
This builds critical thinking skills and financial literacy that will serve them for life.
Common ROE Mistakes to Avoid
Even experienced investors make these errors:
Mistake #1: Using ROE Alone
ROE is one piece of the puzzle, not the whole picture. Always combine it with other metrics and qualitative analysis.
Mistake #2: Ignoring Industry Context
A 12% ROE utility might be better than a 15% ROE tech company, depending on industry norms.
Mistake #3: Focusing on One Year
One year of great ROE could be a fluke. Look for consistency over 5-10 years.
Mistake #4: Not Checking Debt Levels
High ROE with high debt is risky. Always check the debt-to-equity ratio.
Mistake #5: Overlooking Negative Equity
Some companies show astronomical ROE because equity is negative. This is a red flag, not a good sign.
ROE and Passive Income Strategies
For investors focused on passive income, ROE plays a crucial role in selecting dividend stocks.
The ROE-Dividend Connection
Companies with high, stable ROE can:
- Pay sustainable dividends from genuine profits
- Grow dividends over time through reinvestment
- Maintain payouts during downturns thanks to strong fundamentals
Companies with low or declining ROE often:
- Cut dividends during tough times
- Have unsustainable payout ratios
- Struggle to grow distributions
The Ideal Dividend Stock ROE Profile
Look for:
- ROE between 15-25% (strong but sustainable)
- Stable ROE for 10+ years
- Payout ratio under 70% (room for dividend growth)
- Low debt-to-equity ratio
This combination suggests a company that generates strong returns, shares profits generously, and has staying power.
Advanced: ROE and the Magic Formula
Joel Greenblatt's "Magic Formula" investing strategy uses ROE (actually ROIC, but a similar concept) as one of two key metrics:
Magic Formula = High Return on Capital + Low Price
The strategy:
- Screen for companies with high returns on capital
- Filter for those trading at low valuations
- Buy a portfolio of 20-30 such companies
- Rebalance annually
Historical backtests show this simple strategy beating the market over long periods. ROE/ROIC identifies quality, while valuation metrics ensure you don't overpay.
Profit margin measures how much of each sales dollar becomes profit. ROE measures how much profit is generated from shareholder equity. A company can have great margins but poor ROE if it uses equity inefficiently.
Yes! ROE above 30-40% deserves scrutiny. It might indicate:
Excessive debt artificially inflates the number
Unsustainable competitive advantages
Accounting irregularities
Negative or very low equity
Always investigate why ROE is exceptionally high.
Usually, yes. Negative ROE means the company is losing money. However, startups and turnaround situations might temporarily show negative ROE while investing in future growth. Context matters.
For long-term investors, checking annually (when annual reports come out) is sufficient. For active investors, quarterly reviews make sense.
Neither is "better"; they measure different things. Use both:
ROE for understanding shareholder returns
ROA for comparing companies with different capital structures
Tools and Resources for Return on Equity Analysis
Free Resources
Financial Websites:
- Yahoo Finance: Quick ROE lookup for any public company
- Morningstar: Detailed ROE history and analysis
- Finviz: Stock screener with ROE filters
- SEC.gov: Official company filings (10-K annual reports)
Calculators:
- Use the interactive calculator earlier in this article
- Excel/Google Sheets for custom analysis
- Many brokerage platforms include built-in calculators
Premium Tools
For serious investors:
- Bloomberg Terminal: Professional-grade data (expensive)
- FactSet: Institutional-quality research
- S&P Capital IQ: Comprehensive financial data
- Koyfin: Affordable alternative with great visualizations
Educational Resources
- Investopedia: Detailed articles on ROE and related metrics
- SEC Investor Education: Free courses on reading financial statements
- Morningstar Investing Classroom: Tutorials on fundamental analysis
- Company annual reports: The primary source of financial data
Putting It All Together: Your ROE Action Plan
Ready to start using ROE in your investment decisions? Here's your step-by-step action plan:
Week 1: Learn and Practice
- ✅ Bookmark this article for reference
- ✅ Use the interactive calculator with 3-5 companies you're interested in
- ✅ Look up ROE for stocks you currently own
- ✅ Compare them to industry averages
Week 2: Analyze Your Portfolio
- ✅ Calculate ROE for each holding (or find it on financial sites)
- ✅ Identify any companies with ROE below 10%
- ✅ Research why their ROE is low
- ✅ Decide if you should hold, buy more, or sell
Week 3: Build a Watchlist
- ✅ Use a stock screener to find companies with ROE > 15%
- ✅ Filter by your preferred industries
- ✅ Check 5-year ROE trends for consistency
- ✅ Create a shortlist of 10-15 potential investments
Week 4: Deep Dive Research
- ✅ Pick 3 companies from your watchlist
- ✅ Run a full DuPont analysis on each
- ✅ Check debt levels, cash flow, and growth rates
- ✅ Read recent annual reports
- ✅ Make your first ROE-informed investment decision
Ongoing: Monitor and Adjust
- ✅ Review ROE quarterly for all holdings
- ✅ Watch for declining trends
- ✅ Rebalance based on changing fundamentals
- ✅ Continue learning and refining your strategy
Conclusion: ROE as Your Investment Compass
Return on Equity isn't just another financial metric to memorize; it's a powerful lens for seeing which companies truly create value for shareholders. Think of it as your compass in the often-confusing world of investing.
The companies that consistently generate high ROE (15-20% or better) while maintaining reasonable debt levels are the ones that compound wealth over decades. They're the businesses that turn your investment dollars into growing profits, year after year.
But remember: ROE is most powerful when combined with other metrics and qualitative analysis. It tells you how efficiently a company generates returns, but not whether the business model is sustainable, whether management is trustworthy, or whether the stock price is reasonable.
Your Next Steps
- Start small: Use ROE to evaluate just one or two stocks this week
- Build the habit: Make ROE analysis part of your research process
- Stay consistent: Check ROE trends annually for all holdings
- Keep learning: As you gain experience, add more sophisticated analysis techniques
Whether you're building a passive income portfolio, saving for retirement, or teaching your kids about investing, understanding Return on Equity gives you a massive advantage.
The stock market rewards investors who do their homework. ROE is one of the most important chapters in that homework; master it, and you'll be ahead of 90% of individual investors.
Now grab your calculator, pull up your brokerage account, and start putting this knowledge to work. Your future self will thank you.
Author Bio
Max Fonji is a financial educator and investment strategist with over a decade of experience helping everyday investors build wealth through smart, research-driven decisions. As the founder of TheRichGuyMath.com, Max breaks down complex financial concepts into actionable strategies that anyone can understand and apply. His mission is to democratize financial knowledge and help readers achieve financial independence through disciplined, informed investing.
Disclaimer
This article is for educational and informational purposes only and should not be construed as financial, investment, or professional advice. The information provided does not take into account your personal financial situation, objectives, or risk tolerance. Always conduct your own research and consider consulting with a qualified financial advisor before making any investment decisions. Past performance does not guarantee future results. Investing in stocks and securities involves risk, including the potential loss of principal. TheRichGuyMath.com and its authors are not responsible for any financial losses or damages resulting from the use of information provided in this article.

