Picture this: Two companies in the same industry. Both profitable. Both growing. One trades at $50 per share, the other at $200. Which is the better investment?
The price alone tells you nothing. Without context, stock prices are just numbers on a screen. This is where valuation ratios become essential tools in the math behind money.
Valuation ratios are financial metrics that help investors determine whether a stock is overpriced, underpriced, or fairly valued relative to its fundamentals. These ratios compare a company’s market price to key financial metrics like earnings, book value, sales, or cash flow. For anyone serious about evidence-based investing, understanding these metrics is non-negotiable.
This comprehensive guide breaks down everything beginners need to know about valuation ratios, what they are, which ones matter most, how to calculate them, and, most importantly, how to use them to make smarter investment decisions in 2025 and beyond.
Key Takeaways
- Valuation ratios compare the stock price to fundamental metrics like earnings, assets, or sales to determine if a stock is fairly priced
- No single ratio tells the complete story—investors should analyze multiple ratios together for comprehensive valuation analysis
- Industry context matters significantly—a “good” P/E ratio in technology differs dramatically from what’s normal in utilities
- Ratios work best for comparison—use them to compare companies within the same sector or track a single company’s valuation trends over time
- Understanding the math builds confidence—knowing how to calculate and interpret these ratios transforms you from a stock picker into an informed investor
What Are Valuation Ratios? The Foundation of Investment Analysis
Valuation ratios are mathematical formulas that relate a company’s stock price to its underlying financial performance or asset base. They answer one fundamental question: What am I actually paying for when I buy this stock?
Think of valuation ratios as the price tags of investing. When you buy groceries, you check the price per pound or price per ounce to compare value. When you invest, you check the price per dollar of earnings or the price per dollar of book value.
The Core Purpose of Valuation Metrics
Every valuation ratio serves a specific analytical purpose:
Price comparison: They standardize stock prices across companies of different sizes, making apples-to-apples comparisons possible.
Value assessment: They help identify whether current market prices reflect reasonable expectations based on financial fundamentals.
Relative analysis: They enable investors to compare companies within the same industry or sector on equal footing.
Trend identification: They reveal whether a company is becoming more or less expensive over time, independent of absolute price movements.
How Valuation Ratios Connect to Financial Statements
Understanding where valuation ratios come from builds financial literacy at a deeper level. These metrics pull data directly from the three core financial statements:
The income statement provides earnings, revenue, and EBITDA figures used in ratios like P/E, P/S, and EV/EBITDA.
The balance sheet supplies book value, total assets, and equity data for metrics like P/B and debt-to-equity ratios.
The cash flow statement offers operating cash flow and free cash flow numbers for cash-based valuation ratios.
Market price, the numerator in most ratios, comes from stock exchanges and represents the collective judgment of all market participants at any given moment.
Insight: Valuation ratios bridge the gap between market sentiment (price) and business reality (fundamentals). They translate abstract stock prices into concrete, comparable metrics that reveal whether optimism or pessimism is justified.
The Major Types of Valuation Ratios Every Investor Should Know
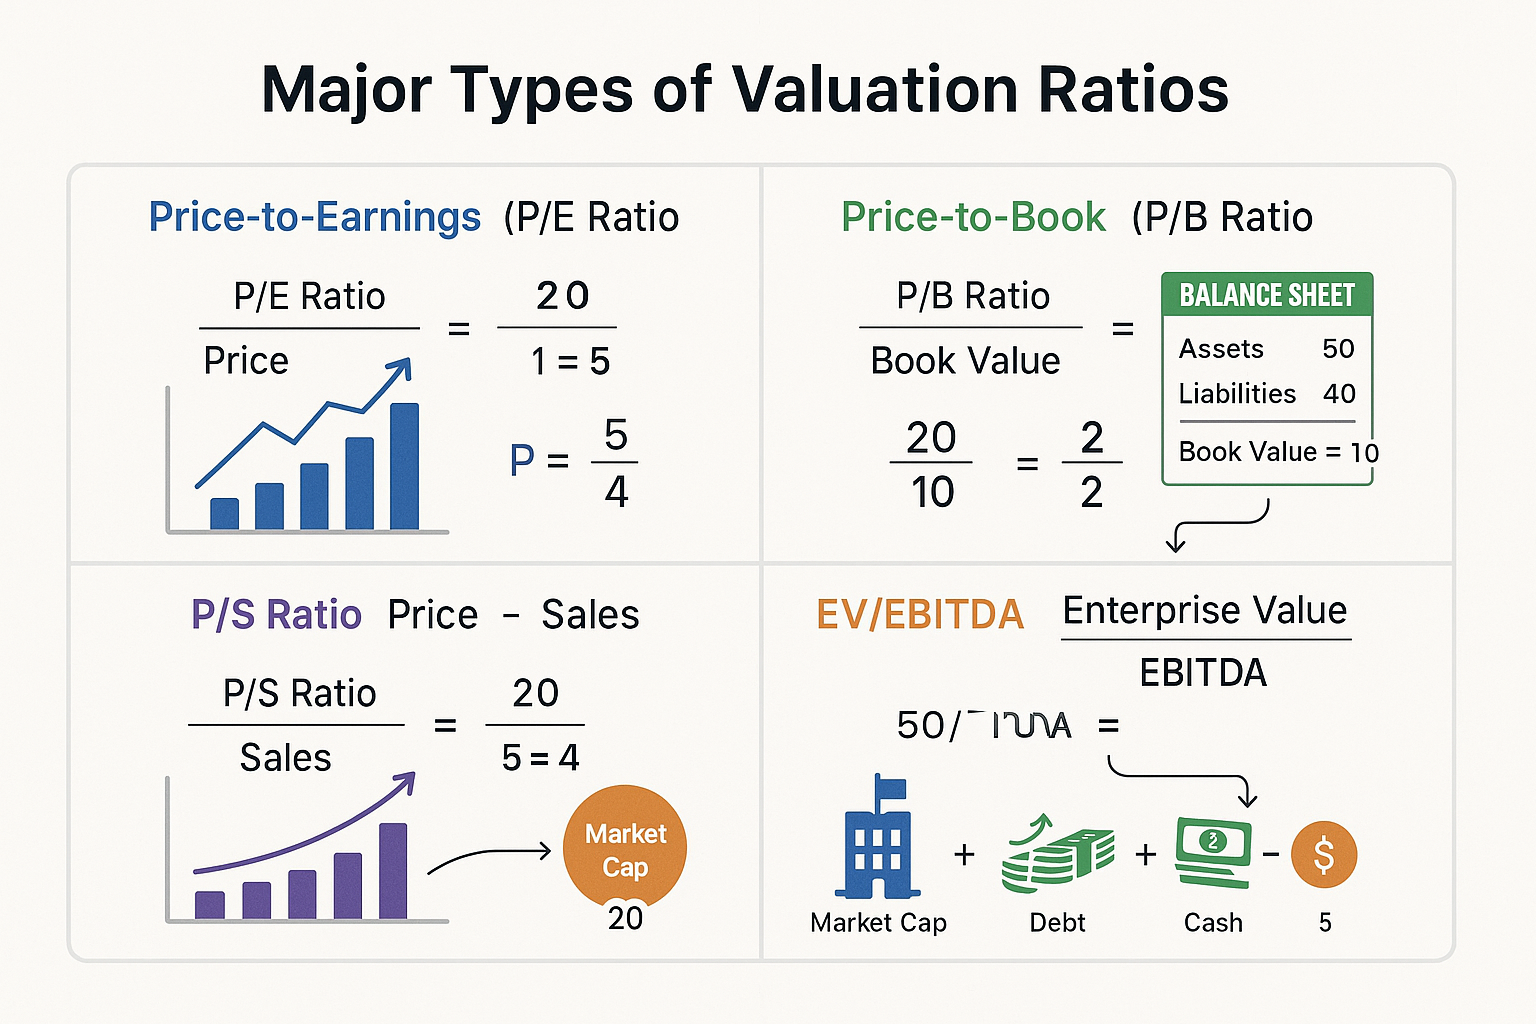
Different valuation ratios highlight different aspects of a company’s value proposition. Mastering the core ratios gives investors a complete analytical toolkit.
Price-to-Earnings Ratio (P/E): The Market’s Favorite Metric
The Price-to-Earnings (P/E) ratio compares a company’s stock price to its earnings per share. It’s the most widely used valuation metric in investing.
Formula: P/E Ratio = Market Price per Share ÷ Earnings per Share (EPS)
If a stock trades at $100 and the company earned $5 per share last year, the P/E ratio is 20. This means investors are paying $20 for every $1 of annual earnings.
What it tells you: The P/E ratio reveals how much investors are willing to pay for a company’s profit-generating ability. Higher P/E ratios suggest either:
- Expectations of strong future growth
- Market optimism about the company’s prospects
- Potential overvaluation if expectations aren’t met
Lower P/E ratios might indicate:
- Undervaluation and opportunity
- Slower expected growth
- Fundamental problems the market has identified
Two variations matter:
The trailing P/E uses actual earnings from the past 12 months. It’s based on facts, not forecasts.
The forward P/E uses projected earnings for the next 12 months. It incorporates growth expectations but relies on estimates that may prove wrong.
Industry context is critical. Technology companies often trade at P/E ratios of 30-50 because investors expect rapid growth. Utility companies might trade at P/E ratios of 12-18 because growth is slower and more predictable[1].
Price-to-Book Ratio (P/B): Valuing Assets Over Earnings
The Price-to-Book (P/B) ratio compares the market price to the company’s book value, the net worth shown on its balance sheet.
Formula: P/B Ratio = Market Price per Share ÷ Book Value per Share
Book value equals total assets minus total liabilities. It represents what shareholders would theoretically receive if the company liquidated everything and paid all debts.
What it tells you: The P/B ratio shows whether you’re paying more or less than the company’s accounting net worth.
A P/B ratio below 1.0 suggests the market values the company at less than its stated assets, potentially a bargain, or a sign that those assets aren’t as valuable as the balance sheet claims.
A P/B ratio above 3.0 indicates investors believe the company can generate returns far exceeding its asset base, common for asset-light businesses like software companies.
Best used for: Banks, insurance companies, real estate firms, and other asset-heavy businesses where book value closely reflects true economic value. Less useful for technology or service companies where intellectual property and human capital don’t appear on balance sheets.
Price-to-Sales Ratio (P/S): When Earnings Don’t Tell the Full Story
The Price-to-Sales (P/S) ratio compares market capitalization to total revenue.
Formula: P/S Ratio = Market Capitalization ÷ Total Revenue
or
P/S Ratio = Price per Share ÷ Sales per Share
What it tells you: The P/S ratio reveals how much investors pay for each dollar of company revenue, regardless of profitability.
This ratio proves especially valuable when analyzing:
- Unprofitable growth companies that are investing heavily for future market share
- Cyclical businesses experiencing temporary earnings downturns
- Companies with inconsistent earnings but stable revenue streams
A P/S ratio below 1.0 might indicate undervaluation, while ratios above 10 suggest either exceptional growth expectations or potential overvaluation.
The limitation: Revenue alone doesn’t equal value. A company can grow sales while destroying shareholder value if it operates at a loss. Always pair P/S analysis with profit margin trends and path to profitability.
Enterprise Value-to-EBITDA (EV/EBITDA): The Professional’s Choice
The EV/EBITDA ratio compares enterprise value to earnings before interest, taxes, depreciation, and amortization.
Formula: EV/EBITDA = Enterprise Value ÷ EBITDA
Enterprise Value (EV) = Market Cap + Total Debt – Cash and Cash Equivalents
What it tells you: This ratio provides a more complete valuation picture than P/E because it:
- Accounts for debt levels (highly leveraged companies look different than debt-free ones)
- Removes the effects of different tax structures and accounting choices
- Focuses on operating performance before financing decisions
EV/EBITDA ratios between 8-12 are typical for mature companies, while high-growth firms might trade at 15-25 or higher.
Why professionals prefer it: The EV/EBITDA ratio enables better cross-border comparisons (different countries have different tax rates) and more accurate merger and acquisition valuations. Private equity firms and corporate acquirers rely heavily on this metric.
Price-to-Cash Flow (P/CF): Following the Money
The Price-to-Cash Flow ratio compares stock price to operating cash flow per share.
Formula: P/CF Ratio = Market Price per Share ÷ Operating Cash Flow per Share
What it tells you: Cash flow is harder to manipulate than earnings through accounting choices. The P/CF ratio reveals valuation based on actual cash generation rather than accounting profits.
Companies with strong cash flow can:
- Invest in growth opportunities
- Pay dividends to shareholders
- Reduce debt
- Buy back shares
A lower P/CF ratio (relative to industry peers) might indicate undervaluation or superior cash generation efficiency.
PEG Ratio: Incorporating Growth Into Valuation
The Price/Earnings-to-Growth (PEG) ratio adjusts the P/E ratio for expected earnings growth.
Formula: PEG Ratio = P/E Ratio ÷ Annual EPS Growth Rate
If a company has a P/E of 30 and earnings are expected to grow 15% annually, the PEG ratio is 2.0 (30 ÷ 15).
What it tells you: The PEG ratio helps distinguish between expensive-but-justified valuations and genuine overvaluation.
A PEG ratio below 1.0 suggests the stock might be undervalued relative to its growth prospects. A PEG above 2.0 indicates investors are paying a premium even after accounting for growth.
The catch: The PEG ratio is only as good as the growth estimate. Overly optimistic projections create misleading PEG ratios that suggest bargains where none exist.
Insight: No single valuation ratio provides complete answers. The P/E ratio ignores debt. The P/B ratio misses intangible value. The P/S ratio overlooks profitability. Use multiple ratios together to build a comprehensive valuation picture, just as you’d use multiple tools to build a house.
How Investors Actually Use Valuation Ratios in Practice
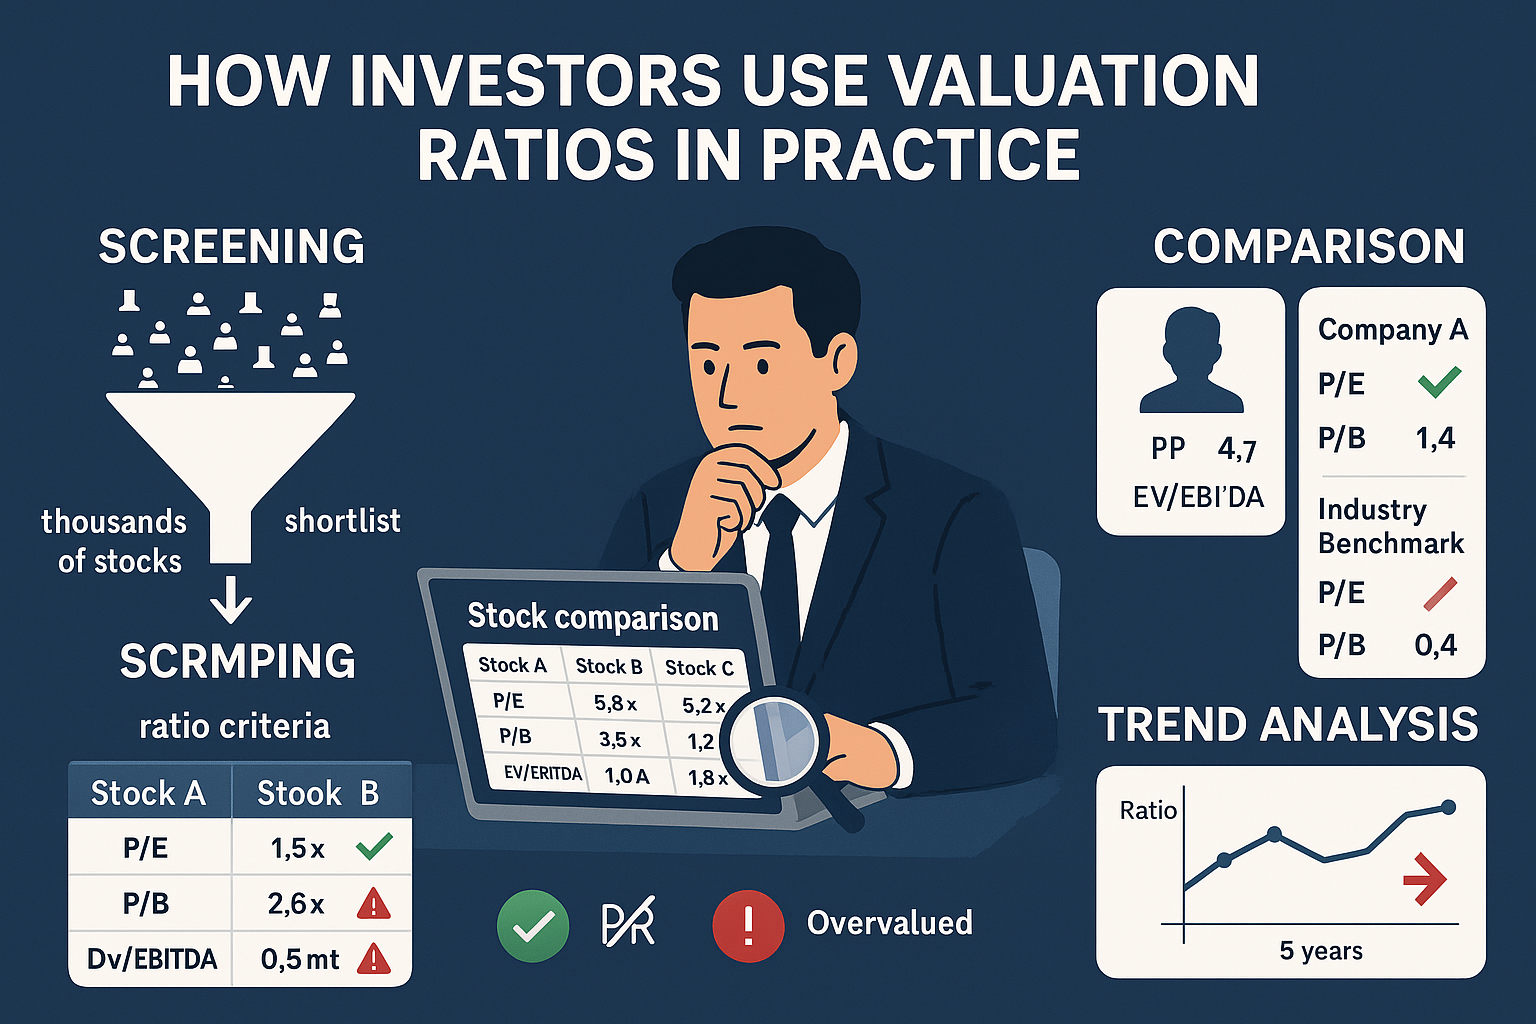
Understanding formulas is step one. Applying them effectively separates successful investors from those who merely collect data.
Comparative Analysis: The Primary Use Case
Valuation ratios work best when comparing similar companies. Absolute numbers mean little without context.
Same-sector comparison: Compare a company’s ratios to direct competitors operating in the same industry. If the average P/E ratio for pharmaceutical companies is 18 and your target company trades at 12, that gap demands investigation. Is it undervalued, or do fundamental problems justify the discount?
Historical comparison: Track how a company’s valuation ratios change over time. If a stock historically traded at a P/E of 15-20 but now sits at 8, either the market has identified new risks or an opportunity exists.
Market comparison: Benchmark individual stocks against broad market indices. When the S&P 500 trades at a P/E of 20 and you find quality companies at P/E ratios of 12, you’ve identified potential value opportunities.
Screening and Filtering: Finding Investment Candidates
Valuation ratios enable systematic stock screening. Investors can filter thousands of stocks to identify candidates meeting specific criteria:
Value screening example:
- P/E ratio < 15
- P/B ratio < 2.0
- Debt-to-equity < 0.5
- Dividend yield > 3%
Growth at reasonable price (GARP) screening:
- PEG ratio < 1.5
- Revenue growth > 15% annually
- P/S ratio < 3.0
- Positive free cash flow
These screens don’t identify perfect investments automatically. They create manageable shortlists for deeper research, similar to how the 4% rule provides a starting framework for retirement planning rather than a rigid mandate.
Identifying Value Traps vs. Genuine Opportunities
Low valuation ratios don’t automatically signal buying opportunities. Sometimes stocks are cheap for excellent reasons.
Value trap warning signs:
- Declining revenue for multiple consecutive quarters
- Deteriorating profit margins
- Increasing debt levels
- Loss of competitive advantages
- Management turnover or governance issues
Genuine value opportunity indicators:
- Temporary industry headwinds affecting all competitors
- One-time charges or restructuring costs depressing current earnings
- Market overreaction to fixable problems
- Strong balance sheet fundamentals despite low valuation
The difference between value traps and opportunities often lies in the trajectory. Is the business improving or deteriorating? Are problems temporary or structural?
Sector-Specific Valuation Norms
Different industries have different normal valuation ranges because business models, growth rates, and capital requirements vary dramatically.
Technology sector: High P/E ratios (25-40+) reflect rapid growth expectations and scalable business models with minimal marginal costs.
Utilities sector: Low P/E ratios (12-18) reflect stable, predictable cash flows with limited growth but also limited downside risk.
Financial sector: P/B ratios matter more than P/E because assets (loans, investments) drive value. Banks typically trade at P/B ratios of 0.8-1.5.
Consumer staples: Moderate P/E ratios (18-25) reflect steady demand and pricing power but limited growth potential.
Energy sector: Highly cyclical valuations tied to commodity prices. EV/EBITDA often works better than P/E for comparison.
Understanding these sector norms prevents false conclusions. A technology stock at a P/E of 30 isn’t necessarily expensive, while a utility at the same ratio would be dramatically overvalued.
Combining Valuation Ratios with Other Analysis
Smart investors integrate valuation ratios into broader analytical frameworks:
Fundamental analysis: Pair valuation metrics with profitability ratios, liquidity ratios, and leverage ratios for complete financial health assessment.
Qualitative factors: Consider competitive advantages, management quality, industry trends, and regulatory environments alongside numerical ratios.
Technical analysis: Some investors use valuation ratios to identify fundamentally sound companies, then use technical analysis to time entry and exit points.
Macroeconomic context: Interest rates dramatically affect valuation norms. When risk-free rates are 5%, investors demand different valuations than when rates are 1%. The discount rate environment matters.
Real-World Example: Applying Multiple Ratios
Consider analyzing two retail companies:
Company A:
- P/E ratio: 12
- P/B ratio: 1.8
- P/S ratio: 0.6
- EV/EBITDA: 7
- Revenue growth: 3% annually
Company B:
- P/E ratio: 28
- P/B ratio: 4.2
- P/S ratio: 1.9
- EV/EBITDA: 14
- Revenue growth: 18% annually
Company A appears cheaper on all metrics. But Company B is growing six times faster. Which is the better investment?
The answer depends on your investment strategy and time horizon. Value investors might prefer Company A’s immediate discount. Growth investors might accept Company B’s premium for superior expansion.
The PEG ratio helps here:
- Company A: 12 ÷ 3 = 4.0
- Company B: 28 ÷ 18 = 1.56
After adjusting for growth, Company B actually offers better value relative to its expansion rate. This demonstrates why using multiple ratios together reveals insights single metrics miss.
Insight: Valuation ratios are tools, not answers. They identify questions worth asking and companies worth researching. The best investors use ratios to generate hypotheses, then dig deeper into business quality, competitive position, and future prospects before making investment decisions.
Common Mistakes When Using Valuation Ratios (And How to Avoid Them)
Even experienced investors make predictable errors when applying valuation metrics. Awareness prevents costly mistakes.
Mistake #1: Ignoring Industry Context
Comparing P/E ratios across different sectors produces meaningless conclusions. A software company at a P/E of 40 isn’t necessarily more expensive than a bank at a P/E of 10.
The fix: Always compare companies within the same industry or sector. Use industry-average ratios as benchmarks, not market-wide averages.
Mistake #2: Relying on a Single Ratio
No valuation metric captures complete investment quality. A low P/E ratio might hide deteriorating fundamentals. A high P/S ratio might miss exceptional profitability.
The fix: Analyze at minimum 3-4 different valuation ratios together. Look for consistency across metrics or investigate discrepancies that reveal important nuances.
Mistake #3: Using Outdated or Incorrect Data
Valuation ratios are only as reliable as the data feeding them. Using last quarter’s earnings when new results are available produces inaccurate P/E ratios.
The fix: Source data from authoritative providers like company investor relations pages, SEC filings, or reputable financial data platforms. Verify calculation inputs before drawing conclusions.
Mistake #4: Forgetting About Debt
Market capitalization only represents equity value. Companies with heavy debt loads carry additional obligations that pure price-based ratios miss.
The fix: Use enterprise value-based ratios (EV/EBITDA, EV/Sales) when comparing companies with different capital structures. These metrics account for debt, providing more accurate comparisons.
Mistake #5: Treating Low Ratios as Automatic Buy Signals
Value traps exist because cheap stocks often deserve their low valuations. Declining businesses, obsolete products, and poor management justify discounts.
The fix: Investigate why valuation ratios are low. Distinguish between temporary challenges and permanent impairment. Look for catalysts that might close valuation gaps.
Mistake #6: Ignoring Earnings Quality
Not all earnings are created equal. Companies can manipulate accounting profits through aggressive revenue recognition, understating expenses, or other techniques.
The fix: Compare earnings-based ratios (P/E) with cash flow-based ratios (P/CF). Large discrepancies suggest earnings quality issues worth investigating. Review cash flow statements for confirmation.
Mistake #7: Overlooking Cyclicality
Cyclical companies show artificially low P/E ratios at earnings peaks and artificially high ratios at earnings troughs. Using current ratios without context misleads.
The fix: For cyclical businesses, use normalized earnings (average earnings across a full business cycle) or focus on EV/EBITDA ratios that smooth volatility better than P/E.
Mistake #8: Neglecting Growth Rates
A P/E ratio of 30 might represent excellent value for a company growing earnings 40% annually but terrible value for one growing 5% annually.
The fix: Calculate PEG ratios to incorporate growth expectations. Compare companies with similar growth profiles, not just similar business models.
Insight: The most dangerous mistake is false precision—believing valuation ratios provide exact answers rather than directional guidance. Markets are complex adaptive systems, not mathematical equations. Use ratios to inform judgment, not replace it.
Advanced Valuation Concepts for Deeper Analysis
Once you master basic valuation ratios, these advanced concepts sharpen analytical precision.
Adjusting for Share Buybacks and Dilution
Share count changes affect per-share metrics. Companies that aggressively buy back stock reduce share counts, inflating EPS and making P/E ratios appear lower. Companies issuing new shares dilute existing shareholders.
Tracking share count trends reveals whether improving per-share metrics reflect genuine business improvement or financial engineering. Look for companies that grow both total earnings and per-share earnings—a sign of authentic value creation.
Understanding GAAP vs. Non-GAAP Earnings
Many companies report two earnings figures: GAAP (Generally Accepted Accounting Principles) earnings and adjusted or non-GAAP earnings that exclude certain items.
Non-GAAP earnings can provide clearer pictures of ongoing operations by excluding one-time charges. They can also mislead when companies exclude recurring costs to inflate apparent profitability.
Best practice: Calculate valuation ratios using both GAAP and non-GAAP figures. If they diverge significantly, investigate what’s being excluded and whether those exclusions are justified.
The Role of Interest Rates in Valuation
Valuation ratios don’t exist in a vacuum. The broader interest rate environment dramatically affects what investors consider reasonable valuations.
When risk-free treasury yields are 1%, investors accept lower earnings yields (inverse of P/E ratio) from stocks. When treasuries yield 5%, stocks must offer more attractive valuations to compete.
The Fed model (controversial but widely referenced) suggests fair stock market P/E ratios should relate inversely to bond yields. While imperfect, this framework explains why market-wide P/E ratios expand during low-rate environments and contract when rates rise.
Sector Rotation and Valuation Cycles
Different sectors become attractive at different points in economic cycles, partly driven by changing relative valuations.
Early cycle: Financials and consumer discretionary stocks often lead as economic growth accelerates. Their valuations expand as earnings prospects improve.
Mid cycle: Industrial and technology stocks typically perform well as capital investment increases. Valuation expansion continues.
Late cycle: Energy and materials stocks often outperform as commodity prices rise. Value-oriented investors rotate toward defensive sectors trading at reasonable valuations.
Recession: Utilities, consumer staples, and healthcare—sectors with stable earnings—often maintain valuations better than cyclical sectors.
Understanding these patterns helps investors anticipate valuation changes before they fully materialize in prices.
International Valuation Comparisons
Comparing valuations across countries requires adjustments for:
Accounting standards: US GAAP differs from IFRS (International Financial Reporting Standards). Earnings calculations vary, affecting P/E ratios.
Tax rates: Countries with different corporate tax rates produce different after-tax earnings for similar pre-tax performance.
Growth expectations: Emerging markets often trade at higher P/E ratios than developed markets because growth prospects justify premium valuations.
Risk premiums: Political stability, currency risk, and market liquidity affect required returns. Higher-risk markets demand lower valuations (higher earnings yields) to compensate.
The Limitations of Historical Valuation Analysis
“This stock is cheap because it’s trading below its 10-year average P/E ratio” sounds logical but can mislead.
Business quality changes over time. A company that deserved a P/E of 20 a decade ago might merit only 12 today if competitive advantages have eroded.
Market structure evolves. The rise of index investing, algorithmic trading, and passive strategies has potentially changed how markets price securities.
Better approach: Understand why historical valuations existed. If the underlying drivers (growth rates, competitive position, industry dynamics) remain similar, historical comparisons add value. If fundamentals have shifted, historical averages become irrelevant anchors.
Insight: Advanced valuation analysis isn’t about complex formulas—it’s about contextual thinking. The best investors ask “why” repeatedly: Why is this ratio low? Why has it changed? Why might it normalize or stay depressed? Numbers start conversations; context provides answers.
Building Your Valuation Analysis Framework
Developing a systematic approach to valuation analysis improves consistency and decision quality.
Step 1: Gather Comprehensive Data
Start with authoritative sources:
Company filings: 10-K annual reports and 10-Q quarterly reports filed with the SEC contain verified financial data.
Investor presentations: Company investor relations pages offer management’s perspective on results and strategy.
Financial databases: Platforms like Morningstar, Yahoo Finance, and Bloomberg provide standardized data across companies.
Industry reports: Trade associations and research firms publish sector-specific analysis and benchmarks.
Step 2: Calculate Multiple Ratios
Build a valuation scorecard including:
- P/E ratio (trailing and forward)
- P/B ratio
- P/S ratio
- EV/EBITDA
- P/CF ratio
- PEG ratio
- Dividend yield (if applicable)
This comprehensive view reveals patterns single metrics miss.
Step 3: Establish Relevant Comparisons
Create comparison sets:
Peer group: 5-10 direct competitors in the same industry with similar business models
Industry averages: Sector-wide median ratios to identify outliers
Historical ranges: The company’s own valuation history over 5-10 years
Market benchmark: Broad market indices like the S&P 500 for context
Step 4: Investigate Discrepancies
When ratios diverge from comparisons, dig deeper:
Lower than peers: What risks has the market identified? Are they temporary or permanent? Is management addressing them?
Higher than peers: What advantages justify premium valuations? Are growth expectations realistic? Is the premium sustainable?
Changing over time: What’s driving valuation expansion or contraction? Has business quality improved or deteriorated?
Step 5: Integrate Qualitative Factors
Numbers alone don’t capture investment quality. Assess:
Competitive advantages: Does the company have sustainable moats (brand strength, network effects, cost advantages, switching costs)?
Management quality: Track record of capital allocation, strategic execution, and shareholder communication
Industry dynamics: Tailwinds or headwinds affecting all sector participants
Regulatory environment: Potential policy changes that could impact profitability
Step 6: Form a Valuation Conclusion
Synthesize quantitative and qualitative analysis into an actionable conclusion:
Significantly undervalued: Multiple ratios below historical and peer averages, strong fundamentals, identifiable catalysts for revaluation
Fairly valued: Ratios consistent with quality, growth prospects, and industry norms
Overvalued: Premium valuations requiring aggressive growth assumptions with limited margin for disappointment
Uncertain/Avoid: Conflicting signals, poor visibility, or fundamental deterioration
Step 7: Monitor and Reassess
Valuation analysis isn’t one-and-done. Quarterly earnings, industry changes, and market conditions shift valuations constantly.
Quarterly reviews: Update ratios after each earnings release. Track whether valuations are normalizing, expanding, or contracting.
Thesis validation: Confirm your investment thesis remains intact. If the reasons you bought a stock no longer apply, valuation becomes irrelevant.
Portfolio rebalancing: As valuations change, some positions become overvalued while others become attractive. Systematic rebalancing maintains risk management discipline.
Insight: The framework matters more than perfection. Consistent application of systematic valuation analysis, even with imperfect inputs, produces better long-term results than sporadic brilliant insights. Process defeats individual predictions over time.
Valuation Ratios in Different Investment Strategies
Different investing approaches emphasize different valuation metrics.
Value Investing: The Graham and Dodd Tradition
Value investors seek stocks trading below intrinsic value, using valuation ratios as primary screening tools.
Key metrics: P/E ratio, P/B ratio, P/CF ratio, dividend yield
Philosophy: Market inefficiency creates opportunities when prices temporarily diverge from fundamental value. Patient investors who buy cheap and wait for recognition earn superior returns.
Application: Screen for low P/E and P/B ratios, then investigate whether discounts reflect temporary problems or permanent impairment. Margin of safety—buying well below estimated intrinsic value—provides downside protection.
Famous value investors like Benjamin Graham, Warren Buffett, and Seth Klarman built fortunes identifying undervalued securities through rigorous ratio analysis combined with business quality assessment.
Growth Investing: Paying for Future Potential
Growth investors accept higher current valuations for companies with exceptional expansion prospects.
Key metrics: PEG ratio, P/S ratio, EV/EBITDA
Philosophy: Exceptional businesses growing rapidly deserve premium valuations. The power of compound growth over time justifies paying higher prices today for much larger earnings tomorrow.
Application: Identify companies with sustainable competitive advantages in large addressable markets. Accept P/E ratios of 30-50+ if growth rates justify them. Use PEG ratios to distinguish reasonable premiums from irrational exuberance.
Growth investing requires more faith in future execution than value investing. The risk is overpaying for growth that fails to materialize.
Growth at a Reasonable Price (GARP): The Middle Path
GARP investors seek the sweet spot between value and growth—companies with strong growth prospects trading at reasonable valuations.
Key metrics: PEG ratio (ideally below 1.5), P/E relative to growth rate, EV/EBITDA
Philosophy: The best investments combine quality, growth, and reasonable valuation. Avoid both value traps and overpriced growth stories.
Application: Screen for companies growing earnings 15%+ annually while trading at P/E ratios below 25. This approach, popularized by Peter Lynch, balances upside potential with downside protection.
Dividend Investing: Income-Focused Valuation
Dividend investors prioritize current income and valuation metrics that assess dividend sustainability.
Key metrics: Dividend yield, P/E ratio, payout ratio (dividends ÷ earnings), free cash flow
Philosophy: Reliable dividend income provides returns independent of price fluctuations. Sustainable dividends from quality companies generate compound growth through reinvestment.
Application: Seek dividend yields above market averages (3-5%+) combined with payout ratios below 70% (indicating sustainability). Use P/E and P/B ratios to avoid overpaying for yield.
Momentum Investing: Valuation as Context, Not Driver
Momentum investors buy stocks with strong recent performance, betting trends continue.
Key metrics: Valuation ratios provide context but don’t drive decisions. Price trends, relative strength, and technical indicators matter more.
Philosophy: Markets trend. Stocks that have outperformed recently often continue outperforming in the near term.
Application: Use valuation ratios to avoid obvious bubbles but don’t let “expensive” valuations prevent buying strong momentum stocks. Exit when momentum fades, regardless of valuation.
Index Investing: Accepting Market Valuations
Index investors buy broad market exposure regardless of current valuations.
Key metrics: Market-wide P/E ratios (like the S&P 500 P/E) provide context for expected returns but don’t trigger buying or selling.
Philosophy: Market timing is unreliable. Consistent exposure to diversified portfolios through all valuation environments produces superior risk-adjusted returns versus active management.
Application: Understand that high market-wide P/E ratios (above 25) historically precede lower subsequent returns, while low ratios (below 15) precede higher returns. Adjust expectations, not allocations. Continue dollar-cost averaging regardless of valuations.
Insight: Your investment strategy should determine which valuation ratios you emphasize, not the other way around. Value investors and growth investors can both succeed using different metrics and frameworks. Consistency with your chosen approach matters more than adopting someone else’s methodology.
Practical Tools and Resources for Valuation Analysis
Effective valuation analysis requires reliable data sources and analytical tools.
Free Financial Data Sources
SEC EDGAR Database: The authoritative source for company filings. All public companies file 10-K, 10-Q, and 8-K reports here. Free, comprehensive, and verified.
Yahoo Finance: Provides key statistics, financial statements, and historical data for most publicly traded companies. Easy interface for quick ratio calculations.
Finviz: Excellent stock screener with pre-calculated valuation ratios. Filter thousands of stocks by P/E, P/B, P/S, and other metrics instantly.
Morningstar: Offers free basic data including valuation ratios, financial health grades, and analyst reports for registered users.
Company investor relations pages: Most companies publish earnings presentations, annual reports, and financial supplements directly on their websites.
Premium Research Platforms
Bloomberg Terminal: Professional-grade platform with comprehensive data, analytics, and screening tools. Expensive ($24,000+ annually) but industry standard for institutional investors.
FactSet: Institutional research platform with deep financial data, screening capabilities, and modeling tools.
S&P Capital IQ: Detailed financial data, comparable company analysis, and valuation multiples across industries.
Morningstar Premium: Enhanced version with detailed analyst reports, fair value estimates, and comprehensive screening tools.
Screening Tools
Finviz Screener: Free tool enabling multi-criteria screening by valuation ratios, fundamental metrics, and technical indicators.
Stock Rover: Powerful screening and research platform with free and premium tiers. Excellent for comparative analysis.
Portfolio123: Advanced screening and backtesting platform for systematic investors.
TradingView: Primarily technical analysis-focused but includes fundamental screening capabilities.
Calculation Spreadsheets
Building your own valuation spreadsheet in Excel or Google Sheets provides flexibility and a deeper understanding:
Basic template structure:
- Input section: Current price, shares outstanding, key financial metrics
- Calculation section: Automated ratio formulas
- Comparison section: Peer companies and historical averages
- Visualization section: Charts showing ratio trends
Creating custom spreadsheets forces you to understand exactly what you’re calculating and why, valuable learning that pre-calculated ratios don’t provide.
Educational Resources
CFA Institute: Offers free research and educational content on valuation methodologies used by professional analysts.
Investopedia: Comprehensive definitions and examples of valuation concepts with practical applications.
Aswath Damodaran’s website: NYU professor and valuation expert publishes free data sets, papers, and educational materials on corporate valuation.
Corporate finance textbooks: “Valuation” by McKinsey & Company and “Investment Valuation” by Aswath Damodaran provide academic rigor with practical application.
Insight: Free tools provide 90% of what most investors need for effective valuation analysis. Premium platforms add convenience and depth, but aren’t necessary for successful investing. The constraint is rarely data availability; it’s analytical discipline and consistent application.
📊 Valuation Ratio Calculator
Calculate key valuation metrics instantly
📈 Valuation Analysis
Conclusion: Making Valuation Ratios Work for Your Investment Success
Valuation ratios transform abstract stock prices into concrete, comparable metrics that reveal whether market prices reflect reasonable expectations. They’re the essential bridge between market sentiment and business fundamentals.
No single ratio tells the complete story. The P/E ratio ignores debt. The P/B ratio misses intangible value. The P/S ratio overlooks profitability. Smart investors use multiple ratios together, understanding that comprehensive analysis beats single-metric simplicity.
Context determines meaning. A P/E ratio of 30 signals overvaluation in utilities, but a potential opportunity in technology. Industry norms, growth rates, business quality, and macroeconomic conditions all shape whether specific valuations represent bargains or traps.
The math behind money isn’t complicated—it’s just division and comparison. But applying these simple calculations consistently, with proper context and disciplined analysis, separates successful long-term investors from those who chase prices without understanding value.
Your Next Steps
Start practicing: Pick three companies in the same industry. Calculate their P/E, P/B, P/S, and EV/EBITDA ratios. Compare them. Investigate why differences exist.
Build a watchlist: Identify 10-15 quality companies you’d like to own. Track their valuation ratios quarterly. When ratios reach attractive levels relative to history and peers, you’ll have the conviction to act.
Develop your framework: Decide which ratios align with your investment philosophy. Value investors emphasize different metrics than growth investors. Consistency matters more than perfection.
Keep learning: Valuation analysis is a skill that improves with practice. Each company you analyze, each earnings report you review, and each investment decision you make builds pattern recognition that enhances future judgments.
Integrate with broader analysis: Remember that valuation ratios are tools within a larger analytical framework. Combine them with balance sheet analysis, competitive assessment, management evaluation, and risk management principles.
The investors who build lasting wealth don’t have secret formulas or insider information. They have disciplined processes, patient temperaments, and systematic approaches to understanding what they’re paying for when they invest. Valuation ratios provide the mathematical foundation for that understanding.
Master these metrics. Apply them consistently. Combine them with business quality assessment. And you’ll transform from someone who buys stock prices into an investor who acquires ownership stakes in businesses at prices that make mathematical sense.
That transformation from price taker to value assessor represents the difference between hoping for returns and engineering them through evidence-based investing and financial literacy.
References
[1] Damodaran, A. (2025). “Equity Risk Premiums: Determinants, Estimation and Implications.” Stern School of Business, New York University.
[2] CFA Institute. (2024). “Equity Valuation: A Survey of Professional Practice.” CFA Institute Research Foundation.
Author Bio
Max Fonji is the founder of The Rich Guy Math, a financial education platform dedicated to teaching the mathematical principles behind wealth building and evidence-based investing. With a background in financial analysis and data science, Max translates complex financial concepts into clear, actionable insights for investors at all levels. His work focuses on helping readers understand the cause-and-effect relationships that drive investment returns, enabling confident decision-making through financial literacy and quantitative reasoning.
Educational Disclaimer
This article is provided for educational and informational purposes only and does not constitute financial, investment, tax, or legal advice. The Rich Guy Math and its authors are not registered investment advisors or financial planners. Valuation ratios are analytical tools that should be used as part of comprehensive research, not as sole determinants of investment decisions.
All investments carry risk, including potential loss of principal. Past performance does not guarantee future results. Valuation metrics reflect historical data and current market conditions, which can change rapidly. Different investors may interpret the same ratios differently based on their investment objectives, time horizons, and risk tolerance.
Before making any investment decisions, consult with qualified financial professionals who understand your specific financial situation, goals, and constraints. The examples and calculations presented in this article are for illustrative purposes and may not reflect actual market conditions or investment outcomes.
The Rich Guy Math may receive compensation through affiliate relationships with some of the companies and products mentioned in this article. Such relationships do not influence our editorial content or analytical frameworks.
Frequently Asked Questions About Valuation Ratios
What is a good P/E ratio for stocks?
There’s no universal “good” P/E ratio—it depends on industry, growth expectations, and market conditions. A P/E between 15–25 is common for stable, established companies. High-growth sectors like technology may trade at 30–50+, while mature industries such as utilities typically fall between 12–18. Always compare a company’s P/E to industry peers and its historical averages rather than relying on absolute numbers.
How do valuation ratios differ from profitability ratios?
Valuation ratios compare a company’s market price to financial metrics, answering: “What am I paying for this stock?” Profitability ratios—such as return on equity or profit margin—evaluate how efficiently a company generates profits, answering: “How well is this business performing?” Valuation ratios reflect market sentiment, while profitability ratios reflect operating strength. Both are needed for complete investment analysis.
Can valuation ratios be used for private companies?
Yes, but the approach is different. Private companies don’t have stock prices, so analysts estimate value using comparable public companies or discounted cash flow (DCF) methods. Ratios like EV/EBITDA work especially well for private firms because they rely on enterprise value rather than stock price, making them easier to calculate using available financial data.
Why do some profitable companies have negative P/E ratios?
A company can have strong revenue or operating performance but still report net losses due to high expenses, restructuring costs, or growth investments—producing a negative P/E ratio. Because a negative P/E is not meaningful for valuation, investors typically use alternative metrics such as price-to-sales, EV/Revenue, or cash flow–based ratios for unprofitable companies.
How often should investors recalculate valuation ratios?
Valuation ratios should typically be updated quarterly after companies release earnings. Active investors may review ratios monthly to stay aligned with market movements. Long-term investors can rely on quarterly or semi-annual updates unless major news or sharp market changes occur, which may require immediate reassessment.
Do valuation ratios work in all market conditions?
Valuation ratios remain useful across all markets, but interpretation changes based on economic cycles. In bull markets, valuations tend to expand as optimism grows; in bear markets, ratios contract as fear increases. What appears “cheap” or “expensive” shifts with sentiment. Focus on relative comparisons—peers, sectors, and historical averages—rather than absolute P/E or valuation levels during extreme market environments.