In 2008, Lehman Brothers collapsed under the weight of $613 billion in debt, a capital structure so heavily leveraged that a single market downturn erased 158 years of business history. Meanwhile, Apple entered the same financial crisis with minimal debt and emerged stronger, eventually becoming the world’s most valuable company. The difference? Capital structure, the mathematical framework that determines whether a company thrives or fails when economic conditions shift.
Capital structure represents the specific mix of debt and equity a company uses to finance its operations and growth. This fundamental concept affects everything from a company’s risk profile to its ability to weather economic storms, yet most investors overlook its critical importance until it’s too late.
Understanding capital structure provides the analytical foundation for evaluating any business investment. The math behind money reveals that how a company finances itself often matters more than what it produces. This guide breaks down the mechanics, formulas, and real-world applications that separate financially sound companies from those teetering on the edge of insolvency.
Key Takeaways
- Capital structure is the combination of debt and equity a company uses to fund operations, directly impacting financial risk and returns
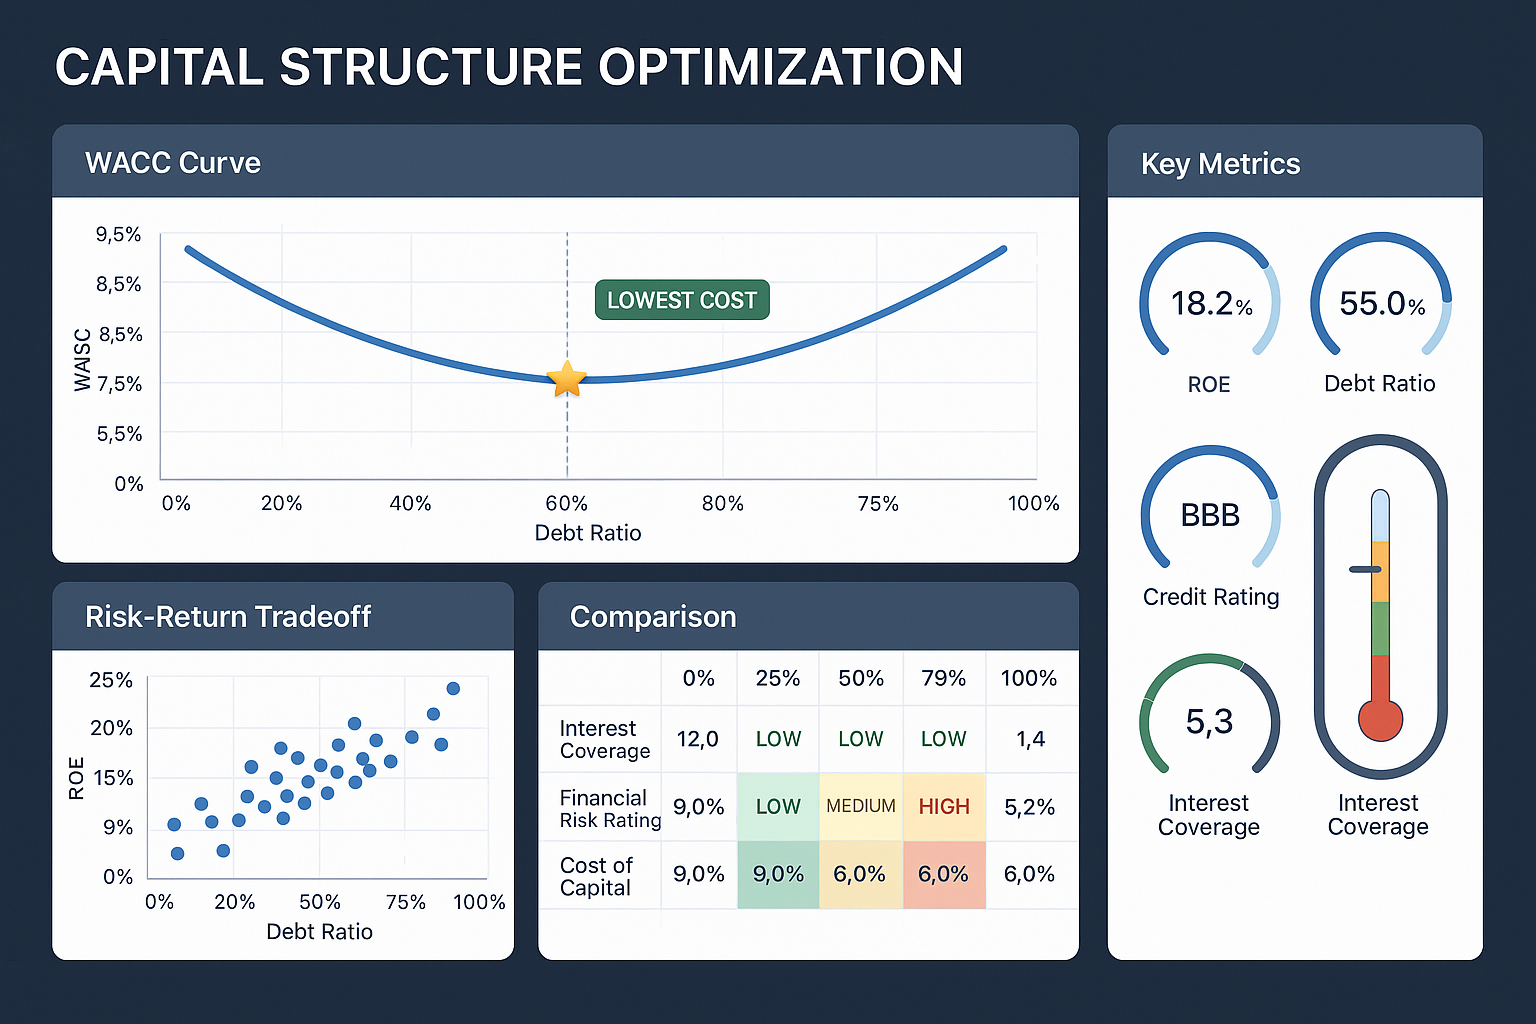
- The optimal capital structure minimizes the weighted average cost of capital (WACC) while balancing tax benefits against bankruptcy risk
- Debt financing offers tax advantages but increases financial leverage and fixed obligations; equity financing provides flexibility but dilutes ownership
- Different industries require different capital structures; capital-intensive businesses typically carry more debt than technology or service companies
- Investors can assess company health by analyzing debt-to-equity ratios, interest coverage, and how capital structure aligns with business model fundamentals
What Is Capital Structure? The Foundation of Corporate Finance
Capital structure defines the permanent financing mix a company maintains on its balance sheet. Every dollar a business deploys comes from one of two sources: borrowed money (debt) or owner investment (equity). This composition creates the financial architecture that supports all business operations.
The capital structure equation is deceptively simple:
Total Capital = Total Debt + Total Equity
Yet this formula drives complex financial outcomes. Debt includes bonds, bank loans, credit lines, and any obligation requiring repayment with interest. Equity encompasses common stock, preferred shares, and retained earnings, the accumulated profits a company reinvests rather than distributes to shareholders.
Why Capital Structure Matters
Capital structure determines three critical business outcomes:
Risk exposure: Higher debt levels amplify both gains and losses. When revenue increases, leveraged companies generate outsized returns for equity holders because debt holders receive only their fixed interest payments. Conversely, when revenue declines, debt obligations remain constant while equity value evaporates.
Cost of capital: Different financing sources carry different costs. Debt typically costs less than equity because interest payments are tax-deductible and creditors accept lower returns in exchange for priority claims on assets. The weighted average cost of capital (WACC) represents the blended rate a company pays for financing.
Financial flexibility: Companies with conservative capital structures maintain borrowing capacity for emergencies or opportunities. Overleveraged firms lose this optionality—they cannot access additional capital when circumstances change.
The mathematics prove straightforward: a company with 40% debt and 60% equity has fundamentally different risk characteristics than one with 80% debt and 20% equity, even if both operate identical businesses.
The Tax Shield Advantage
Debt creates a unique financial benefit unavailable to equity: the interest tax shield. Because governments allow companies to deduct interest expenses before calculating taxable income, debt financing effectively costs less than the stated interest rate.
Tax Shield Value = Interest Expense × Corporate Tax Rate
A company paying $10 million in annual interest with a 21% corporate tax rate saves $2.1 million in taxes. This $2.1 million represents value transferred from the government to shareholders, a mathematical advantage that makes moderate debt attractive for most businesses.
However, this benefit has limits. Excessive debt increases bankruptcy probability, and the costs of financial distress eventually exceed tax savings. The optimal capital structure exists at the point where marginal tax benefits equal marginal bankruptcy costs.
Types of Capital Structure Components: Debt vs Equity Financing

Understanding capital structure requires examining each financing component’s distinct characteristics, costs, and strategic implications.
Debt Financing: Borrowed Capital
Debt represents borrowed funds that must be repaid according to contractual terms. This category includes multiple instruments with varying characteristics:
Senior secured debt: Bank loans and credit facilities backed by specific assets. These carry the lowest interest rates because lenders hold the first claim on collateral if the company defaults. Senior debt typically includes restrictive covenants limiting management’s financial flexibility.
Unsecured bonds: Corporate bonds without asset backing, relying instead on the company’s general creditworthiness. Investment-grade bonds (rated BBB- or higher) cost less than high-yield “junk” bonds (rated BB+ or lower), reflecting default risk differences.
Subordinated debt: Junior obligations that rank below senior debt in bankruptcy proceedings. Because subordinated lenders accept higher risk, they demand higher interest rates, sometimes 3-5 percentage points above senior debt costs.
Convertible debt: Bonds that can convert into equity shares under specified conditions. These hybrid securities typically carry lower interest rates because investors value the conversion option.
Debt financing offers several mathematical advantages:
Tax deductibility: Interest payments reduce taxable income, lowering the effective cost of debt
No ownership dilution: Borrowing preserves existing shareholders’ ownership percentages and control rights
Predictable costs: Fixed interest rates create known obligations for financial planning
Yet debt imposes significant constraints:
Mandatory payments: Interest and principal obligations continue regardless of business performance
Bankruptcy risk: Excessive debt increases insolvency probability during downturns
Restrictive covenants: Loan agreements often limit dividends, acquisitions, and additional borrowing
Financial leverage: Debt magnifies losses during revenue declines, potentially triggering default
The debt-to-equity ratio quantifies leverage intensity, while the interest coverage ratio measures the company’s ability to service debt obligations from operating income.
Equity Financing: Ownership Capital
Equity represents ownership claims on company assets and earnings. Unlike debt, equity has no maturity date and requires no mandatory payments. This category includes:
Common stock: Basic ownership shares conferring voting rights and residual claims on assets. Common shareholders receive dividends only after all other obligations are satisfied, but they benefit from unlimited upside potential if the company succeeds.
Preferred stock: Hybrid securities with characteristics of both debt and equity. Preferred shareholders receive fixed dividends before common shareholders but typically lack voting rights. In bankruptcy, preferred claims rank above common stock but below all debt.
Retained earnings: Profits the company reinvests rather than distributes as dividends. Retained earnings represent the most cost-effective equity source because they avoid issuance costs and don’t dilute existing ownership.
Equity financing provides distinct strategic advantages:
Financial flexibility: No mandatory payments during difficult periods
Permanent capital: Equity never requires repayment, supporting long-term investments
Lower bankruptcy risk: Absence of fixed obligations reduces insolvency probability
Enhanced borrowing capacity: Strong equity bases support future debt issuance
However, equity carries high costs:
Ownership dilution: Issuing new shares reduces existing shareholders’ ownership percentages
Higher cost of capital: Equity investors demand higher returns than debt holders because they accept greater risk
No tax benefits: Dividend payments aren’t tax-deductible, unlike interest expenses
Voting control: New equity issuance can shift control dynamics and strategic direction
The equity ratio measures the proportion of assets financed by ownership capital, while the equity multiplier shows how leverage amplifies returns on equity.
The Optimal Mix: Balancing Debt and Equity
No universal capital structure suits all companies. The optimal mix depends on:
Business model stability: Companies with predictable cash flows (utilities, consumer staples) can safely carry more debt than businesses with volatile revenues (technology startups, cyclical manufacturers).
Asset tangibility: Firms with substantial physical assets can pledge collateral for secured debt. Service businesses with primarily intangible assets have limited borrowing capacity.
Growth stage: Mature companies generate excess cash flow suitable for debt service, while growth companies often require equity financing to fund expansion without fixed payment obligations.
Tax position: Profitable companies benefit more from interest tax shields than unprofitable firms that pay no taxes, regardless of capital structure.
The trade-off theory of capital structure suggests that companies balance tax benefits against bankruptcy costs. The pecking order theory proposes that companies prefer internal financing first, then debt, and finally equity, minimizing information asymmetry and issuance costs.
Capital Structure Examples: Real-World Applications Across Industries

Examining actual company capital structures reveals how different business models require different financing approaches. The math behind money shows that industry economics largely dictate appropriate leverage levels.
Technology Companies: Equity-Heavy Structures
Apple Inc. (2024 Data)
- Total Debt: $106 billion
- Total Equity: $74 billion
- Debt-to-Equity Ratio: 1.43
- Debt-to-Total Capital: 59%
Apple’s capital structure appears debt-heavy for a technology company, but context matters. The company maintains $162 billion in cash and marketable securities, making its net debt position significantly lower. Apple borrowed primarily to fund share buybacks and dividends while keeping overseas cash untaxed, a strategic financial decision rather than an operational necessity.
Most technology companies maintain minimal debt because:
- Intangible assets: Software and intellectual property provide poor loan collateral
- Revenue volatility: Rapid technological change creates unpredictable cash flows
- Growth options: Preserving financial flexibility allows quick pivots and acquisitions
- High equity valuations: Strong stock prices make equity financing relatively inexpensive
Microsoft Corporation (2024 Data)
- Total Debt: $79 billion
- Total Equity: $238 billion
- Debt-to-Equity Ratio: 0.33
- Debt-to-Total Capital: 25%
Microsoft’s conservative 25% debt ratio reflects typical technology sector patterns. The company generates massive free cash flow ($56 billion in fiscal 2024) and requires minimal capital expenditure relative to revenue. This profile supports equity-heavy financing with selective debt issuance for tax optimization.
Utility Companies: Debt-Heavy Structures
Duke Energy Corporation (2024 Data)
- Total Debt: $78 billion
- Total Equity: $52 billion
- Debt-to-Equity Ratio: 1.50
- Debt-to-Total Capital: 60%
Utility companies like Duke Energy maintain high leverage because their business models support it:
- Regulated returns: Government regulation guarantees specific profit margins, creating predictable cash flows
- Capital intensity: Power plants and transmission infrastructure require enormous upfront investments
- Stable demand: Electricity consumption remains relatively constant regardless of economic conditions
- Tangible assets: Physical infrastructure serves as excellent debt collateral
The regulated utility model allows 50-60% debt ratios that would bankrupt most other businesses. Regulators even factor debt costs into approved rate structures, effectively guaranteeing debt service coverage.
Retail Companies: Moderate Leverage
Walmart Inc. (2024 Data)
- Total Debt: $64 billion
- Total Equity: $91 billion
- Debt-to-Equity Ratio: 0.70
- Debt-to-Total Capital: 41%
Walmart’s moderate 41% debt ratio balances several factors:
- Stable revenue: Consumer staples generate consistent cash flow through economic cycles
- Real estate collateral: Store properties and distribution centers support secured borrowing
- Working capital needs: Inventory financing requires substantial capital
- Competitive pressure: Maintaining financial flexibility allows a rapid response to competitive threats
Contrast Walmart with former retail giant Toys “R” Us, which collapsed in 2017 under an 87% debt ratio. The leveraged buyout that took Toys “R” Us private in 2005 saddled the company with $5 billion in debt—interest obligations that consumed cash flow needed for store modernization and e-commerce investment.
Financial Services: Unique Capital Structures
JPMorgan Chase (2024 Data)
- Total Debt: $355 billion
- Total Equity: $321 billion
- Debt-to-Equity Ratio: 1.11
- Debt-to-Total Capital: 53%
Banks operate with capital structures that appear highly leveraged but function differently from operating companies. Bank “debt” includes customer deposits, a stable, low-cost funding source. Regulatory requirements mandate minimum equity ratios (typically 8-12% of risk-weighted assets) to protect depositors and maintain financial system stability.
The capitalization ratio measures how much of a bank’s funding comes from long-term debt versus equity, providing insight into financial stability beyond simple debt-to-equity calculations.
Startup Companies: All Equity Initially
Typical Early-Stage Startup
- Total Debt: $0
- Total Equity: $2 million (venture capital)
- Debt-to-Equity Ratio: 0
- Debt-to-Total Capital: 0%
Startups begin with 100% equity financing because they lack the cash flow, assets, and credit history required for debt. As companies mature and demonstrate revenue stability, they gradually add debt to optimize their capital structure and reduce the overall cost of capital.
This progression illustrates the lifecycle of capital structure evolution:
Stage 1 (Startup): 100% equity from founders and angel investors
Stage 2 (Growth): Additional equity rounds from venture capital firms
Stage 3 (Expansion): First debt issuance using revenue-based lending or venture debt
Stage 4 (Maturity): Optimized debt-equity mix based on industry norms and business model
Stage 5 (Decline): Deleveraging to preserve financial flexibility
Understanding these patterns helps investors assess whether a company’s capital structure aligns with its business stage and industry position. Misalignment often signals financial distress or strategic confusion.
How Capital Structure Works: The Mechanics and Mathematics
Capital structure functions through precise mathematical relationships that determine a company’s cost of capital, risk profile, and ultimately its enterprise value. Understanding these mechanics separates sophisticated investors from those who merely follow stock tips.
Calculating the Weighted Average Cost of Capital (WACC)
The weighted average cost of capital represents the blended rate a company pays for financing. This metric drives investment decisions—projects must generate returns exceeding WACC to create shareholder value.
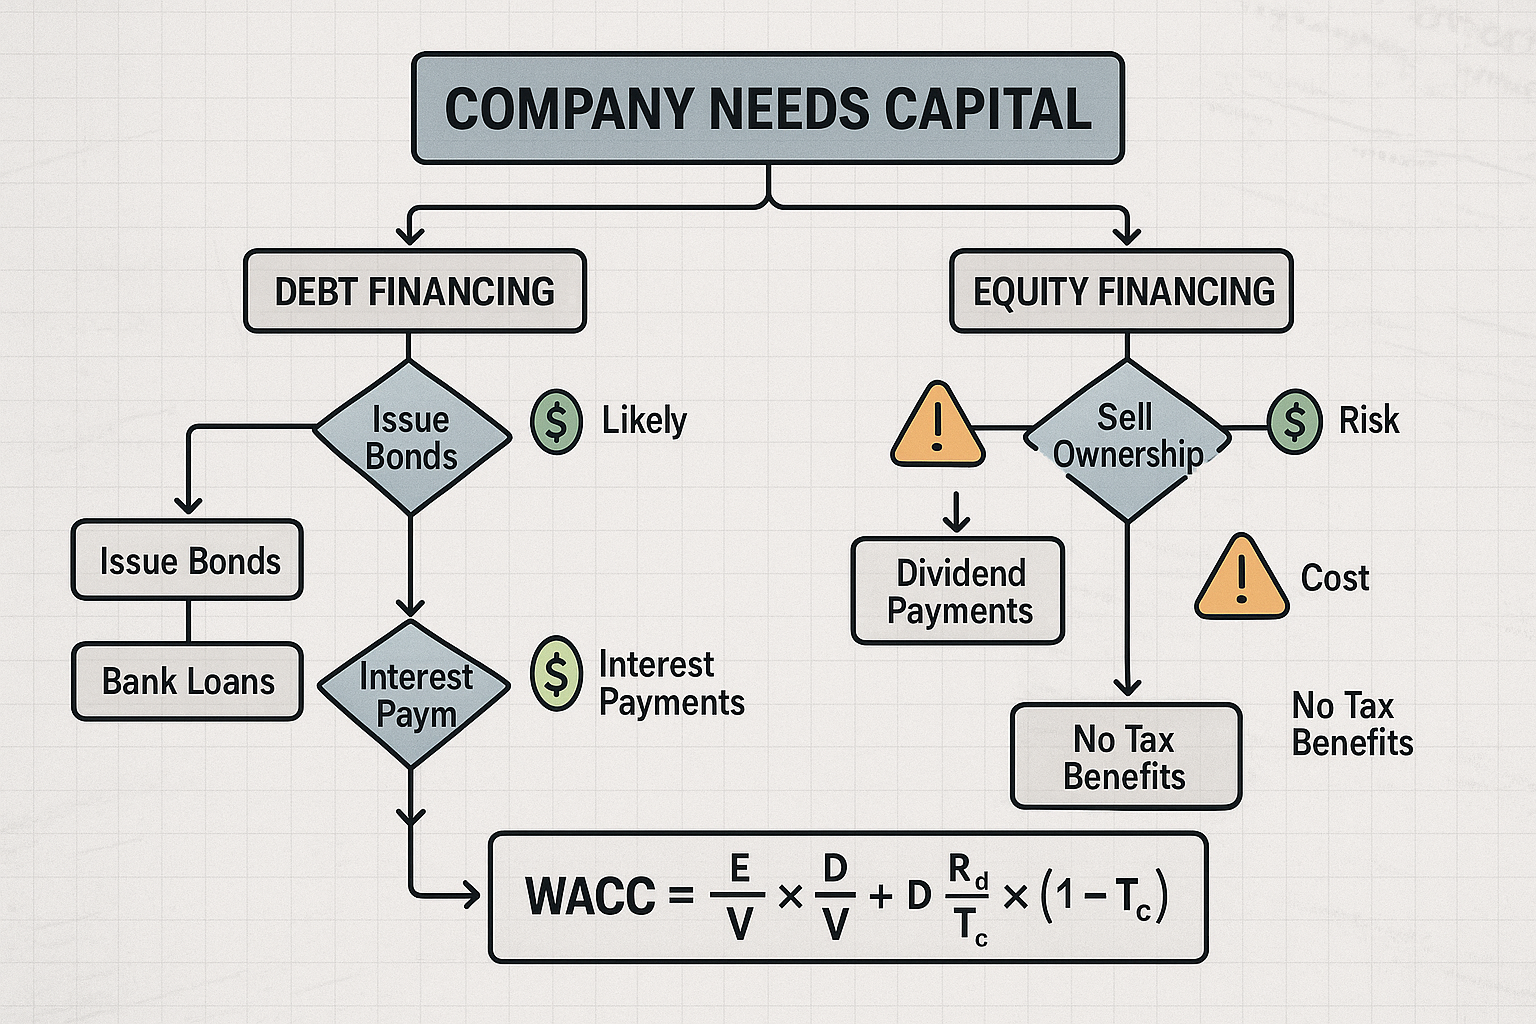
WACC Formula:
WACC = (E/V × Re) + (D/V × Rd × (1 – Tc))
Where:
- E = Market value of equity
- D = Market value of debt
- V = E + D (total market value)
- Re = Cost of equity
- Rd = Cost of debt
- Tc = Corporate tax rate
Practical Example:
Consider a company with the following characteristics:
- Market value of equity: $600 million
- Market value of debt: $400 million
- Cost of equity: 12%
- Cost of debt: 6%
- Corporate tax rate: 21%
Step 1: Calculate total value
V = $600M + $400M = $1,000M
Step 2: Calculate equity weight
E/V = $600M / $1,000M = 0.60 or 60%
Step 3: Calculate debt weight
D/V = $400M / $1,000M = 0.40 or 40%
Step 4: Calculate after-tax cost of debt
Rd × (1 – Tc) = 6% × (1 – 0.21) = 4.74%
Step 5: Calculate WACC
WACC = (0.60 × 12%) + (0.40 × 4.74%)
WACC = 7.20% + 1.90%
WACC = 9.10%
This 9.10% represents the minimum return the company must generate on investments to satisfy both debt holders and equity investors. Any project returning less than 9.10% destroys shareholder value, while projects exceeding this hurdle create wealth.
The Modigliani-Miller Theorem: Theoretical Foundation
In 1958, economists Franco Modigliani and Merton Miller published groundbreaking research proving that in perfect markets (no taxes, bankruptcy costs, or information asymmetry), capital structure doesn’t affect company value. This counterintuitive finding established the theoretical baseline for all capital structure analysis.
Modigliani-Miller Proposition I (without taxes):
VL = VU
Where:
- VL = Value of leveraged firm
- VU = Value of the unleveraged firm
This proposition states that in perfect markets, financing decisions don’t create value; only investment decisions matter. Investors can create “homemade leverage” by borrowing personally, making corporate leverage irrelevant.
Modigliani-Miller Proposition II (with taxes):
VL = VU + (Tc × D)
The introduction of corporate taxes changes everything. The tax deductibility of interest creates a “tax shield” that increases firm value proportionally to debt levels. This modification explains why companies use debt despite its risks—the tax benefit provides real economic value.
However, real markets include bankruptcy costs, agency costs, and information asymmetry. These frictions create the trade-offs that make capital structure decisions strategically important.
Financial Leverage and Return on Equity
Debt amplifies returns on equity through financial leverage. This mathematical relationship explains why moderate debt often benefits shareholders while excessive debt destroys value.
Return on Equity (ROE) Formula with Leverage:
ROE = ROA + (ROA – Rd) × (D/E)
Where:
- ROA = Return on assets
- Rd = After-tax cost of debt
- D/E = Debt-to-equity ratio
Illustrative Example:
Company A (Unleveraged):
- Total assets: $1,000,000
- Total equity: $1,000,000
- Total debt: $0
- Operating income: $150,000
- ROA: 15%
- ROE: 15%
Company B (Leveraged):
- Total assets: $1,000,000
- Total equity: $600,000
- Total debt: $400,000
- Operating income: $150,000
- Interest expense: $24,000 (6% on debt)
- After-tax interest: $18,960 (at 21% tax rate)
- Net income: $103,641
- ROA: 15%
- ROE: 17.3%
Company B’s leverage amplifies ROE from 15% to 17.3% because the 15% return on assets exceeds the 4.74% after-tax cost of debt. The 10.26 percentage point spread (15% – 4.74%) multiplied by the debt-to-equity ratio (0.67) adds 6.87 percentage points to ROE.
This leverage effect works in reverse when ROA falls below the cost of debt. If operating income drops to $40,000 (4% ROA), Company A’s ROE remains 4%, while Company B’s return on equity (ROE) plummets to -0.6%. The mathematics prove that leverage magnifies both gains and losses.
Understanding combined leverage and the degree of operating leverage helps investors assess how business and financial leverage interact to create total risk exposure.
Capital Structure and Bankruptcy Risk
Excessive debt increases bankruptcy probability through two mechanisms:
1. Fixed obligations: Interest and principal payments continue regardless of business performance. During revenue downturns, these fixed costs consume cash flow needed for operations.
2. Refinancing risk: Debt matures on specific dates, requiring companies to either repay or refinance. During credit crunches, even profitable companies can fail if they cannot roll over maturing debt.
The Altman Z-Score quantifies bankruptcy risk using capital structure and profitability metrics:
Z = 1.2(Working Capital/Total Assets) + 1.4(Retained Earnings/Total Assets) + 3.3(EBIT/Total Assets) + 0.6(Market Value of Equity/Book Value of Liabilities) + 1.0(Sales/Total Assets)
Scores below 1.8 indicate high bankruptcy risk, while scores above 3.0 suggest financial safety. The Altman Z-Score incorporates capital structure through the equity-to-liabilities ratio, demonstrating how financing decisions directly impact survival probability.
Industry-Specific Capital Structure Benchmarks
Different industries maintain characteristic debt-to-equity ratios based on their economic fundamentals:
| Industry | Typical D/E Ratio | Typical Debt % | Reasoning |
|---|---|---|---|
| Software & Technology | 0.0 – 0.5 | 0% – 33% | Regulated returns, stable cash flow, capital-intensive |
| Utilities | 1.0 – 2.0 | 50% – 67% | Capital-intensive, cyclical, aircraft collateral |
| Real Estate | 1.5 – 3.0 | 60% – 75% | Tangible collateral, predictable rental income |
| Retail | 0.5 – 1.0 | 33% – 50% | Moderate stability, working capital needs |
| Manufacturing | 0.7 – 1.5 | 41% – 60% | Capital equipment, cyclical demand |
| Pharmaceuticals | 0.3 – 0.8 | 23% – 44% | R&D intensity, regulatory risk, patent cliffs |
| Airlines | 1.0 – 2.5 | 50% – 71% | Capital intensive, cyclical, aircraft collateral |
| Restaurants | 0.8 – 1.5 | 44% – 60% | Real estate, franchise models, brand value |
Companies deviating significantly from industry norms warrant careful investigation. Unusually low leverage might indicate:
- Conservative management philosophy
- Recent equity issuance or strong retained earnings
- Difficulty accessing debt markets due to credit concerns
- Preparation for a major acquisition or capital investment
Unusually high leverage might signal:
- Aggressive growth strategy or leveraged buyout
- Deteriorating business fundamentals are reducing equity value
- Special dividend or share buyback program
- Industry disruption threatens future cash flows
Comparing a company’s capital structure to industry peers provides context for evaluating financial risk and management strategy. The debt ratio offers a quick assessment of leverage intensity relative to total assets.
Dynamic Capital Structure Management
Capital structure isn’t static—companies continuously adjust their financing mix based on:
Market conditions: When equity valuations rise, companies issue stock to fund growth at favorable prices. When interest rates fall, refinancing existing debt reduces financing costs.
Business lifecycle: Growth companies add debt as cash flows stabilize. Mature companies may increase leverage to return excess cash to shareholders through dividends and buybacks.
Strategic initiatives: Acquisitions often require temporary leverage increases, followed by deleveraging as integration generates synergies.
Competitive positioning: Financial flexibility becomes crucial during industry disruption. Companies maintaining conservative capital structures can invest aggressively when competitors face financial constraints.
The target capital structure represents management’s long-term financing goal, while the actual capital structure fluctuates around this target based on market opportunities and business needs. Understanding this dynamic helps investors distinguish between temporary deviations and fundamental strategy shifts.
Effective capital allocation strategies integrate capital structure decisions with investment choices, dividend policies, and share repurchase programs to maximize long-term shareholder value.
💼 Capital Structure Calculator
Calculate WACC, D/E ratio, and analyze your capital structure
📊 Your Capital Structure Analysis
Capital Structure Optimization: Finding the Right Balance
Determining the optimal capital structure requires balancing multiple competing objectives. No single formula produces the perfect answer—instead, companies must evaluate trade-offs based on their specific circumstances and strategic goals.
The Trade-Off Theory in Practice
The trade-off theory suggests companies balance the tax benefits of debt against the costs of potential financial distress. This framework provides a systematic approach to capital structure decisions.
Tax Benefits of Debt:
The present value of tax shields equals:
PV(Tax Shield) = Tc × D
Where Tc represents the corporate tax rate, and D represents the market value of debt. A company with $500 million in debt and a 21% tax rate creates $105 million in tax shield value, real economic benefit transferred from the government to shareholders.
Costs of Financial Distress:
Financial distress costs include:
- Direct bankruptcy costs: Legal fees, administrative expenses, and asset liquidation discounts typically consume 3-5% of firm value
- Indirect costs: Lost customers, departed employees, delayed investments, and supplier relationship deterioration often exceed direct costs
- Agency costs: Conflicts between debt holders and equity holders that destroy value through suboptimal decision-making
The optimal capital structure exists where marginal tax benefits equal marginal distress costs. Before this point, adding debt increases firm value. Beyond this point, additional debt destroys value despite tax advantages.
The Pecking Order Theory Alternative
Stewart Myers’ pecking order theory proposes that companies follow a financing hierarchy based on information asymmetry:
First preference: Internal financing from retained earnings
- No issuance costs
- No information disclosure required
- No dilution or control changes
Second preference: Debt financing
- Lower information asymmetry than equity
- Tax-deductible interest payments
- Preserves ownership control
Third preference: Equity financing
- The highest information asymmetry
- Signals potential overvaluation
- Dilutes existing shareholders
This theory explains why profitable companies often carry less debt; they generate sufficient internal cash flow to fund investments without external financing. Conversely, unprofitable growth companies rely heavily on equity because they lack both earnings and debt capacity.
Research shows that both theories explain real-world behavior. Large, profitable companies with stable cash flows follow the trade-off theory, optimizing debt levels for tax efficiency. Smaller, growth-oriented companies follow the pecking order theory, using equity when internal funds prove insufficient.
Market Timing and Capital Structure
Companies also adjust capital structure based on market conditions—a practice called market timing. When equity valuations rise, companies issue stock to fund growth at favorable prices. When interest rates fall, refinancing existing debt reduces financing costs.
Example: Apple’s Market Timing
Apple began issuing debt in 2013 despite holding over $145 billion in cash. Why? The company’s stock traded at premium valuations while interest rates remained historically low. Apple borrowed at 2-3% interest rates to fund dividends and buybacks while keeping overseas cash untaxed. This market timing strategy created shareholder value by:
- Accessing the lowest-cost capital source available
- Avoiding repatriation taxes on foreign earnings
- Maintaining financial flexibility for future opportunities
The 2017 Tax Cuts and Jobs Act changed this calculus by reducing repatriation taxes, demonstrating how tax policy shifts affect optimal capital structure decisions.
Industry-Specific Optimization Factors
Different industries face unique capital structure considerations:
Technology Companies:
- Minimal tangible assets limit debt capacity
- Rapid innovation creates business risk
- High growth rates make equity financing attractive
- Stock-based compensation dilutes ownership regardless
- Optimal structure: 0-30% debt
Utilities:
- Regulated returns reduce business risk
- Capital-intensive infrastructure requires substantial financing
- Predictable cash flows support high debt service
- Rate structures often guarantee debt coverage
- Optimal structure: 50-65% debt
Pharmaceuticals:
- Binary R&D outcomes create volatility
- Patent cliffs threaten revenue stability
- Intangible assets provide poor collateral
- Acquisition activity requires financial flexibility
- Optimal structure: 20-40% debt
Real Estate:
- Tangible assets provide excellent collateral
- Rental income generates a predictable cash flow
- Leverage amplifies returns on appreciating assets
- Tax structures (REITs) require high dividend payouts
- Optimal structure: 60-75% debt
Understanding these industry patterns helps investors identify companies with appropriate or problematic capital structures relative to their business models.
Adjusting Capital Structure: Practical Methods
Companies modify capital structure through several mechanisms:
Increasing Leverage:
- Issue new debt and use proceeds for dividends or buybacks
- Acquire companies using debt financing
- Reduce equity through share repurchases
- Retain less earnings and pay higher dividends
Decreasing Leverage:
- Issue new equity through secondary offerings
- Retain earnings rather than paying dividends
- Sell assets and use proceeds to repay debt
- Convert convertible debt to equity
Each method creates different tax consequences and shareholder impacts. Share buybacks funded by debt simultaneously increase leverage and return cash to shareholders. Equity issuance dilutes existing owners but strengthens the balance sheet.
The deleveraging process becomes critical when companies carry excessive debt relative to their ability to service obligations. Understanding how companies reduce leverage helps investors assess recovery prospects during financial distress.
Monitoring Capital Structure Health
Investors should track several metrics to assess capital structure appropriateness:
Interest Coverage Ratio:
Interest Coverage = EBIT / Interest Expense
This metric measures how many times operating income covers interest obligations. Ratios below 2.0 indicate potential debt service problems, while ratios above 5.0 suggest comfortable coverage.
Debt-to-EBITDA Ratio:
Debt-to-EBITDA = Total Debt / EBITDA
This metric shows how many years of operating cash flow would be required to repay all debt. Ratios below 3.0 generally indicate manageable leverage, while ratios above 5.0 suggest elevated risk.
Fixed Charge Coverage:
Fixed Charge Coverage = (EBIT + Lease Payments) / (Interest + Lease Payments + Preferred Dividends)
This comprehensive metric includes all fixed obligations, not just interest. It provides a more complete picture of the company’s ability to meet financial commitments.
Companies maintaining healthy coverage ratios can weather economic downturns without defaulting on obligations. Those with weak coverage face refinancing risk and potential bankruptcy during revenue declines.
The cash conversion cycle also affects capital structure decisions by determining how much working capital the business requires to operate efficiently.
Capital Structure and Investment Decisions: What Investors Need to Know
For investors, understanding capital structure provides critical insights into risk, return potential, and company valuation. The math behind money reveals that financing decisions directly impact investment outcomes.
How Capital Structure Affects Stock Returns
Capital structure influences equity returns through three primary channels:
1. Financial Leverage Effect
Leverage amplifies returns on equity, as demonstrated earlier. When a company generates returns on assets exceeding its cost of debt, leverage magnifies equity returns. The relationship follows:
ROE = ROA + (ROA – Cost of Debt) × (Debt/Equity)
This mathematical relationship means equity investors in leveraged companies experience higher volatility—both upside and downside—than investors in unleveraged companies with identical operations.
2. Bankruptcy Risk Premium
Investors demand higher returns from highly leveraged companies to compensate for increased bankruptcy risk. This risk premium manifests through lower stock valuations (higher earnings multiples required) and higher expected returns.
A company with 80% debt trades at lower valuation multiples than an identical company with 20% debt because investors discount future cash flows at higher rates to reflect financial risk.
3. Tax Shield Value
The tax deductibility of interest creates value that flows to equity holders. All else equal, moderately leveraged companies should trade at premiums to unleveraged peers because debt financing reduces the company’s total tax burden.
Evaluating Capital Structure as an Investor
When analyzing potential investments, assess capital structure through this framework:
Step 1: Compare to Industry Peers
Calculate the company’s debt-to-equity ratio and debt-to-total-capital percentage. Compare these metrics to industry averages and direct competitors. Significant deviations warrant investigation.
Step 2: Assess Coverage Ratios
Examine interest coverage, fixed charge coverage, and debt-to-EBITDA ratios. Strong coverage (interest coverage > 5.0, debt-to-EBITDA < 3.0) indicates financial stability. Weak coverage signals potential distress.
Step 3: Analyze Debt Maturity Profile
Review when debt obligations mature. Companies with substantial debt maturing during the next 1-2 years face refinancing risk if credit markets tighten. Well-laddered maturity schedules reduce this risk.
Step 4: Evaluate Management’s Capital Allocation Track Record
Has management demonstrated discipline in capital structure decisions? Companies that maintain consistent leverage targets through business cycles typically create more shareholder value than those that swing between extremes.
Step 5: Consider Business Model Stability
Does the company’s cash flow profile support its capital structure? Cyclical businesses should maintain conservative leverage, while stable businesses can safely carry more debt.
The balance sheet basics provide the foundation for understanding how capital structure appears in financial statements and affects company valuation.
Capital Structure Changes as Investment Signals
Significant capital structure shifts often signal important information:
Leverage Increases:
When companies increase debt to fund buybacks or dividends, management signals confidence in future cash flows. However, excessive leverage increases may indicate:
- Desperation to boost short-term stock prices
- Activist investor pressure
- Preparation for going private
- Management overconfidence
Leverage Decreases:
When companies reduce debt through equity issuance or earnings retention, management may be:
- Preparing for major acquisitions
- Responding to deteriorating business conditions
- Strengthening the balance sheet before economic uncertainty
- Signaling that current equity valuations are attractive
Debt Refinancing:
Companies that frequently refinance debt at lower rates demonstrate:
- Strong credit quality
- Proactive financial management
- Ability to access capital markets
- Focus on minimizing financing costs
Each signal requires context. A utility company increasing leverage from 50% to 55% debt differs fundamentally from a technology company moving from 10% to 40% debt.
Capital Structure and Dividend Sustainability
Capital structure directly affects dividend safety. Companies with conservative leverage can maintain dividends during downturns, while overleveraged companies often cut dividends to preserve cash for debt service.
Dividend Coverage Analysis:
Sustainable dividends require:
- Earnings sufficient to cover both dividends and debt service
- Cash flow is adequate for capital expenditures and working capital
- Leverage levels that preserve borrowing capacity
- Debt maturity profiles that avoid near-term refinancing cliffs
The dividend investing guide explores how capital structure affects dividend reliability and growth potential, critical factors for income-focused investors.
Using Capital Structure in Valuation
Capital structure affects company valuation through the discount rate. The WACC calculated earlier represents the rate at which investors should discount future cash flows.
Enterprise Value Calculation:
Enterprise Value = Market Cap + Total Debt – Cash
This metric represents the total value of the business independent of capital structure. Two companies with identical operations but different leverage will have different market capitalizations but similar enterprise values (adjusted for tax shield differences).
Adjusting for Capital Structure in Comparisons:
When comparing companies with different leverage levels:
- Use enterprise value multiples (EV/EBITDA, EV/Sales) rather than equity multiples (P/E)
- Adjust beta for leverage differences when calculating required returns
- Consider tax shield value in sum-of-parts valuations
- Evaluate unlevered free cash flow rather than net income
The enterprise value explained guide provides a detailed methodology for incorporating capital structure into valuation analysis.
Risk Management Through Capital Structure Analysis
Conservative investors can reduce portfolio risk by favoring companies with appropriate capital structures:
Low-Risk Portfolio Strategy:
- Target companies with debt-to-equity ratios below industry averages
- Require interest coverage ratios above 5.0
- Favor businesses with stable cash flows supporting current leverage
- Avoid companies with significant debt maturities in the next 2 years
Moderate-Risk Portfolio Strategy:
- Accept industry-average leverage levels
- Require interest coverage ratios above 3.0
- Evaluate debt maturity profiles for refinancing risk
- Monitor coverage trends for deterioration
Higher-Risk Portfolio Strategy:
- Consider above-average leverage for companies with improving fundamentals
- Accept interest coverage ratios above 2.0 if trending upward
- Evaluate potential for deleveraging through earnings growth
- Assess restructuring opportunities in overleveraged situations
Understanding capital structure helps investors match portfolio risk levels with personal risk tolerance and investment objectives. The risk management principles extend beyond individual securities to overall portfolio construction.
Common Capital Structure Mistakes and How to Avoid Them
Both companies and investors make predictable errors when analyzing or implementing capital structure decisions. Recognizing these mistakes prevents costly outcomes.
Corporate Mistakes
Mistake #1: Overleveraging During Good Times
Companies frequently increase debt during economic expansions, assuming favorable conditions will continue indefinitely. When recessions arrive, excessive leverage forces distressed asset sales, dividend cuts, or bankruptcy.
The 2008 Financial Crisis Example:
Lehman Brothers maintained a leverage ratio exceeding 30:1 (debt-to-equity of 30.0) before its collapse. A mere 3.3% decline in asset values wiped out all equity. More conservative competitors like JPMorgan Chase (leverage ratio around 12:1) survived and thrived.
How to avoid: Maintain conservative leverage during peaks, preserving borrowing capacity for downturns when acquisition opportunities emerge and competitors face distress.
Mistake #2: Ignoring Debt Maturity Profiles
Companies sometimes concentrate debt maturities in short periods, creating refinancing risk. If credit markets freeze when debt matures, even profitable companies can default.
How to avoid: Ladder debt maturities across multiple years, ensuring no single year contains excessive refinancing requirements. Target maximum 20-25% of total debt maturing in any 12 months.
Mistake #3: Mismatching Asset and Liability Duration
Financing long-term assets (factories, equipment) with short-term debt creates rollover risk. Conversely, locking in long-term debt for short-lived assets wastes financial flexibility.
How to avoid: Match financing duration to asset life. Fund capital equipment with 5-10 year debt. Finance working capital with revolving credit facilities. This alignment reduces refinancing risk and optimizes interest costs.
Mistake #4: Chasing Tax Benefits Beyond Optimal Leverage
The tax deductibility of interest tempts companies to add excessive debt. However, the marginal tax benefit diminishes as leverage increases while bankruptcy costs accelerate.
How to avoid: Calculate the optimal capital structure where marginal tax benefits equal marginal distress costs. Use coverage ratios (interest coverage > 3.0, debt-to-EBITDA < 4.0) as guardrails against excessive leverage.
Mistake #5: Ignoring Industry Dynamics
Capital structures appropriate for stable industries prove disastrous in cyclical or disrupted sectors. Technology disruption, regulatory changes, or cyclical downturns can quickly render previously safe leverage levels dangerous.
How to avoid: Adjust target leverage based on business model stability and industry disruption risk. Maintain extra conservatism in rapidly changing industries.
Investor Mistakes
Mistake #1: Ignoring Capital Structure in Stock Selection
Many investors focus exclusively on earnings growth and valuation multiples while overlooking capital structure. This oversight creates blind spots to financial risk that can destroy returns during downturns.
How to avoid: Make the debt-to-equity ratio and interest coverage standard components of investment screening. Reject companies with leverage exceeding industry norms by more than 50% unless a compelling strategic rationale exists.
Mistake #2: Treating All Debt as Equal
Not all debt carries equal risk. Secured debt backed by tangible assets differs fundamentally from unsecured debt. Short-term debt creates different risks than long-term debt.
How to avoid: Analyze debt composition, not just total amounts. Examine:
- Secured vs. unsecured proportions
- Maturity schedules
- Fixed vs. variable interest rates
- Covenant restrictions
- Subordination levels
Mistake #3: Overlooking Off-Balance-Sheet Liabilities
Operating leases, pension obligations, and contingent liabilities create economic leverage not reflected in traditional debt ratios. These hidden obligations can trigger financial distress.
How to avoid: Calculate adjusted debt-to-equity ratios including:
- Capitalized operating leases (multiply annual lease payments by 6-8)
- Unfunded pension obligations
- Contingent liabilities disclosed in footnotes
Mistake #4: Misinterpreting Leverage in Financial Companies
Banks and financial institutions operate with capital structures that would bankrupt operating companies. Comparing bank leverage ratios to industrial company ratios produces meaningless conclusions.
How to avoid: Use industry-specific metrics for financial companies:
- Tier 1 capital ratios for banks
- Debt-to-capital ratios for insurance companies
- Regulatory capital requirements for financial institutions
Compare financial companies only to industry peers, never to operating companies.
Mistake #5: Assuming Optimal Capital Structure Remains Static
Business conditions change. Interest rates fluctuate. Tax policies shift. The optimal capital structure evolves with these changing circumstances.
How to avoid: Monitor capital structure trends over time. Companies should periodically reassess target leverage based on:
- Current interest rate environment
- Tax policy changes
- Business model evolution
- Competitive dynamics
- Market valuation levels
The assets vs liabilities framework helps investors understand how capital structure components interact on the balance sheet to create financial stability or risk.
Conclusion: Mastering Capital Structure for Better Investment Decisions
Capital structure represents one of the most fundamental yet frequently overlooked aspects of corporate finance and investment analysis. The mathematical framework connecting debt, equity, taxes, and risk determines whether companies thrive during economic challenges or collapse under financial pressure.
The evidence proves clear: companies that maintain capital structures aligned with their business models and industry economics create superior shareholder returns over time. Apple’s strategic use of low-cost debt while maintaining fortress balance sheet strength contrasts sharply with Lehman Brothers’ catastrophic overleveraging—identical financing tools producing opposite outcomes based on application wisdom.
Key Principles to Remember
Principle 1: Context Determines Appropriateness
No universal capital structure suits all companies. Technology firms require financial flexibility to pivot rapidly, supporting equity-heavy structures. Utilities generate predictable cash flows that safely service substantial debt. Real estate businesses leverage tangible assets to amplify returns. Always evaluate capital structure relative to industry norms and business model characteristics.
Principle 2: Balance Tax Benefits Against Bankruptcy Costs
Debt creates value through tax shields—interest deductibility reduces corporate tax burdens by 21% of interest expense at current rates. However, excessive debt increases bankruptcy probability and associated costs. The optimal capital structure exists where marginal tax benefits equal marginal distress costs, typically producing debt ratios of 30-50% for most operating companies.
Principle 3: Coverage Ratios Reveal Financial Health
Debt-to-equity ratios provide useful snapshots, but coverage ratios predict sustainability. Interest coverage above 5.0 indicates comfortable debt service capacity. Ratios between 3.0-5.0 suggest adequate but not exceptional coverage. Ratios below 3.0 signal potential distress requiring immediate attention. Debt-to-EBITDA ratios below 3.0 generally indicate manageable leverage across industries.
Principle 4: Maturity Profiles Matter as Much as Amounts
Companies can safely carry substantial debt if maturities are well-laddered across multiple years. Concentrated maturities create refinancing risk—even profitable companies default when credit markets freeze and maturing debt cannot be rolled over. Examine debt maturity schedules as carefully as total debt levels.
Principle 5: Capital Structure Evolves with Business Lifecycle
Startups begin with 100% equity because they lack cash flow and assets for debt. Growth companies gradually add debt as revenue stabilizes. Mature companies optimize leverage for tax efficiency. Declining companies deleverage to preserve flexibility. Appropriate capital structure changes as businesses evolve through these stages.
Actionable Next Steps for Investors
Step 1: Incorporate Capital Structure into Investment Screening
Add debt-to-equity ratio, interest coverage, and debt-to-EBITDA to standard screening criteria. Eliminate companies with leverage exceeding industry norms by more than 50% unless a compelling strategic rationale exists. This single filter prevents many catastrophic investment losses.
Step 2: Calculate WACC for Portfolio Holdings
Understanding each holding’s weighted average cost of capital reveals the return threshold for value creation. Companies consistently generating returns below their WACC destroy shareholder value regardless of accounting profits. This analysis identifies holdings requiring deeper investigation or potential sale.
Step 3: Monitor Capital Structure Trends
Track whether companies maintain consistent leverage targets or swing between extremes. Disciplined capital structure management signals competent financial leadership. Erratic leverage patterns often precede operational problems or strategic confusion.
Step 4: Assess Debt Maturity Calendars
Review 10-K filings to examine debt maturity schedules. Companies with more than 25% of total debt maturing within 12 months face refinancing risk. This analysis becomes especially critical during rising interest rate environments or credit market stress.
Step 5: Compare Capital Structures Across Competitors
Analyze how direct competitors finance their operations. Significant deviations from peer norms warrant investigation. Companies maintaining conservative structures during industry overleveraging often emerge as acquisition consolidators when credit cycles turn.
The Math Behind Money: Capital Structure Edition
Capital structure embodies the mathematical principles underlying wealth building and investing fundamentals. The formulas connecting debt, equity, taxes, and returns aren’t abstract theory—they determine real-world outcomes for companies and investors.
Warren Buffett’s Berkshire Hathaway maintains minimal debt despite massive scale, preserving financial flexibility to deploy capital during market dislocations. This conservative approach enabled Berkshire to invest $26 billion during the 2008 financial crisis while overleveraged competitors fought for survival. The mathematics of capital structure explain why this strategy works: financial flexibility has option value that compounds over decades.
Conversely, private equity firms deliberately overleverage acquisition targets, using debt to amplify returns on successful investments. This strategy works when applied to stable, cash-generating businesses but fails catastrophically when applied to cyclical or disrupted industries. The same mathematical leverage that magnifies gains during expansions accelerates bankruptcy during contractions.
Understanding capital structure provides the analytical foundation for distinguishing between these scenarios. The data-driven insights reveal which companies maintain sustainable competitive advantages and which teeter on the edge of financial distress despite impressive revenue growth.
Final Thoughts
Capital structure analysis separates sophisticated investors from those who rely on tips and trends. The math behind money proves that how companies finance operations often matters more than what they produce. Technology disruption can destroy business models overnight, but financial leverage determines whether companies survive long enough to adapt.
Master these principles. Calculate WACC for potential investments. Examine debt maturity profiles. Compare leverage ratios to industry benchmarks. These analytical habits compound into superior long-term returns through better stock selection and risk management.
The evidence-based approach to capital structure transforms investing from speculation into a calculated probability assessment. Companies maintaining appropriate leverage for their business models create wealth through economic cycles. Those that overleverage eventually face reckoning when conditions change.
Your investment success depends on recognizing these patterns before they become obvious to the broader market. Start analyzing capital structure today—the mathematical advantage compounds with every decision informed by this framework.
References
[1] Modigliani, F., & Miller, M. H. (1958). “The Cost of Capital, Corporation Finance and the Theory of Investment.” American Economic Review, 48(3), 261-297.
[2] Myers, S. C. (1984). “The Capital Structure Puzzle.” Journal of Finance, 39(3), 575-592.
[3] Federal Reserve Economic Data (FRED). (2025). “Corporate Interest Rates and Debt Statistics.” Federal Reserve Bank of St. Louis. https://fred.stlouisfed.org
[4] U.S. Securities and Exchange Commission. (2025). “Corporate Financial Statements and Annual Reports.” https://www.sec.gov
[5] Altman, E. I. (1968). “Financial Ratios, Discriminant Analysis and the Prediction of Corporate Bankruptcy.” Journal of Finance, 23(4), 589-609.
[6] Damodaran, A. (2025). “Capital Structure and Valuation.” Stern School of Business, New York University. https://pages.stern.nyu.edu/~adamodar/
[7] Graham, J. R., & Harvey, C. R. (2001). “The Theory and Practice of Corporate Finance: Evidence from the Field.” Journal of Financial Economics, 60(2-3), 187-243.
[8] CFA Institute. (2025). “Corporate Finance and Portfolio Management.” CFA Program Curriculum.
Author Bio
Max Fonji is a data-driven financial educator and the founder of The Rich Guy Math, where he breaks down complex financial concepts into clear, actionable insights. With a background in financial analysis and a passion for teaching the math behind money, Max helps investors understand the quantitative principles that drive wealth building and risk management. His evidence-based approach combines academic research with practical application, empowering readers to make informed financial decisions grounded in data rather than speculation.
Educational Disclaimer
This article is provided for educational and informational purposes only and does not constitute financial, investment, tax, or legal advice. The content presents general information about capital structure concepts and should not be relied upon as the sole basis for making investment decisions.
Capital structure analysis involves complex financial concepts and company-specific factors that require professional evaluation. Different investors have different financial situations, risk tolerances, and investment objectives that affect appropriate investment strategies.
Past performance of companies or capital structure strategies does not guarantee future results. All investments carry risk, including the potential loss of principal. Debt levels that prove appropriate for one company may be unsuitable for another based on business model, industry dynamics, and economic conditions.
Before making investment decisions based on capital structure analysis or any other factor, consult with qualified financial, tax, and legal professionals who can evaluate your specific circumstances and objectives. The author and The Rich Guy Math assume no liability for financial decisions made based on information presented in this article.
Company examples and data cited are for illustrative purposes only and do not constitute recommendations to buy, sell, or hold any security. Financial metrics and ratios can change rapidly based on market conditions and company performance.
Frequently Asked Questions About Capital Structure
What is capital structure in simple terms?
Capital structure is the mix of debt (borrowed money) and equity (ownership money) a company uses to finance its operations and growth. Think of it as the recipe for how a business funds itself—some companies use mostly equity (like tech startups), while others use substantial debt (like utilities and real estate). The specific combination affects the company’s risk level, cost of financing, and potential returns for investors.
What is the optimal capital structure?
The optimal capital structure minimizes a company’s weighted average cost of capital (WACC) while balancing tax benefits from debt against bankruptcy risk. This optimal point varies by industry and company. Stable businesses with predictable cash flows (utilities, consumer staples) can safely carry 50–60% debt, while volatile businesses (technology, biotechnology) should maintain 0–30% debt. The optimal structure exists where the marginal tax benefit from additional debt equals the marginal cost of increased financial distress risk.
How does capital structure affect company value?
Capital structure affects company value through three mechanisms: (1) Tax shields—interest payments are tax-deductible, reducing the company’s tax burden and increasing cash flow to investors; (2) Bankruptcy costs—excessive debt increases the probability and costs of financial distress, destroying value; (3) Agency costs—conflicts between debt holders and equity holders can lead to suboptimal decisions that reduce firm value. Although the Modigliani-Miller theorem suggests capital structure is irrelevant in perfect markets, real-world frictions make financing decisions strategically important.
What is the difference between capital structure and financial structure?
Capital structure refers specifically to the mix of long-term debt and equity used to finance a company’s operations. Financial structure is broader, covering all sources of financing including short-term debt, long-term debt, equity, and other liabilities. Capital structure focuses on permanent financing, while financial structure also includes working capital liabilities such as accounts payable. For strategic analysis, capital structure is more relevant because it reflects long-term financing decisions.
How do you calculate capital structure?
To calculate capital structure:
- Identify total debt (long-term debt + current portion of long-term debt)
- Identify total equity (common stock + preferred stock + retained earnings)
- Total capital = Total Debt + Total Equity
- Debt percentage = (Total Debt / Total Capital) × 100
- Equity percentage = (Total Equity / Total Capital) × 100
- Debt-to-equity ratio = Total Debt / Total Equity
Use market values instead of book values for more accurate analysis, as market values reflect current investor expectations.
What is a good debt-to-equity ratio?
A “good” debt-to-equity ratio depends on industry context. Technology companies should generally stay below 0.5 (33% debt), while utilities and real estate firms often operate with ratios of 1.0–2.0 (50–67% debt). As broad guidelines:
- Below 0.5: conservative financing
- 0.5–1.0: moderate leverage
- 1.0–2.0: aggressive leverage (only suitable for stable industries)
- Above 2.0: potential financial distress unless industry norms justify it
Always compare ratios to industry peers.
Can a company have too little debt?
Yes. Companies can be under-leveraged. Excessively low debt can raise a company’s cost of capital because equity is more expensive than debt. It also means missing out on tax benefits because interest is tax-deductible. However, the cost of too little debt is usually smaller than the cost of excessive debt. Conservative capital structures give companies flexibility—especially beneficial for rapidly changing industries or companies pursuing innovation-driven growth.
How does capital structure affect stock price?
Capital structure affects stock price through multiple channels:
- Leverage amplification: debt magnifies gains and losses, increasing stock volatility.
- Bankruptcy risk: high debt increases default risk, lowering valuations.
- Tax efficiency: optimal debt reduces taxes, increasing cash flows to shareholders.
- Financial flexibility: conservative leverage allows companies to invest during downturns and pursue acquisitions.
Changes in leverage also send signals: increasing debt can signal confidence, while deleveraging may signal caution.
Related posts:
 What Is SmartPass? Raptor Digital Hall Pass Explained for K-12 Schools
 What Is the 3x Rent Rule & How to Calculate It (With Examples)
 Portfolio Income: Definition, Examples, Tax Rules, and Strategies
 Bookkeeping vs Accounting: What’s the Difference & Which Do You Need?
 What Is Profitability Analysis & How to Do It: Metrics, Example & Tips
 Emergency Fund vs Savings: What’s the Real Difference and Why It Matters