Picture this: You’re scrolling through investment opportunities, ready to put your hard-earned money to work. But here’s the thing—would you buy a car without looking under the hood? Of course not! The same logic applies to investing. Financial statements are the “hood” of any company, revealing what’s really happening beneath the surface. Yet, millions of investors skip this crucial step, relying instead on hot tips, market hype, or gut feelings. The truth is, learning to read a financial statement is like gaining X-ray vision into a company’s health, profitability, and future potential. Whether you’re building wealth through dividend investing or trying to understand why the stock market goes up, mastering these documents is your secret weapon.
Key Takeaway
- A financial statement is a formal record of a company’s financial activities, consisting of three main documents: the income statement, balance sheet, and cash flow statement.
- The income statement shows profitability by detailing revenues, expenses, and net income over a specific period—helping investors understand if a company is making or losing money.
- The balance sheet provides a snapshot of what a company owns (assets) versus what it owes (liabilities) at a specific point in time, revealing the company’s net worth.
- The cash flow statement tracks actual money movement, showing how cash enters and leaves the business through operations, investing, and financing activities.
- Together, these three statements give investors a complete picture of financial health, operational efficiency, and long-term sustainability—essential for making informed investment decisions.
What Is a Financial Statement?
In simple terms, a financial statement is a formal document that shows a company’s financial position, performance, and cash movements over a specific time period. Think of it as a company’s report card—except instead of grades in math and science, you’re looking at revenues, assets, debts, and cash flows.
Every publicly traded company in the United States is required by the Securities and Exchange Commission (SEC) to publish these statements quarterly (every three months) and annually. This transparency allows investors, creditors, and analysts to evaluate whether a company is worth their money and trust.
Financial statements matter because they:
Reveal whether a company is profitable or bleeding money
Show if the business can pay its bills and debts
Help investors compare companies within the same industry
Provide insight into management’s effectiveness
Serve as the foundation for valuation and investment analysis
According to the CFA Institute, financial statement analysis is one of the core competencies every serious investor must develop. Without this skill, you’re essentially gambling rather than investing.
The Three Core Financial Statements Every Investor Must Understand
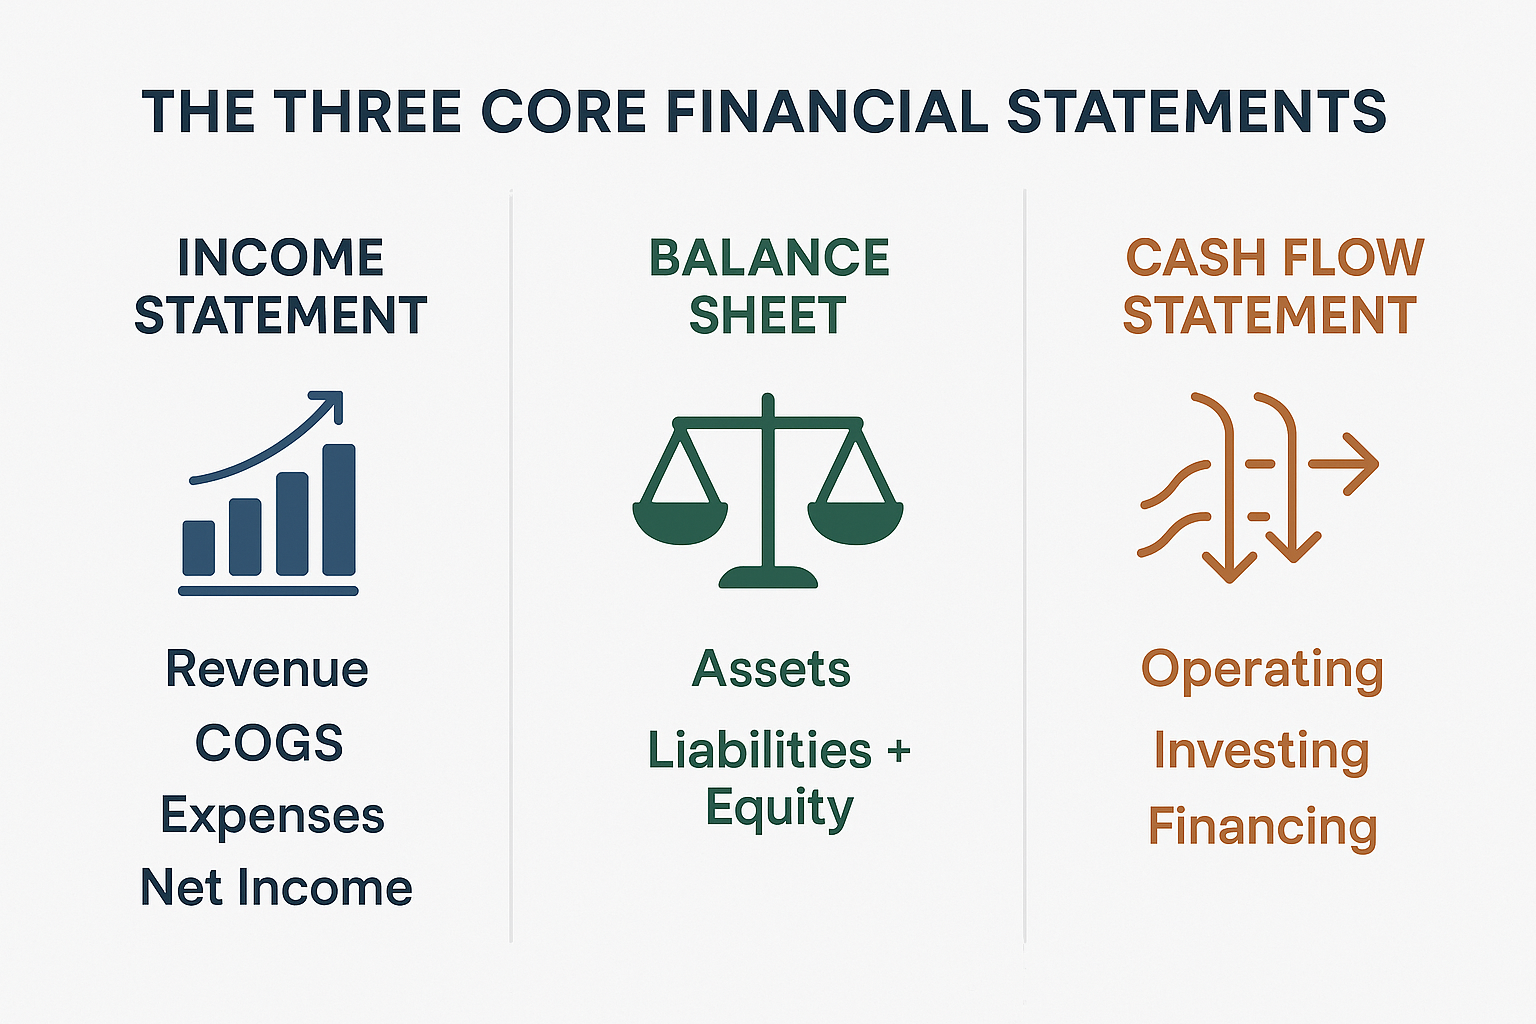
A complete financial statement package consists of three interconnected documents. Each one tells a different part of the company’s story, and together they create a comprehensive picture. See our full guide on Financial Statement Relationship
1. The Income Statement (Profit & Loss Statement)
The income statement shows how much money a company made or lost during a specific period—typically a quarter or a year. It’s all about performance over time.
Key components include:
| Line Item | What It Means |
|---|---|
| Revenue (Sales) | Total money earned from selling products or services |
| Cost of Goods Sold (COGS) | Direct costs to produce what was sold |
| Gross Profit | Revenue minus COGS |
| Operating Expenses | Costs to run the business (salaries, rent, marketing) |
| Operating Income | Gross profit minus operating expenses |
| Interest & Taxes | Money paid to lenders and the government |
| Net Income | The bottom line—what’s left after all expenses |
Example: Let’s say TechCorp reports:
- Revenue: $10 million
- COGS: $4 million
- Operating expenses: $3 million
- Interest and taxes: $1 million
- Net Income: $2 million
This tells investors that TechCorp generated $10 million in sales and kept $2 million as profit—a 20% profit margin.
Why it matters: The income statement reveals profitability trends. Is revenue growing? Are expenses under control? Investors use this to assess whether a company can generate sustainable profits—critical for passive income strategies like dividend investing.
2. The Balance Sheet (Statement of Financial Position)
The balance sheet provides a snapshot of what a company owns and owes at a specific point in time—like taking a financial photograph on December 31st.
The fundamental equation is:
Assets = Liabilities + Shareholders’ Equity
Key components:
Assets (What the company owns):
- Current Assets: Cash, inventory, accounts receivable (money owed by customers)
- Non-Current Assets: Property, equipment, patents, long-term investments
Liabilities (What the company owes):
- Current Liabilities: Bills due within one year (payroll, short-term debt)
- Long-Term Liabilities: Bonds, mortgages, pension obligations
Shareholders’ Equity (Net worth):
- What’s left after subtracting liabilities from assets
- Includes retained earnings and stock value
Example: Imagine RetailCo’s balance sheet shows:
- Total Assets: $50 million
- Total Liabilities: $30 million
- Shareholders’ Equity: $20 million
This means if RetailCo sold everything and paid all debts, shareholders would theoretically receive $20 million.
Why it matters: The balance sheet reveals financial stability. A company drowning in debt might struggle during economic downturns—something crucial to understand when navigating the cycle of market emotions.
3. The Cash Flow Statement
The cash flow statement tracks actual money moving in and out of the business, broken into three categories:
Operating Activities:
- Cash generated from core business operations
- The most important section shows whether the business generates cash naturally
Investing Activities:
- Money spent on or received from investments
- Includes buying equipment, acquiring other companies, or selling assets
Financing Activities:
- Cash from borrowing, repaying debt, issuing stock, or paying dividends
- Shows how the company funds its operations and rewards shareholders
Why it matters: A company can show profit on the income statement but still run out of cash. The cash flow statement reveals the truth about liquidity. As Morningstar analysts often emphasize, “Cash is king”—companies need actual money to survive and thrive.
Example: If a company reports $5 million in net income but only $1 million in operating cash flow, it might be booking sales that haven’t been collected yet—a red flag for investors.
How to Read a Financial Statement: A Step-by-Step Guide
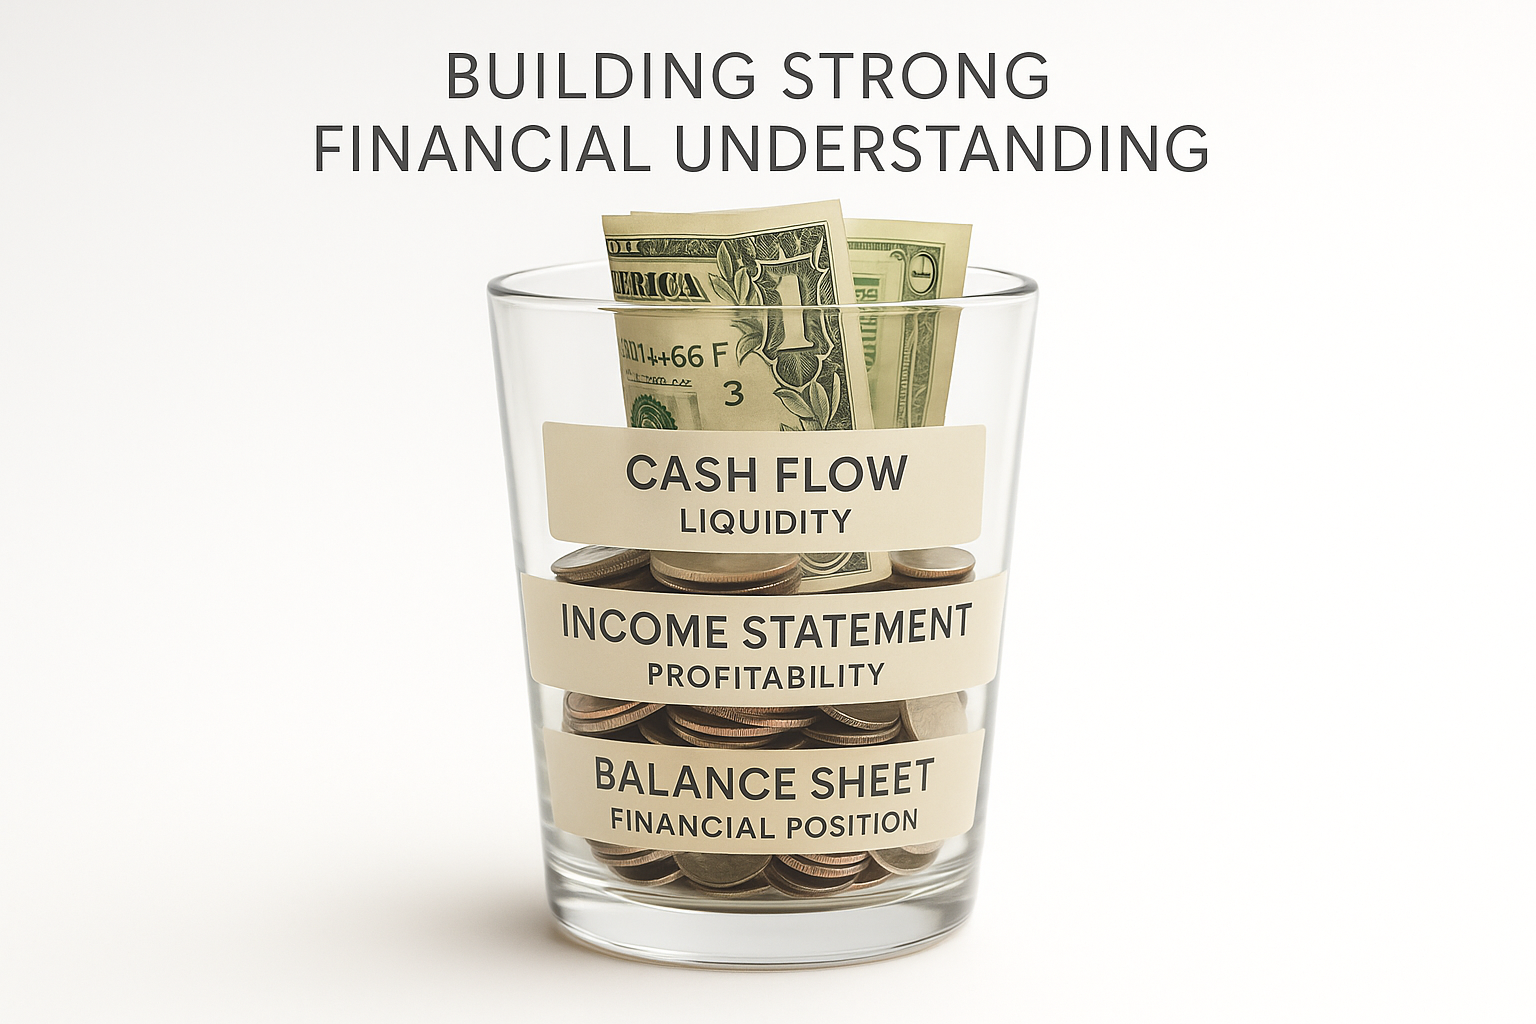
Reading a financial statement might seem intimidating at first, but breaking it down into manageable steps makes it accessible even for beginners.
Step 1: Start with the Income Statement
Look for these key metrics:
- Revenue Growth: Is the top line increasing year-over-year?
- Profit Margins: Calculate gross margin (Gross Profit ÷ Revenue) and net margin (Net Income ÷ Revenue)
- Consistency: Are earnings stable or wildly volatile?
Red flags to watch for:
- Declining revenues over multiple quarters
- Shrinking profit margins (expenses growing faster than sales)
- One-time gains masking operational losses
Step 2: Analyze the Balance Sheet
Key ratios to calculate:
Current Ratio = Current Assets ÷ Current Liabilities
- A ratio above 1.5 suggests good short-term financial health
- Below 1.0 means the company might struggle to pay bills
Debt-to-Equity Ratio = Total Liabilities ÷ Shareholders’ Equity
- Higher ratios indicate more debt relative to ownership
- Compared to industry averages, some sectors naturally carry more debt
Questions to ask:
- Does the company have enough cash to weather a downturn?
- Is debt growing faster than assets?
- Are inventory levels rising (possibly indicating slow sales)?
Step 3: Examine the Cash Flow Statement
Focus on these areas:
Positive operating cash flow is essential—it means the core business generates cash
Compare net income to operating cash flow—they should move in the same direction
Check free cash flow (Operating Cash Flow – Capital Expenditures)—money available for dividends, buybacks, or growth
Warning signs:
- Negative operating cash flow for multiple periods
- Heavy reliance on financing activities to stay afloat
- Large gap between reported profits and actual cash generation
Step 4: Look for Trends Over Time
Don’t just examine one quarter or year—pull statements from the past 3-5 years and look for patterns:
- Is revenue consistently growing?
- Are profit margins improving or deteriorating?
- Is the company reducing debt or taking on more?
- Is cash flow becoming stronger or weaker?
According to SEC guidelines, comparing year-over-year performance helps investors identify sustainable trends versus temporary fluctuations.
Real-World Example: Analyzing a Tech Company’s Financial Statements
Let’s walk through a simplified example using a fictional company, “CloudTech Inc.”
Income Statement Analysis (2024 vs. 2025)
| Metric | 2024 | 2025 | Change |
|---|---|---|---|
| Revenue | $100M | $125M | +25% |
| COGS | $40M | $50M | +25% |
| Gross Profit | $60M | $75M | +25% |
| Operating Expenses | $35M | $42M | +20% |
| Net Income | $15M | $20M | +33% |
Interpretation: CloudTech is growing revenue by 25% while controlling expenses effectively (only 20% increase). Net income jumped 33%—a strong sign of operational leverage.
Balance Sheet Snapshot (End of 2025)
| Category | Amount |
|---|---|
| Cash | $30M |
| Total Current Assets | $60M |
| Total Assets | $150M |
| Current Liabilities | $25M |
| Total Liabilities | $50M |
| Shareholders’ Equity | $100M |
Key Ratios:
- Current Ratio: 60M ÷ 25M = 2.4 (Excellent liquidity)
- Debt-to-Equity: 50M ÷ 100M = 0.5 (Conservative debt levels)
Cash Flow Statement (2025)
| Category | Amount |
|---|---|
| Operating Cash Flow | $22M |
| Investing Cash Flow | -$8M (Bought equipment) |
| Financing Cash Flow | -$5M (Paid dividends) |
| Net Change in Cash | +$9M |
Interpretation: CloudTech generates strong operating cash flow ($22M), which exceeds net income ($20M)—indicating high-quality earnings. The company invested in growth while still returning money to shareholders through dividends.
Investment conclusion: CloudTech shows strong fundamentals—growing revenue, healthy margins, solid balance sheet, and positive cash generation. This is the type of company worth researching further for dividend investing opportunities.
Common Financial Statement Metrics and What They Mean
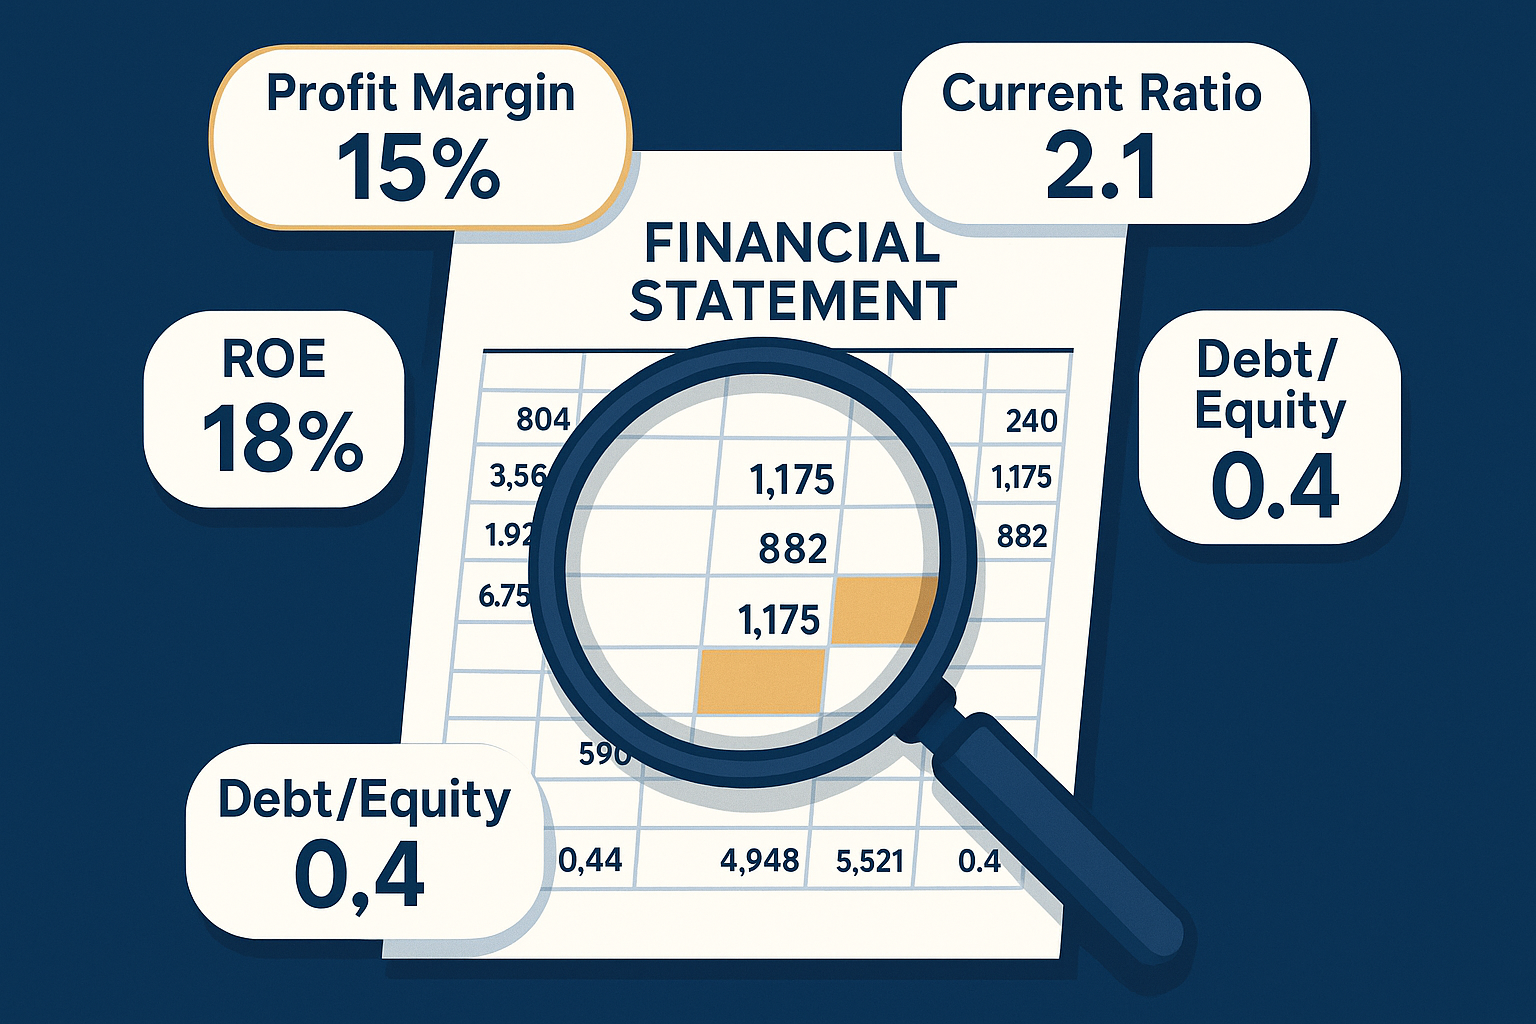
Understanding key financial metrics helps investors quickly assess company health without getting lost in the details.
Profitability Metrics
Gross Profit Margin = (Revenue – COGS) ÷ Revenue × 100
- Shows how efficiently a company produces goods
- Higher margins indicate pricing power or cost control
Operating Margin = Operating Income ÷ Revenue × 100
- Measures profitability from core operations
- Excludes interest and taxes
Net Profit Margin = Net Income ÷ Revenue × 100
- The ultimate measure of profitability
- What percentage of each sales dollar becomes profit?
Liquidity Metrics
Working Capital = Current Assets – Current Liabilities
- Measures short-term financial health
- Positive working capital means the company can cover immediate obligations
Quick Ratio = (Current Assets – Inventory) ÷ Current Liabilities
- More conservative than the current ratio
- Excludes inventory (which might not sell quickly)
Leverage Metrics
Interest Coverage Ratio = Operating Income ÷ Interest Expense
- Shows how easily a company can pay interest on debt
- A ratio below 2.0 suggests potential trouble
Equity Multiplier = Total Assets ÷ Shareholders’ Equity
- Indicates how much assets are financed by debt versus equity
- Higher numbers mean more leverage (riskier)
Efficiency Metrics
Return on Assets (ROA) = Net Income ÷ Total Assets
- Measures how effectively assets generate profit
- Higher is better—shows management efficiency
Return on Equity (ROE) = Net Income ÷ Shareholders’ Equity
- Shows the return generated for shareholders
- Warren Buffett considers 15%+ ROE excellent
These metrics help investors compare companies within the same industry and identify the strongest performers—essential knowledge for building a winning stock market strategy.
Advantages and Limitations of Financial Statements
Advantages
1. Standardized Format
Financial statements follow Generally Accepted Accounting Principles (GAAP) in the U.S., making comparisons between companies easier and more reliable.
2. Comprehensive View
The three statements together provide a 360-degree view of financial health—profitability, stability, and liquidity all in one package.
3. Historical Track Record
Publicly available statements going back years allow investors to identify trends, consistency, and management effectiveness over time.
4. Required by Law
SEC regulations mandate accurate, timely reporting, reducing (though not eliminating) the risk of fraud or misrepresentation.
5. Foundation for Valuation
All investment analysis techniques—from discounted cash flow to price-to-earnings ratios—rely on financial statement data.
Limitations
1. Backward-Looking
Financial statements report what has already happened, not what will happen. Past performance doesn’t guarantee future results.
2. Accounting Choices
Companies have some flexibility in how they report certain items (depreciation methods, revenue recognition), which can distort comparisons.
3. Doesn’t Capture Everything
Intangibles like brand value, employee morale, customer satisfaction, and competitive advantages don’t appear on financial statements.
4. Potential for Manipulation
While illegal, accounting fraud does occur (remember Enron?). Investors must stay vigilant and look for red flags.
5. Industry Differences
Comparing a tech company to a manufacturing company using the same metrics can be misleading—context matters.
6. Quarterly Focus
The pressure to meet quarterly expectations can lead companies to prioritize short-term results over long-term value creation.
| Aspect | Financial Statement | Financial Report (10-K/10-Q) |
|---|---|---|
| Definition | The core documents (income statement, balance sheet, cash flow) | Provide a comprehensive company overview |
| Contents | Just the numbers and line items | Statements + management discussion + risk factors + notes |
| Length | A few pages | Can be 100+ pages |
| Purpose | Show financial position and performance | Provide comprehensive company overview |
| Required by | GAAP accounting standards | SEC regulations |
According to Investopedia, savvy investors combine financial statement analysis with qualitative research—understanding the business model, competitive landscape, and management quality.
Financial Statement vs Financial Report: What’s the Difference?
Many beginners confuse these terms, but there’s an important distinction:
Think of it this way: The financial statements are the main course, while the financial report is the entire meal—including appetizers (management discussion), side dishes (risk factors), and dessert (supplementary schedules).
When researching investments, start with the financial statements for quick analysis, then dig into the full 10-K annual report for deeper insights.
How to Interpret Financial Statements for Investment Decisions
Reading numbers is one thing—using them to make smart investment choices is another. Here’s how successful investors apply financial statement analysis:
For Growth Investors
Focus on:
- Revenue growth rates (20%+ annually are exceptional.
- Expanding profit margins (showing operational leverage)
- Increasing free cash flow (funding future growth)
- Low debt levels (flexibility to invest in opportunities)
Questions to ask:
- Is the company reinvesting profits into research and development?
- Are sales growing faster than the industry average?
- Can the business scale without proportional cost increases?
For Value Investors
Focus on:
- Low price-to-book ratios (stock price vs. equity per share)
- Strong balance sheets with excess cash
- Consistent earnings even during downturns
- Hidden assets are not reflected in the market price
Questions to ask:
- Is the market undervaluing this company’s assets?
- Does the business generate steady cash flow?
- Is there a temporary problem creating a buying opportunity?
For Income Investors (Dividend Seekers)
Focus on:
- Consistent positive cash flow from operations
- Payout ratio below 70% (dividends ÷ net income)
- History of dividend growth over many years
- Low debt-to-equity ratios (can maintain dividends during tough times)
Questions to ask:
- Can the company afford its current dividend?
- Is free cash flow sufficient to cover dividend payments?
- Has the company increased dividends consistently?
This approach is especially valuable when identifying high dividend stocks for building passive income streams.
For Risk-Averse Investors
Focus on:
- Current ratio above 2.0 (strong liquidity)
- Minimal long-term debt
- Positive working capital
- Stable, predictable earnings
Questions to ask:
- Could this company survive a severe recession?
- Is the balance sheet strong enough to weather industry disruption?
- Are there any concerning contingent liabilities in the notes?
Understanding why people lose money in the stock market often comes down to ignoring these fundamental financial signals.
Key Risks and Common Mistakes When Analyzing Financial Statements
Even experienced investors can misinterpret financial data. Avoid these common pitfalls:
Mistake #1: Looking at One Statement in Isolation
The problem: Each statement tells only part of the story. A company might show profit on the income statement but be cash-poor according to the cash flow statement.
The solution: Always analyze all three statements together. Cross-reference numbers to ensure consistency and get the complete picture.
Mistake #2: Ignoring the Footnotes
The problem: The notes to financial statements contain critical information about accounting policies, pending lawsuits, debt covenants, and contingent liabilities.
The solution: Read the footnotes! They often reveal risks and complexities that don’t show up in the main numbers.
Mistake #3: Comparing Apples to Oranges
The problem: Different industries have vastly different financial characteristics. A 5% profit margin might be excellent for a grocery store but terrible for a software company.
The solution: Compare companies within the same industry and use industry-specific benchmarks from sources like Morningstar or industry trade associations.
Mistake #4: Focusing Only on Recent Results
The problem: One good quarter doesn’t make a great company. Temporary factors can inflate or deflate results.
The solution: Examine at least 3-5 years of statements to identify sustainable trends versus one-time events.
Mistake #5: Trusting Numbers Without Verification
The problem: Accounting fraud, while rare, does happen. Overly optimistic assumptions can also distort reality.
The solution: Look for independent auditor opinions, compare company claims to industry data, and watch for unusual accounting practices.
Mistake #6: Ignoring Non-GAAP Adjustments
The problem: Companies often report “adjusted” earnings that exclude certain expenses, which can be misleading.
The solution: Always look at GAAP numbers first, then evaluate whether non-GAAP adjustments are reasonable or just spin.
Mistake #7: Forgetting About Inflation and Economic Context
The problem: Revenue growth means little if it’s just keeping pace with inflation, not real growth.
The solution: Adjust for inflation and consider the broader economic environment when evaluating performance.
According to the Federal Reserve, understanding economic cycles helps investors interpret whether company performance reflects management skill or simply riding a favorable economic wave.
Where to Find Financial Statements
Accessing financial statements is easier than ever, thanks to SEC regulations requiring public disclosure.
Official Sources
SEC EDGAR Database (sec.gov/edgar)
- Free, authoritative source for all public company filings
- Search by company name or ticker symbol
- Access 10-K (annual), 10-Q (quarterly), and 8-K (current event) reports
Company Investor Relations Pages
- Most companies post financial statements on their websites
- Often includes presentations and management commentary
- Look for the “Investors” or “Investor Relations” section
Financial Data Platforms
Yahoo Finance (finance.yahoo.com)
- Free access to summarized financial statements
- Easy-to-read format with historical data
- Includes key ratios and analyst estimates
Morningstar (morningstar.com)
- In-depth financial analysis and ratings
- Premium features are available with a subscription
- Excellent for comparing companies
Google Finance
- Quick access to basic financial data
- Clean interface for beginners
- Links to full SEC filings
Bloomberg Terminal (Professional)
- Comprehensive data for serious investors
- Expensive subscription (for professionals)
- Real-time information and advanced analytics
Brokerage Platforms
Most investment platforms like Fidelity, Charles Schwab, and Robinhood provide financial statements for stocks in their systems—often with helpful visualizations and comparison tools.
Real Data Example: Comparing Two Companies
Let’s compare two fictional retail companies to see how financial statement analysis reveals differences:
Company A: “TrendyClothes Inc.”
Income Statement Highlights (2025):
- Revenue: $500M (up 15% from 2024)
- Net Income: $25M (5% profit margin)
- Growing expenses are eating into margins
Balance Sheet:
- Current Ratio: 1.1 (tight liquidity)
- Debt-to-Equity: 1.5 (high debt load)
- Inventory is increasing faster than sales
Cash Flow:
- Operating Cash Flow: $15M (below net income—red flag)
- Negative free cash flow after capital expenditures
Interpretation: TrendyClothes is growing but financially stressed. High debt, tight liquidity, and cash flow concerns suggest risk.
Company B: “ClassicWear Ltd.”
Income Statement Highlights (2025):
- Revenue: $450M (up 8% from 2024)
- Net Income: $45M (10% profit margin)
- Stable, consistent margins
Balance Sheet:
- Current Ratio: 2.5 (strong liquidity)
- Debt-to-Equity: 0.3 (conservative debt)
- Healthy inventory turnover
Cash Flow:
- Operating Cash Flow: $55M (exceeds net income—high quality)
- Positive free cash flow of $30M
Interpretation: ClassicWear grows more slowly but operates efficiently with strong fundamentals. Better positioned for long-term stability.
Investment decision: For conservative investors seeking steady returns and smart financial moves, ClassicWear presents lower risk despite slower growth. Aggressive investors might prefer TrendyClothes but must accept higher risk.
How Financial Statements Connect to Your Investment Strategy
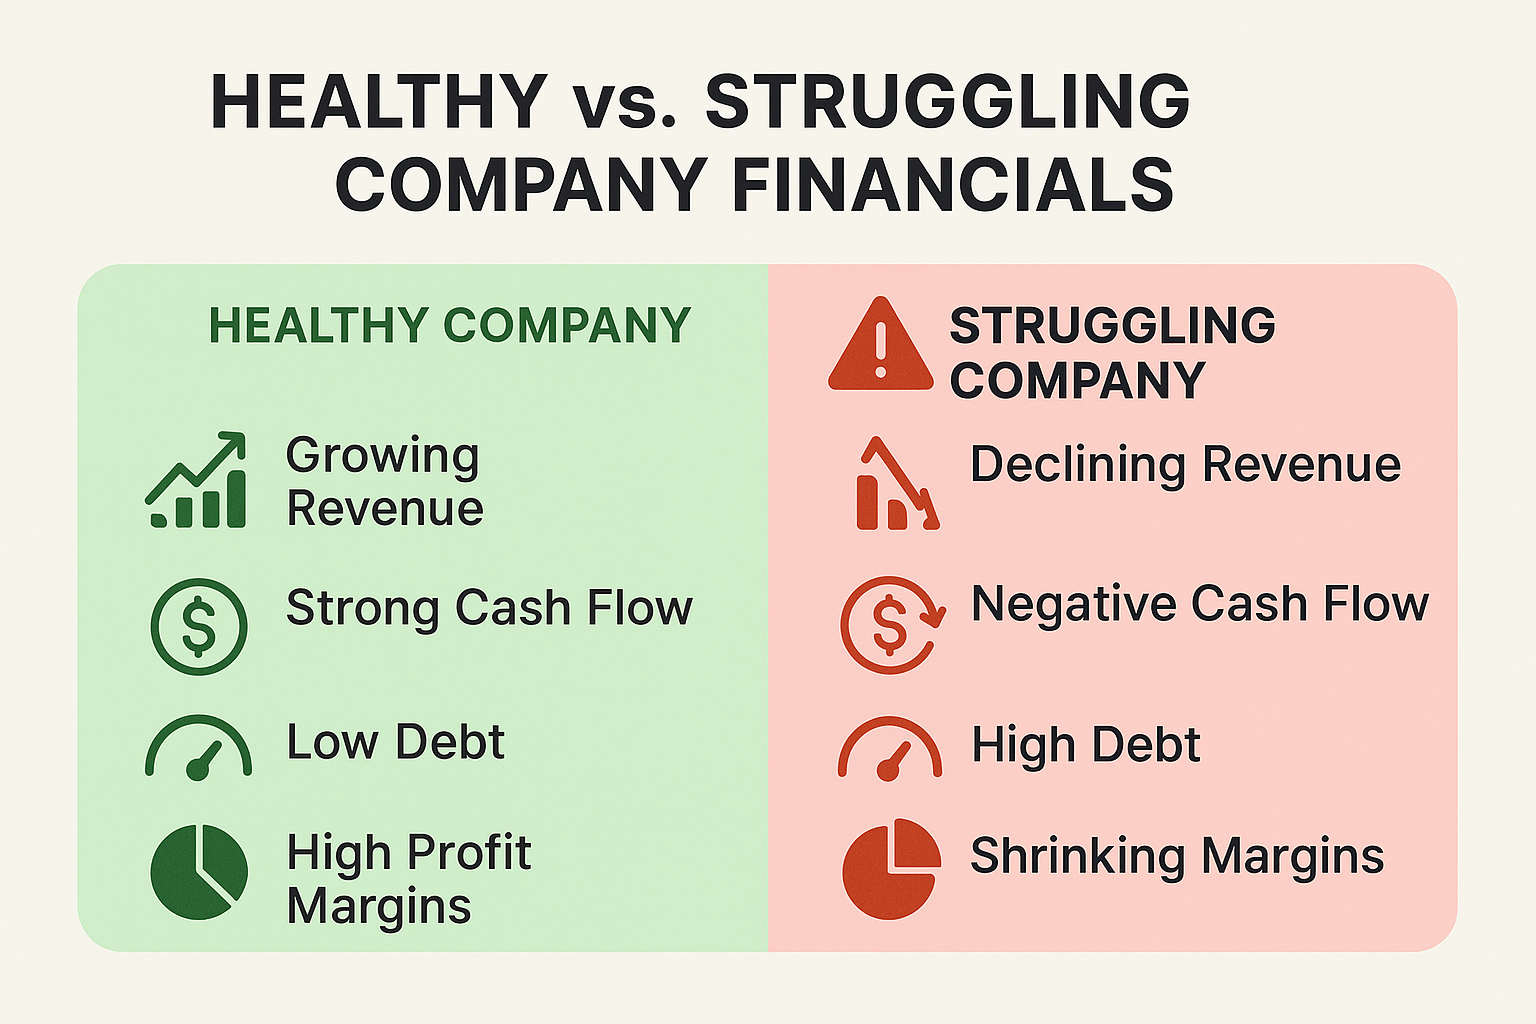
Understanding financial statements isn’t just academic—it directly impacts your investment success and wealth-building journey.
Building a Diversified Portfolio
Financial statement analysis helps you:
- Identify companies in different growth stages
- Balance high-growth with stable income producers
- Avoid concentration in financially weak sectors
- Select companies that complement each other
Timing Your Investments
While timing the market perfectly is impossible, financial statements can signal:
- When a company is undervalued relative to its fundamentals
- Warning signs before major problems surface
- Opportunities during temporary setbacks
- When to exit deteriorating positions
Planning for Retirement
For those building long-term wealth—perhaps even learning how to make your kid a millionaire—financial statements help identify:
- Companies likely to survive 20-30 years
- Reliable dividend payers for income in retirement
- Businesses with sustainable competitive advantages
- Quality companies to hold through market cycles
Avoiding Costly Mistakes
Many investors lose money not because they picked the wrong industry, but because they ignored financial red flags:
- Buying companies with unsustainable debt
- Chasing revenue growth without profitability
- Overpaying for assets shown on the balance sheet
- Missing cash flow problems hidden by accounting tricks
By mastering financial statement analysis, you develop the skills to avoid these traps and make informed decisions based on facts rather than hype.
Advanced Tips for Financial Statement Analysis
Once you’ve mastered the basics, these advanced techniques can deepen your understanding:
Trend Analysis 📈
Plot key metrics over 5-10 years:
- Revenue growth trajectory
- Margin expansion or contraction
- Return on equity trends
- Cash conversion efficiency
Tools: Create simple spreadsheets or use free tools like Google Sheets to visualize trends.
Common-Size Analysis
Convert all income statement items to percentages of revenue and all balance sheet items to percentages of total assets. This makes it easier to:
- Compare companies of different sizes
- Spot changes in cost structure
- Identify shifts in asset composition
DuPont Analysis
Break down return on equity (ROE) into three components:
- Profit margin (profitability)
- Asset turnover (efficiency)
- Equity multiplier (leverage)
Formula: ROE = (Net Income ÷ Revenue) × (Revenue ÷ Assets) × (Assets ÷ Equity)
This reveals whether ROE comes from operational excellence or financial leverage.
Quality of Earnings Assessment
Evaluate whether reported earnings reflect real economic performance:
- Compare net income to operating cash flow (should be close)
- Check for excessive use of accruals
- Look for frequent “one-time” charges (suspicious if recurring)
- Examine revenue recognition policies
Scenario Analysis
Model different futures based on financial statement data:
- What if revenue growth slows by 50%?
- Can the company handle a 20% revenue decline?
- What happens if interest rates rise and debt becomes more expensive?
This helps assess downside risk and margin of safety.
Financial Statement Analysis Tools and Resources
Free Resources
SEC.gov – Primary source for official filings
Investopedia.com – Educational articles and tutorials
Yahoo Finance – Basic financial data and statements
FRED (Federal Reserve Economic Data) – Economic context and trends
Company investor relations pages – Direct from the source
Paid Resources
Morningstar Premium – In-depth analysis and ratings
Simply Wall St – Visual financial analysis
Seeking Alpha – Analyst reports and commentary
FactSet or Bloomberg – Professional-grade data (expensive)
Educational Resources
CFA Institute – Professional certification and education
Coursera/edX – Online courses on financial analysis
Books: “Financial Statements” by Thomas Ittelson, “The Interpretation of Financial Statements” by Benjamin Graham
Spreadsheet Templates
Create your own analysis templates in Excel or Google Sheets:
- Income statement comparison (5 years)
- Balance sheet analysis with ratios
- Cash flow tracking
- Valuation models based on financial data
Many investors find that building their own models deepens understanding far more than using pre-made tools.
Conclusion: Your Next Steps to Financial Statement Mastery
Learning to read and analyze a financial statement is one of the most valuable skills any investor can develop. It transforms you from a passive market participant reacting to news and tips into an informed decision-maker who understands what’s really happening inside a company.
Remember these key principles:
All three statements work together—the income statement, the balance sheet, and the cash flow statement each reveal different aspects of financial health
Context matters—compare companies within industries and examine trends over time, not single snapshots
Cash is king—profitable companies that don’t generate cash eventually face trouble
Read the footnotes—critical information hides in the details
Combine quantitative and qualitative analysis—numbers tell you what happened, but understanding why requires deeper research.
Your Action Plan
1. Start practicing today:
- Pick a company you’re interested in
- Download its latest 10-K from the SEC website
- Work through the three financial statements
- Calculate key ratios (current ratio, profit margins, ROE)
2. Compare competitors:
- Find 2-3 companies in the same industry
- Create a simple spreadsheet comparing their metrics
- Identify which company shows the strongest fundamentals
3. Track performance over time:
- Pull 3-5 years of annual reports
- Chart revenue growth, profit margins, and cash flow trends
- Note any major changes and research what caused them
4. Continue learning:
- Read financial analysis books and articles on trusted sites like TheRichGuyMath.com
- Take online courses to deepen your understanding
- Join investment communities to discuss analysis with others
5. Apply to your investment strategy:
- Use financial statement analysis before buying any stock
- Review holdings quarterly to ensure fundamentals remain strong
- Develop your own criteria for what makes a “good” investment
Whether you’re building passive income through dividends, trying to understand stock market dynamics, or simply making smarter financial decisions, mastering financial statements gives you a competitive edge.
The companies that create wealth over decades aren’t usually the flashiest or most hyped—they’re the ones with solid fundamentals revealed in their financial statements. By learning to read these documents, you’re equipping yourself with the same tools professional investors use to identify winners and avoid losers.
Start today. Pick one company. Read one financial statement. Calculate one ratio. Each small step builds the expertise that separates successful long-term investors from those who chase trends and wonder why their returns disappoint.
Your financial future depends not on luck or timing, but on making informed decisions based on solid evidence. Financial statements provide that evidence—you just need to learn the language.
Interactive Financial Statement Calculator
📊 Financial Statement Ratio Calculator
Enter company financial data to calculate key ratios instantly
Income Statement Data
Balance Sheet Data
📈 Your Financial Ratio Results
Disclaimer
This article is for educational purposes only and does not constitute financial advice. The information provided is general in nature and should not be relied upon as a substitute for professional financial guidance tailored to your individual circumstances. Always conduct your own research and consider consulting with a qualified financial advisor before making investment decisions. Past performance does not guarantee future results, and all investments carry risk, including the potential loss of principal.
About the Author
Written by Max Fonji — with over a decade of experience in financial education and investment analysis, Max is your go-to source for clear, data-backed investing education. As the founder of TheRichGuyMath.com, Max has helped thousands of beginners understand complex financial concepts and make smarter money decisions. His mission is to demystify investing and empower everyday people to build lasting wealth through knowledge and disciplined action.
FAQ: Financial Statement Overview
What is a good profit margin for a company?
A good profit margin varies by industry. Software companies often achieve 20–30% net margins, while grocery stores might operate on 2–3% margins. Compare companies within the same sector—a margin above the industry average indicates competitive strength, while below-average margins suggest potential problems.
How do you calculate free cash flow from a financial statement?
Free cash flow equals operating cash flow minus capital expenditures. Find operating cash flow in the cash flow statement’s operating activities section, then subtract capital expenditures (often listed under investing activities as “purchase of property and equipment”). Positive free cash flow indicates money available for dividends, buybacks, or growth investments.
What’s the difference between gross profit and net income?
Gross profit is revenue minus the direct cost of producing goods (COGS), showing how much money is left after production costs. Net income is what remains after subtracting all expenses—operating costs, interest, taxes, and other items. Net income represents the actual profit available to shareholders.
Why might a profitable company have negative cash flow?
A company can show accounting profit while experiencing negative cash flow if it’s investing heavily in inventory, extending generous payment terms to customers, or spending aggressively on growth. The income statement recognizes revenue when earned (not necessarily when cash is received), creating temporary mismatches. Sustained divergence between profit and cash flow, however, is a red flag.
How often should I review a company’s financial statements?
For long-term investors, reviewing statements quarterly when they’re released is sufficient. Check the 10-Q quarterly reports and the more comprehensive 10-K annual report. If you notice concerning trends or major news about the company, review it immediately. Day traders and active investors might monitor more frequently, but most buy-and-hold investors don’t need constant monitoring.
What does it mean when a company “beats earnings”?
When a company “beats earnings,” it reports higher earnings per share (EPS) than analysts expected. Wall Street analysts publish estimates before earnings releases, and companies that exceed these expectations often see stock price increases. However, focus on actual business fundamentals rather than just beating estimates—a company can beat lowered expectations while still performing poorly.
Can financial statements be manipulated?
While illegal, financial statement manipulation does occur through aggressive accounting interpretations, premature revenue recognition, understating expenses, or hiding liabilities. The SEC and external auditors work to prevent fraud, but investors should remain vigilant. Warning signs include frequent accounting changes, unusual transactions near quarter-end, and results that seem too good compared to industry peers.


