Every successful business owner knows a fundamental truth: understanding what you owe is just as important as knowing what you own.
In 2025, as companies navigate complex financial landscapes and investors scrutinize balance sheets with increasing sophistication, liabilities remain one of the most critical yet often misunderstood components of financial health. Whether you’re analyzing your first stock investment, managing a small business, or simply trying to understand the math behind money, grasping how liabilities work transforms your ability to make sound financial decisions.
Liabilities represent the financial obligations that companies and individuals must eventually settle. They’re the promises to pay, the debts owed, the bills coming due. Understanding them isn’t just accounting jargon; it’s the foundation of risk management and wealth building.
This comprehensive guide breaks down everything you need to know about liabilities: what they are, how they’re classified, why they matter, and how to analyze them using key financial ratios. By the end, you’ll understand the cause-and-effect relationships that determine financial stability and make informed decisions based on data-driven insights.
Key Takeaways
- Liabilities are financial obligations arising from past transactions that require future payment of cash, goods, or services to other parties
- Two main categories exist: current liabilities (due within 12 months) and non-current liabilities (due beyond one year), each serving different analytical purposes
- The accounting equation (Assets = Liabilities + Shareholders’ Equity) establishes the mathematical relationship between what a company owns and owes
- Key ratios like debt-to-equity, current ratio, and debt ratio provide quantifiable measures of financial health and risk exposure
- Strategic liability management separates financially healthy companies from those at risk, making this knowledge essential for investors and business owners
What Are Liabilities? The Core Definition
A liability is a present financial obligation of a company arising from past events, the settlement of which is expected to result in an outflow of resources embodying economic benefits.
In plain English, liabilities are what you owe to others.
These obligations stem from transactions or events that have already occurred. When a company purchases inventory on credit, borrows money from a bank, or receives payment for services not yet delivered, it creates a liability, a legal or constructive obligation to transfer value in the future.
The Math Behind Liabilities
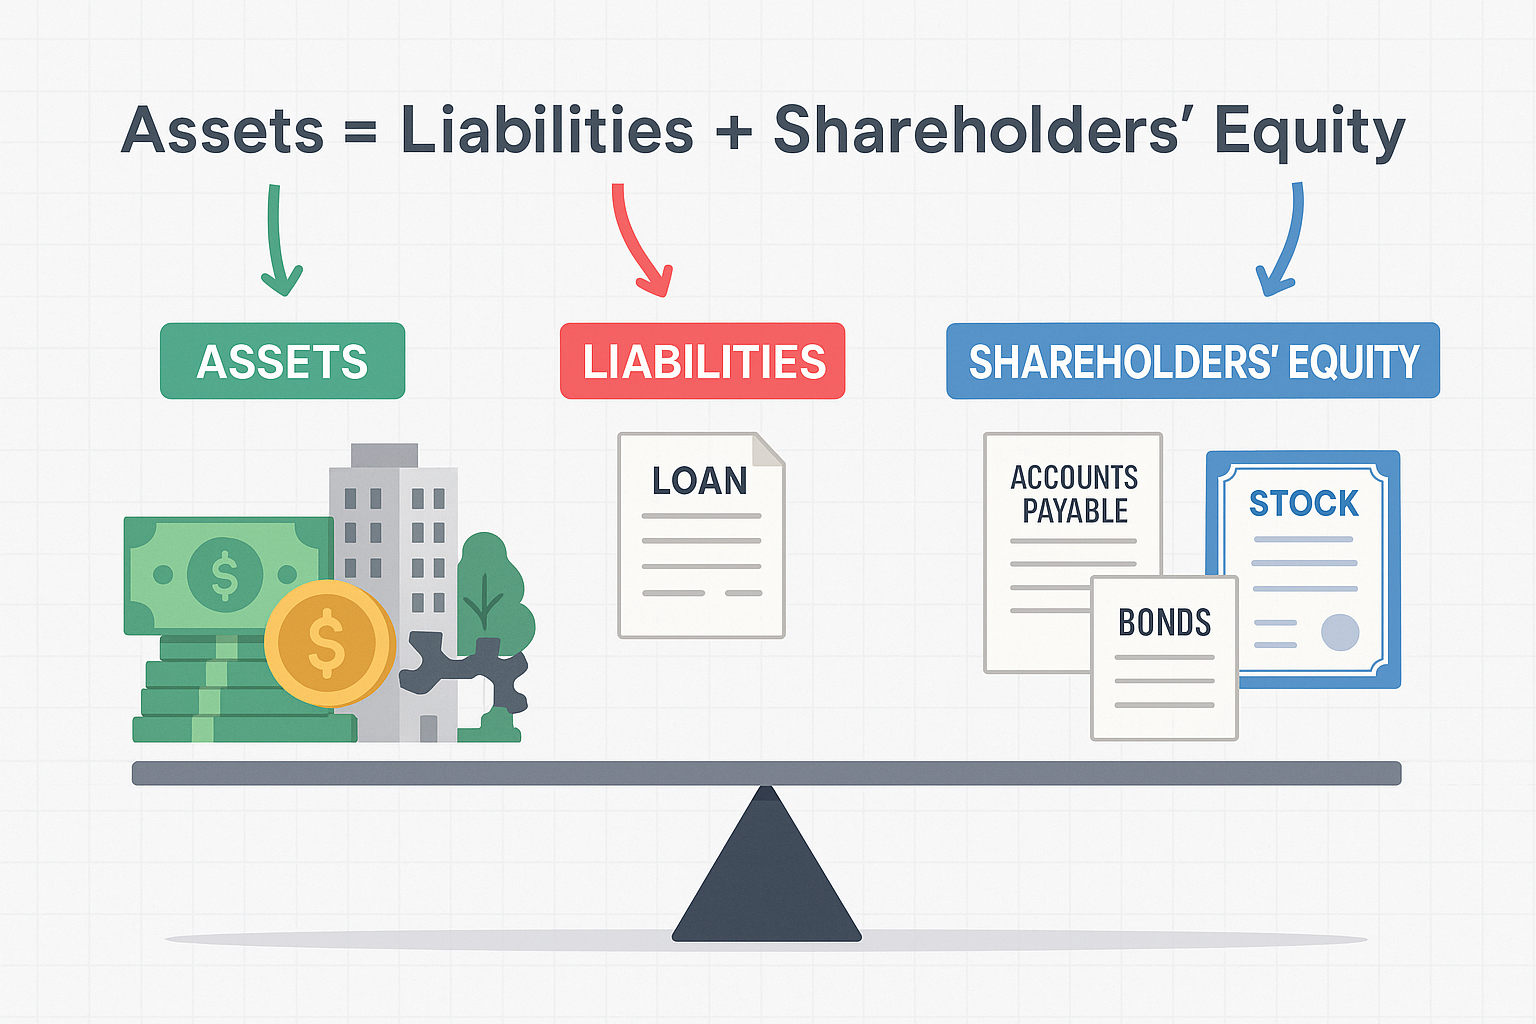
Liabilities exist within the fundamental accounting equation that governs all financial reporting:
Assets = Liabilities + Shareholders’ Equity
This equation must always balance. It shows that everything a company owns (assets) is financed either by borrowing (liabilities) or by owner investment and retained profits (equity).
Rearranging this equation reveals an important insight:
Shareholders’ Equity = Assets – Liabilities
This formula demonstrates that equity represents the residual claim, what would remain for owners after all liabilities are settled. Therefore, higher liabilities relative to assets mean lower equity and potentially higher financial risk.
Liabilities vs. Expenses: A Critical Distinction
Many beginners confuse liabilities with expenses, but they’re fundamentally different:
Expenses are costs incurred to generate revenue during a specific period. They appear on the income statement and reduce profitability. Examples include rent, salaries, utilities, and advertising costs.
Liabilities are obligations to pay in the future. They appear on the balance sheet and represent claims against assets. An expense becomes a liability when it’s incurred but not yet paid.
For example, when a company pays $10,000 for monthly rent on the due date, it records an expense with no liability. But if the company owes $10,000 in rent at month-end but hasn’t paid yet, it records both an expense (on the income statement) and a liability called “accrued rent payable” (on the balance sheet).
This distinction matters because expenses affect profitability, while liabilities affect financial position and liquidity.
Types of Liabilities: Current vs Non-Current
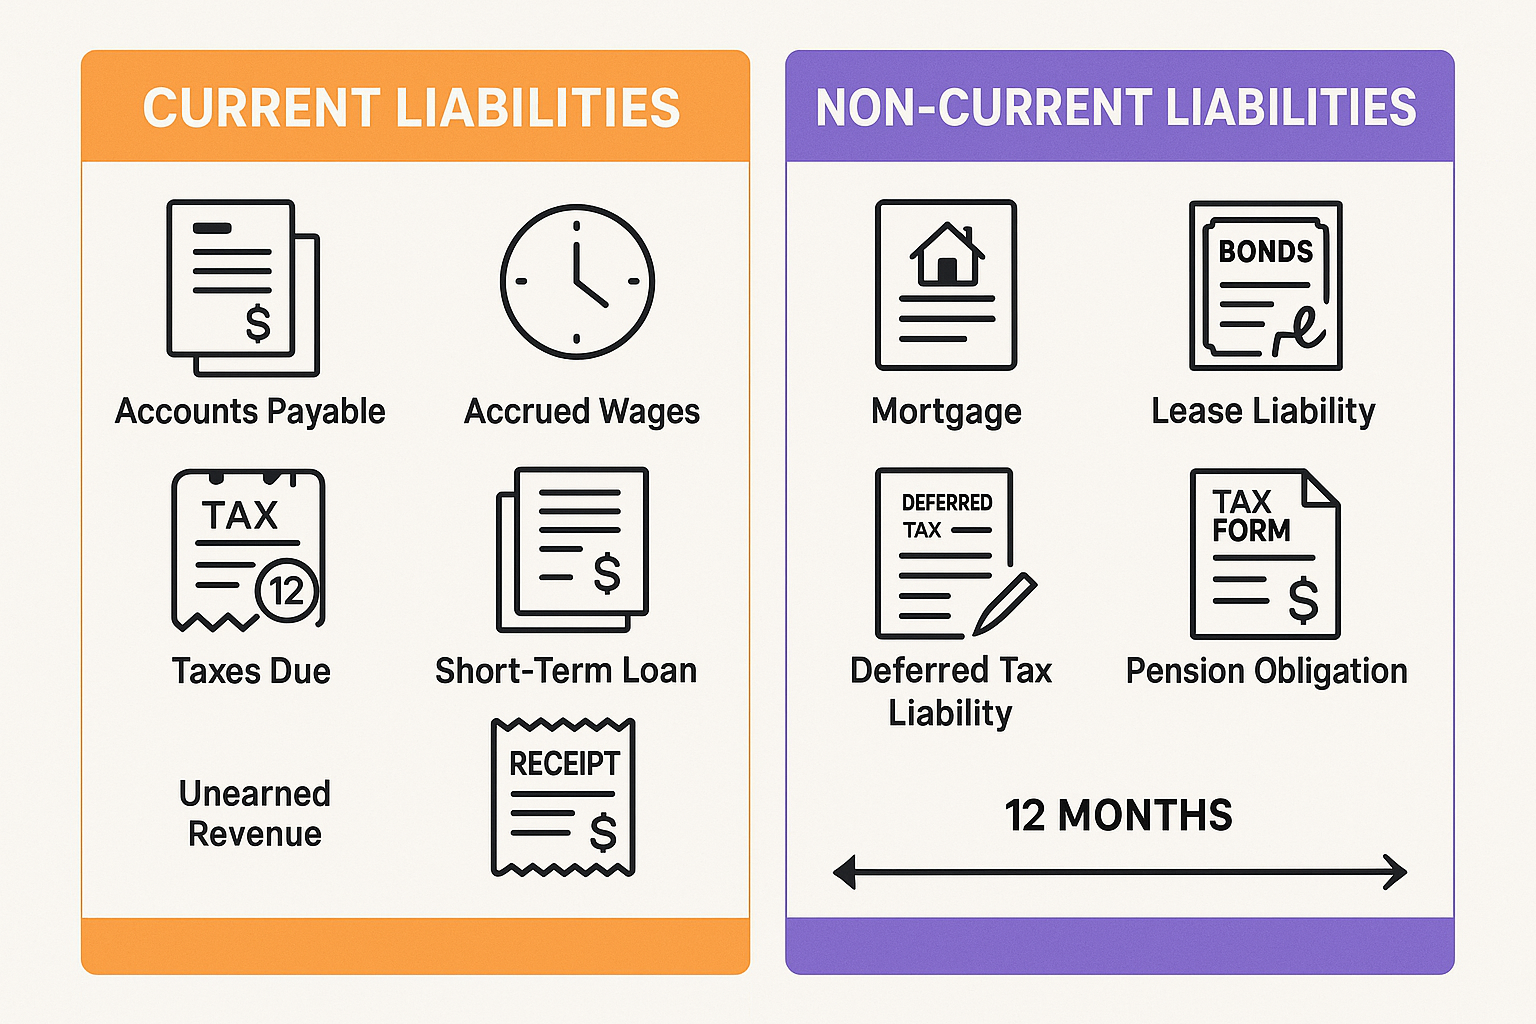
Financial reporting standards require companies to classify liabilities based on their time horizon. This classification provides critical information about a company’s short-term cash needs and long-term financial commitments.
Current Liabilities (Short-Term Obligations)
Current liabilities are obligations expected to be settled within 12 months or within the company’s normal operating cycle, whichever is longer.
These short-term obligations appear at the top of the liabilities section on the balance sheet because they represent the most immediate claims against company resources.
Common Examples of Current Liabilities
Amounts owed to suppliers for goods or services purchased on credit. When a company receives inventory with payment terms of “Net 30,” it creates an accounts payable, a promise to pay within 30 days.
2. Accrued Expenses
Costs incurred but not yet paid, such as wages earned by employees but not yet distributed, utilities consumed but not yet billed, or interest accumulated on loans.
3. Short-Term Debt
Loans, lines of credit, or portions of long-term debt due within the next 12 months. This includes the current portion of long-term debt that must be reclassified as it approaches maturity.
4. Taxes Payable
Income taxes, sales taxes, payroll taxes, and other tax obligations owed to government authorities but not yet remitted.
5. Unearned Revenue (Deferred Revenue)
Cash received from customers for products or services not yet delivered. This represents an obligation to perform work or deliver goods in the future. For example, when a software company receives annual subscription payments upfront, it records unearned revenue as a liability.
6. Dividends Payable
Dividends declared by the board of directors but not yet distributed to shareholders.
Understanding current liabilities is essential for assessing liquidity, a company’s ability to meet short-term obligations. Companies with insufficient liquid assets to cover current liabilities face potential cash flow crises.
Non-Current Liabilities (Long-Term Obligations)
Non-current liabilities (also called long-term liabilities) are obligations not due for settlement within the next 12 months.[3]
These obligations represent longer-term financing strategies and commitments that extend beyond the immediate operating cycle.
Common Examples of Non-Current Liabilities
1. Long-Term Debt
Bonds payable, mortgages, and term loans with maturity dates beyond one year. These instruments often finance major capital investments like facilities, equipment, or acquisitions.
2. Bonds Payable
Debt securities are issued to investors with specified interest rates and maturity dates, typically ranging from 5 to 30 years.
3. Deferred Tax Liabilities
Future tax obligations arising from temporary differences between accounting income and taxable income. These occur when companies use different depreciation methods for financial reporting versus tax purposes.
4. Lease Obligations
Under current accounting standards, companies must recognize long-term lease commitments as liabilities on the balance sheet, representing the present value of future lease payments.
5. Pension Obligations
Commitments to pay retirement benefits to employees represent the present value of future pension payments.
6. Long-Term Warranties
Obligations to repair or replace products under warranty agreements extending beyond one year.
Long-term liabilities reveal a company’s capital structure and leverage strategy. While they create obligations, they also enable growth by providing capital for expansion without diluting ownership.
Contingent Liabilities: The Uncertain Obligations
Contingent liabilities are possible obligations that depend on uncertain future events.
These potential liabilities exist when:
- A past event has occurred
- The obligation depends on future events outside the company’s control
- The probability or amount cannot be reliably determined
Examples of Contingent Liabilities
Pending Lawsuits: Legal claims where the outcome and financial impact remain uncertain
Product Warranties: Potential costs of honoring warranties, where exact claims are unpredictable
Loan Guarantees: Obligations to pay if another party defaults on their debt
Environmental Remediation: Potential cleanup costs for environmental damage
Accounting standards require companies to disclose contingent liabilities in financial statement footnotes when the likelihood is reasonably possible. If the liability is probable and the amount can be reasonably estimated, it must be recorded on the balance sheet.
For investors, contingent liabilities represent hidden risks that could materially impact future financial position.
How Liabilities Appear on the Balance Sheet
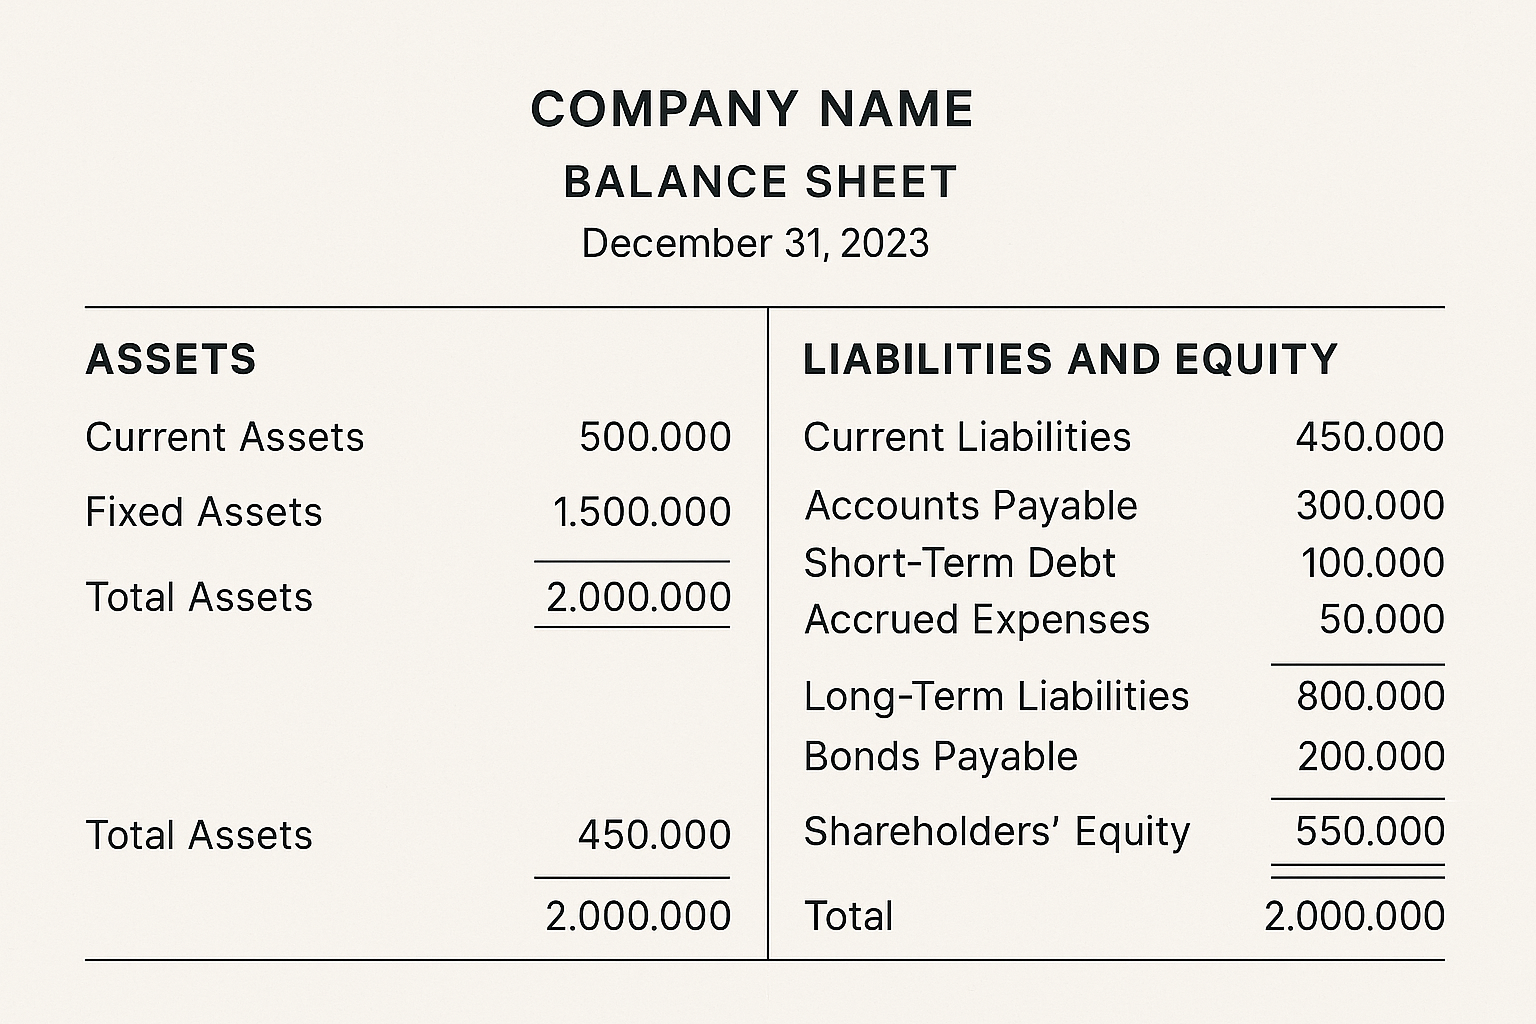
The balance sheet presents a company’s financial position at a specific point in time, organized into three main sections: assets, liabilities, and shareholders’ equity.
Balance Sheet Structure
Assets appear on the left side (or top section in vertical format), listed in order of liquidity:
- Current assets (cash, accounts receivable, inventory)
- Non-current assets (property, equipment, intangible assets)
Liabilities and Shareholders’ Equity appear on the right side (or bottom section), with liabilities listed first:
- Current liabilities
- Non-current liabilities
- Shareholders’ equity
This structure visually represents the accounting equation, showing how assets are financed through a combination of debt (liabilities) and ownership (equity).
Reading the Liabilities Section
Within the liabilities section, items are typically organized by:
- Classification: Current vs. non-current
- Magnitude: Largest obligations listed first within each category
- Nature: Similar items grouped together
Example Balance Sheet Liabilities Section:
| Current Liabilities | Amount |
|---|---|
| Accounts Payable | $150,000 |
| Accrued Wages | $45,000 |
| Short-Term Debt | $100,000 |
| Taxes Payable | $30,000 |
| Unearned Revenue | $25,000 |
| Total Current Liabilities | $350,000 |
| Non-Current Liabilities | |
| Long-Term Debt | $500,000 |
| Bonds Payable | $300,000 |
| Deferred Tax Liabilities | $75,000 |
| Lease Obligations | $125,000 |
| Total Non-Current Liabilities | $1,000,000 |
| Total Liabilities | $1,350,000 |
This organization allows analysts to quickly assess both immediate payment obligations and long-term financial commitments.
Why the Classification Matters
The separation between current and non-current liabilities serves several analytical purposes:
Liquidity Analysis: Current liabilities indicate near-term cash requirements, helping assess whether a company can meet its obligations
Working Capital Calculation: Current assets minus current liabilities equals working capital, a key measure of operational efficiency
Financial Risk Assessment: The ratio of current to non-current liabilities reveals the timing of payment pressures
Cash Flow Planning: Understanding when obligations come due enables better cash management and financing decisions
When reviewing any company’s financial statements, examining the composition and trends in liabilities provides essential insights into financial health and risk exposure.
Key Financial Ratios for Analyzing Liabilities
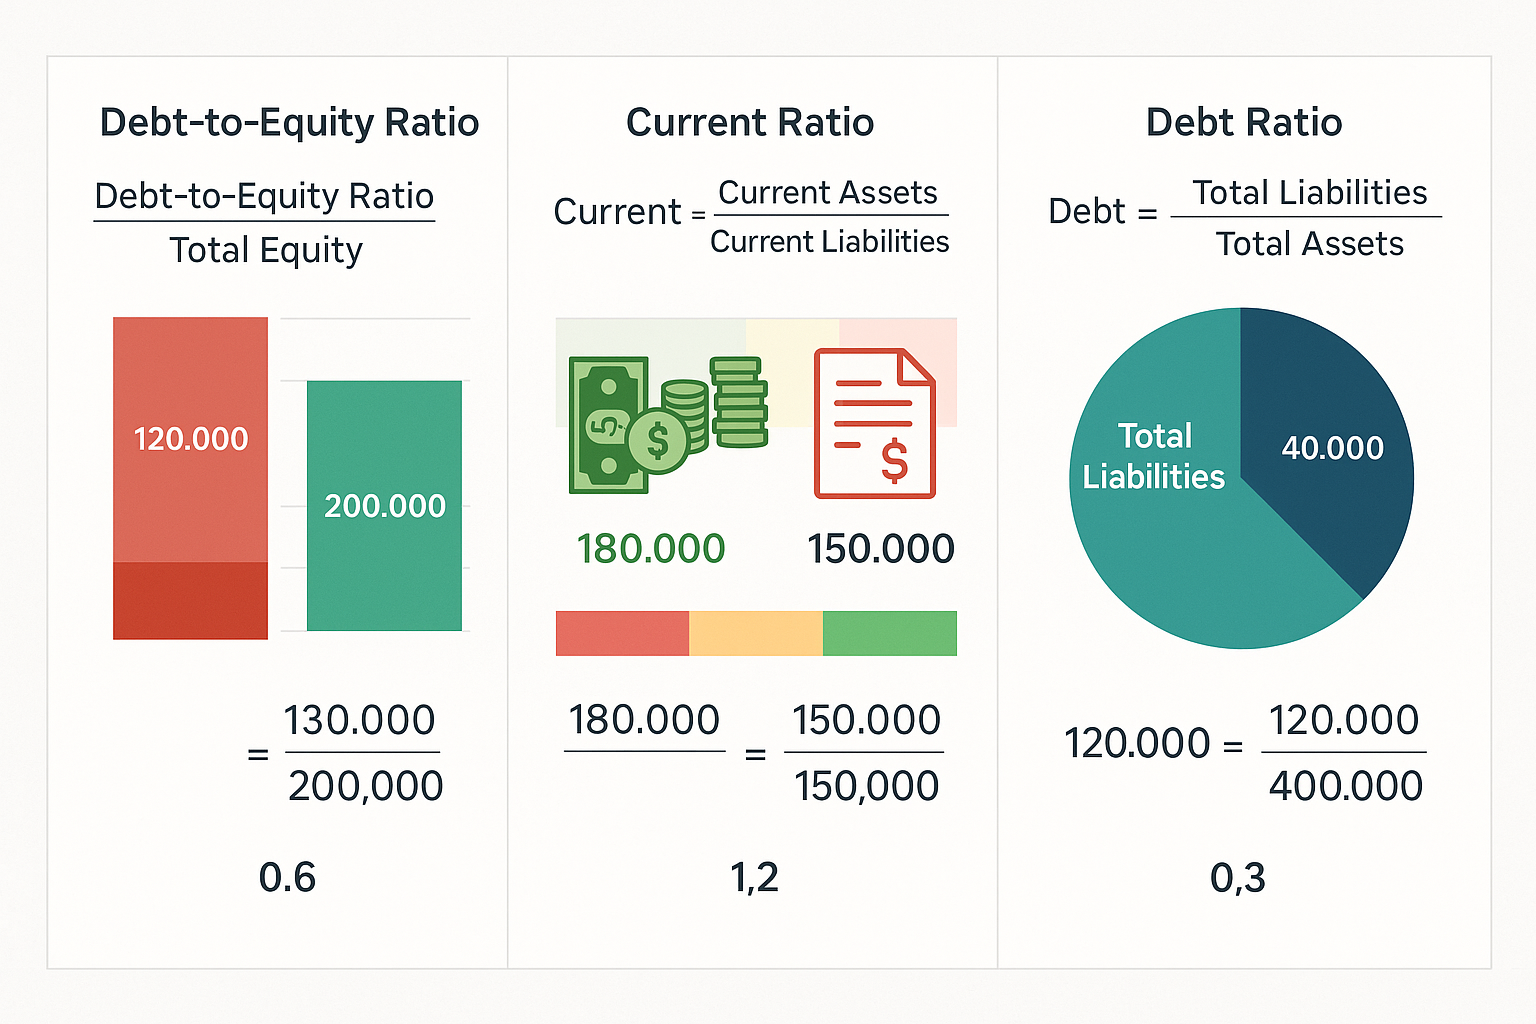
Numbers without context provide limited insight. Financial ratios transform raw liability data into meaningful metrics that enable comparison across companies, industries, and time periods.
1. Debt-to-Equity Ratio
The debt-to-equity ratio measures financial leverage by comparing total liabilities to shareholders’ equity.
Formula:
Debt-to-Equity Ratio = Total Liabilities ÷ Shareholders' EquityExample:
- Total Liabilities: $1,350,000
- Shareholders’ Equity: $650,000
- Debt-to-Equity Ratio = $1,350,000 ÷ $650,000 = 2.08
Interpretation:
A ratio of 2.08 means the company has $2.08 in liabilities for every $1.00 of equity. This indicates significant leverage; the company relies heavily on debt financing.
Benchmarks:
- Below 1.0: Conservative capital structure with more equity than debt
- 1.0 to 2.0: Moderate leverage, common in many industries
- Above 2.0: High leverage, potentially higher financial risk
Industry context matters significantly. Capital-intensive industries like utilities or telecommunications typically operate with higher debt-to-equity ratios than technology or service companies.
2. Current Ratio
The current ratio measures short-term liquidity by comparing current assets to current liabilities.
Formula:
Current Ratio = Current Assets ÷ Current LiabilitiesExample:
- Current Assets: $525,000
- Current Liabilities: $350,000
- Current Ratio = $525,000 ÷ $350,000 = 1.50
Interpretation:
A current ratio of 1.50 indicates the company has $1.50 in current assets for every $1.00 of current liabilities. This suggests adequate short-term liquidity to meet obligations.
Benchmarks:
- Below 1.0: Potential liquidity problems; current liabilities exceed current assets
- 1.0 to 2.0: Generally healthy liquidity position
- Above 2.0: Strong liquidity, though excessively high ratios may indicate inefficient asset use
This ratio provides a quick assessment of whether a company can pay its bills over the next 12 months using readily available resources.
3. Debt Ratio
The debt ratio shows what proportion of assets are financed through liabilities.
Formula:
Debt Ratio = Total Liabilities ÷ Total AssetsExample:
- Total Liabilities: $1,350,000
- Total Assets: $2,000,000
- Debt Ratio = $1,350,000 ÷ $2,000,000 = 0.675 or 67.5%
Interpretation:
A debt ratio of 67.5% means that 67.5% of the company’s assets are financed through liabilities, while 32.5% are financed through equity.
Benchmarks:
- Below 0.40 (40%): Conservative financing with low financial risk
- 0.40 to 0.60 (40-60%): Moderate leverage, balanced capital structure
- Above 0.60 (60%): Higher leverage and financial risk
Higher debt ratios amplify both returns and risks. When business is strong, leverage magnifies profits. When a business struggles, high debt obligations can create financial distress.
4. Quick Ratio (Acid-Test Ratio)
The quick ratio provides a more stringent test of liquidity by excluding inventory from current assets.
Formula:
Quick Ratio = (Current Assets - Inventory) ÷ Current LiabilitiesExample:
- Current Assets: $525,000
- Inventory: $175,000
- Current Liabilities: $350,000
- Quick Ratio = ($525,000 – $175,000) ÷ $350,000 = 1.00
Interpretation:
A quick ratio of 1.00 indicates the company can cover current liabilities using only its most liquid assets (cash, marketable securities, and accounts receivable).
This ratio matters because inventory can’t always be quickly converted to cash at full value, especially during financial stress.
5. Interest Coverage Ratio
The interest coverage ratio measures how easily a company can pay interest expenses on outstanding debt.
Formula:
Interest Coverage Ratio = EBITDA ÷ Interest ExpenseExample:
- EBITDA: $400,000
- Interest Expense: $80,000
- Interest Coverage Ratio = $400,000 ÷ $80,000 = 5.0
Interpretation:
A ratio of 5.0 means the company generates five times the operating income needed to cover interest payments, indicating comfortable debt service capacity.
Benchmarks:
- Below 1.5: Difficulty covering interest payments; potential default risk
- 1.5 to 2.5: Adequate but limited cushion
- Above 2.5: Strong ability to service debt obligations
This ratio reveals whether debt levels are sustainable given current profitability.
Ratio Analysis in Practice
No single ratio tells the complete story. Effective financial analysis requires:
- Multiple ratios to assess different dimensions of financial health
- Trend analysis comparing ratios over multiple periods
- Peer comparison benchmarking against industry competitors
- Context consideration accounting for business model and economic conditions
When analyzing companies as potential investments, examining how liability-related ratios have evolved reveals whether the financial position is strengthening or deteriorating. Understanding these ratios transforms you from a passive observer into an informed analyst capable of data-driven investment decisions.
Real-World Examples of Liabilities in Action
Abstract concepts become clear through concrete examples. Let’s examine how liabilities function in different business scenarios.
Example 1: Retail Company Managing Seasonal Inventory
Scenario:
A retail company needs to stock inventory for the holiday shopping season. In September, it orders $500,000 worth of merchandise from suppliers with payment terms of Net 60 (payment due in 60 days).
Liability Creation:
When the inventory arrives, the company records:
- Asset increase: Inventory +$500,000
- Liability increase: Accounts Payable +$500,000
The accounting equation remains balanced: both sides increase by $500,000.
Liability Settlement:
In November, the company pays the supplier:
- Asset decrease: Cash -$500,000
- Liability decrease: Accounts Payable -$500,000
Key Insight:
This current liability enabled the company to acquire inventory without immediate cash outlay, preserving liquidity during a critical period. The 60-day payment terms aligned with the company’s cash conversion cycle, the time needed to sell inventory and collect customer payments.
Example 2: Technology Startup with Unearned Revenue
Scenario:
A software-as-a-service (SaaS) company sells annual subscriptions for $12,000. In January, a customer pays the full amount upfront for a one-year subscription.
Liability Creation:
When payment is received, the company records:
- Asset increase: Cash +$12,000
- Liability increase: Unearned Revenue +$12,000
Despite receiving cash, the company hasn’t yet earned the revenue because it must deliver services over 12 months.
Liability Reduction:
Each month, as the company delivers services, it recognizes revenue:
- Liability decrease: Unearned Revenue -$1,000
- Revenue recognition: Subscription Revenue +$1,000
After 12 months, the liability is fully eliminated and all revenue is recognized.
Key Insight:
Unearned revenue represents a performance obligation, a promise to deliver value in the future. For SaaS companies, high unearned revenue often signals strong future revenue visibility and customer commitment.
Example 3: Manufacturing Company Issuing Bonds
Scenario:
A manufacturing company needs $10 million to build a new production facility. Rather than taking a bank loan, it issues 10-year corporate bonds with a 5% annual interest rate.
Liability Creation:
When bonds are issued, the company records:
- Asset increase: Cash +$10,000,000
- Liability increase: Bonds Payable +$10,000,000
Ongoing Obligations:
Each year, the company must:
- Pay interest: $10,000,000 × 5% = $500,000 (recorded as an expense)
- Maintain the bonds payable liability on the balance sheet
As maturity approaches, the company must either:
- Accumulate cash to repay bondholders
- Refinance by issuing new bonds
- Sell assets to generate repayment funds
Key Insight:
Long-term debt enables major capital investments that generate returns over many years. The facility financed by these bonds might produce profits for decades, justifying the 10-year financing period. However, the company now has a fixed obligation to pay interest regardless of business performance.
Example 4: Small Business Managing Working Capital
Scenario:
A consulting firm has the following current liabilities and assets:
Current Assets:
- Cash: $50,000
- Accounts Receivable: $120,000
- Total Current Assets: $170,000
Current Liabilities:
- Accounts Payable: $40,000
- Accrued Wages: $25,000
- Short-Term Loan: $60,000
- Total Current Liabilities: $125,000
Analysis:
- Working Capital = $170,000 – $125,000 = $45,000
- Current Ratio = $170,000 ÷ $125,000 = 1.36
Situation:
The firm has positive working capital and a current ratio above 1.0, indicating adequate short-term liquidity. However, $120,000 of its $170,000 in current assets consists of accounts receivable, money customers owe but haven’t paid yet.
If customers delay payments or default, the firm could face a liquidity crisis despite appearing financially healthy on paper.
Key Insight:
The composition of current assets matters as much as the total amount. Cash and near-cash assets provide more reliable liquidity than receivables or inventory. Effective working capital management requires monitoring both sides of the equation and understanding the cash conversion cycle.
Strategic Implications: How Liabilities Impact Business Decisions
Understanding liabilities isn’t merely an accounting exercise; it fundamentally shapes business strategy and financial decision-making.
Capital Structure Optimization
Every company faces a fundamental question: Should we finance operations and growth through debt (liabilities) or equity?
Debt Financing Advantages:
- Tax benefits: Interest payments are tax-deductible, reducing the effective cost of debt
- Ownership retention: Borrowing doesn’t dilute existing shareholders’ ownership
- Fixed obligations: Predictable payment schedules enable planning
- Leverage amplification: Debt magnifies returns when investments perform well
Debt Financing Disadvantages:
- Mandatory payments: Interest and principal must be paid regardless of profitability
- Financial risk: High debt increases bankruptcy risk during downturns
- Covenants: Loan agreements often restrict operational flexibility
- Credit impact: Excessive debt damages credit ratings and increases borrowing costs
The optimal capital structure balances these factors based on industry dynamics, growth stage, and risk tolerance.
Liquidity Management and Cash Flow Planning
Current liabilities drive short-term cash requirements. Companies must ensure sufficient liquidity to meet obligations as they come due.
Effective liquidity management requires:
- Cash flow forecasting: Projecting when liabilities must be paid and when cash will be available
- Working capital optimization: Balancing receivables, inventory, and payables to maintain positive cash flow
- Credit line maintenance: Establishing backup financing for unexpected shortfalls
- Payment timing: Negotiating favorable payment terms with suppliers while maintaining good relationships
Companies that fail to manage current liabilities effectively face:
- Supplier relationship damage from late payments
- Late fees and penalty interest charges
- Credit rating downgrades
- Potential bankruptcy despite long-term profitability
This explains why profitable companies sometimes fail—profitability and liquidity are different concepts.
Growth and Investment Decisions
Liabilities enable growth by providing capital for expansion without requiring immediate cash or equity dilution.
Strategic uses of liabilities:
Equipment financing: Purchasing machinery through loans or leases, with the equipment itself generating revenue to service the debt
Real estate mortgages: Acquiring facilities with long-term mortgages aligned with the useful life of the property
Working capital lines: Funding seasonal inventory needs or bridging gaps between production costs and customer payments
Acquisition financing: Borrowing to purchase competitors or complementary businesses
The key question: Will the investment generate returns exceeding the cost of the liability?
If a company can borrow at 6% interest and invest in projects returning 15%, taking on debt creates value. If investments return only 4%, debt destroys value.
Risk Management Through Liability Structure
The composition and timing of liabilities significantly impact financial risk.
Lower-risk liability structures:
- Longer maturity dates spread obligations over time
- Fixed interest rates eliminate uncertainty
- Minimal covenants preserving operational flexibility
- Diversified creditor base, reducing dependence on any single lender
Higher-risk liability structures:
- Short-term debt requiring frequent refinancing
- Variable interest rates create payment uncertainty
- Restrictive covenants limiting strategic options
- Concentration with a few creditors increases the negotiating disadvantage
Companies with mismatched asset-liability duration face particular risk. Financing long-term assets (like buildings) with short-term debt creates refinancing risk. What happens if credit markets freeze when the debt matures?
Investor Perspective: What Liabilities Reveal
For investors analyzing potential stock purchases, liabilities provide critical insights:
Red flags:
- Rapidly growing liabilities relative to assets
- Current ratios below 1.0 indicate potential liquidity crises
- Debt-to-equity ratios significantly above industry peers
- Large contingent liabilities suggest hidden risks
- Frequent debt restructuring indicates financial stress
Positive signals:
- Stable or declining liability ratios over time
- Manageable debt service relative to cash flow
- Strategic use of leverage to fund profitable growth
- Long-term liability structure providing financial flexibility
Understanding how a company manages liabilities reveals management quality and strategic thinking. Companies that use debt strategically to fund value-creating investments demonstrate financial sophistication. Those that accumulate liabilities to cover operating losses signal fundamental business problems.
Common Misconceptions About Liabilities
Several widespread misconceptions about liabilities lead to poor financial decisions.
Misconception 1: “All Debt Is Bad”
Reality: Liabilities are tools, neither inherently good nor bad. Their value depends on how they’re used.
Strategic debt enables:
- Homeownership through mortgages
- Business expansion through equipment loans
- Education through student loans
- Wealth building through real estate investment
The 20/4/10 rule for car buying demonstrates smart debt management: 20% down payment, 4-year maximum loan term, and total monthly vehicle expenses under 10% of gross income.
Problematic debt fund consumption without creating future value carries excessive interest rates or exceeds repayment capacity.
Misconception 2: “High Liabilities Always Mean Financial Trouble”
Reality: Liability levels must be evaluated relative to assets, income, and industry context.
A utility company with $10 billion in liabilities might be perfectly healthy if it has $15 billion in assets generating stable cash flows. A tech startup with $500,000 in liabilities might face a crisis if it has minimal revenue and limited assets.
The absolute amount matters less than:
- The ratio to total assets
- The ability to service debt from operating cash flow
- The strategic purpose of the liabilities
- Industry-specific norms
Misconception 3: “Current Liabilities Are More Dangerous Than Long-Term Liabilities”
Reality: Both create risk, but in different ways.
Current liabilities create immediate liquidity pressure—cash must be available soon. Long-term liabilities create extended obligations that compound over time.
A company with $1 million in current liabilities but $3 million in cash faces little risk. A company with $50 million in long-term debt at 8% interest must generate enough profit to cover $4 million in annual interest indefinitely.
The most dangerous situation combines high current liabilities with insufficient liquid assets and high long-term debt, limiting refinancing options.
Misconception 4: “Paying Off All Liabilities Should Be the Top Priority”
Reality: Optimal financial strategy balances debt reduction with other goals.
Aggressively paying off a 3% mortgage while earning 8% in diversified investments destroys value. The 5% spread represents a lost opportunity.
Similarly, businesses that eliminate all debt might sacrifice growth opportunities that could generate higher returns than the cost of borrowing.
Smart financial management considers:
- Interest rates on liabilities versus potential investment returns
- Tax implications (mortgage interest deductions, business interest deductions)
- Risk tolerance and financial security needs
- Opportunity costs of capital allocation
Understanding these nuances separates sophisticated financial thinkers from those following oversimplified rules.
Liabilities in Personal Finance: Individual Applications
While this guide focuses primarily on business liabilities, the same principles apply to personal financial management.
Personal Balance Sheet
Individuals can create personal balance sheets using an identical structure:
Personal Assets:
- Cash and savings accounts
- Investment accounts (retirement, brokerage)
- Real estate (home, rental properties)
- Vehicles
- Personal property
Personal Liabilities:
- Mortgage balance
- Auto loans
- Student loans
- Credit card balances
- Personal loans
Net Worth = Total Assets – Total Liabilities
Tracking personal net worth over time reveals whether the financial position is improving or deteriorating.
Personal Liability Management Strategies
1. Prioritize High-Interest Debt
Credit card debt at 18-24% interest rates destroys wealth faster than almost any investment can build it. Eliminating high-interest liabilities should be the top priority after establishing a basic emergency fund.
2. Understand Good Debt vs. Bad Debt
Potentially beneficial debt:
- Mortgages on appreciating real estate with tax-deductible interest
- Student loans for education increase earning capacity
- Business loans fund profitable ventures
- Investment property loans generating positive cash flow
Problematic debt:
- High-interest credit card balances fund consumption
- Auto loans on depreciating vehicles exceeding the 20/4/10 rule
- Personal loans for discretionary spending
- Payday loans with predatory interest rates
3. Apply the 50/30/20 Rule for Budgeting
The 50/30/20 rule allocates:
- 50% of after-tax income to needs (including minimum debt payments)
- 30% to wants
- 20% to savings and additional debt reduction
This framework ensures liability management doesn’t crowd out wealth building through savings and investment.
4. Monitor Personal Debt Ratios
Debt-to-Income Ratio = Total Monthly Debt Payments ÷ Gross Monthly Income
Lenders typically prefer this ratio below 36%, with housing costs under 28% of gross income (the 3x rent rule suggests monthly rent shouldn’t exceed 1/3 of gross monthly income).
Credit Utilization Ratio = Credit Card Balances ÷ Total Credit Limits
Maintaining credit utilization below 30% (ideally below 10%) optimizes credit scores.
5. Understand Liability Impact on Net Worth Growth
Every dollar paid toward liability principal increases net worth by reducing what you owe. Every dollar of interest paid is simply an expense; it doesn’t build wealth.
This explains why minimizing interest through:
- Lower interest rates (refinancing when beneficial)
- Shorter loan terms (when cash flow permits)
- Additional principal payments (on high-interest debt)
Accelerates wealth building by redirecting money from interest expense to net worth growth.
Advanced Concepts: Off-Balance-Sheet Liabilities and Hidden Obligations
Sophisticated financial analysis looks beyond reported balance sheet liabilities to identify hidden obligations.
Operating Leases (Historical Treatment)
Before recent accounting standard changes, companies could structure leases as “operating leases” that didn’t appear as liabilities on the balance sheet. Only the annual lease payment appeared as an expense.
This created significant off-balance-sheet financing—companies controlled assets (buildings, equipment) without recording the corresponding liabilities.
Current standards now require most leases to be capitalized, meaning:
- The right to use the asset appears as an asset
- The obligation to make lease payments appears as a liability
This change improved transparency but also increased reported liabilities for many companies.
Purchase Commitments
Long-term contracts to purchase materials, services, or products create future payment obligations that may not appear as liabilities until goods are received.
For example, airlines often commit to purchasing aircraft years in advance. These multi-billion-dollar commitments represent future liabilities not yet recorded on the balance sheet.
Joint Venture and Partnership Obligations
Investments in joint ventures may create obligations beyond the recorded investment amount, particularly if the company guarantees the venture’s debt or has committed to provide additional funding.
Environmental and Legal Contingencies
Potential environmental cleanup costs, ongoing litigation, and regulatory compliance obligations may represent significant future liabilities not yet quantified or recorded.
The 2010 Deepwater Horizon oil spill created tens of billions in liabilities for BP that weren’t on the balance sheet before the incident.
Pension and Post-Retirement Benefit Obligations
While pension liabilities appear on balance sheets, the assumptions underlying their calculation (expected returns, discount rates, longevity estimates) significantly impact reported amounts.
Small changes in assumptions can create billions in additional liabilities.
Why This Matters for Investors
Companies with substantial off-balance-sheet or contingent liabilities appear financially healthier than they actually are. Thorough analysis requires:
- Reading footnotes in financial statements where these obligations are disclosed
- Analyzing industry-specific risks (environmental for energy companies, litigation for pharmaceuticals)
- Comparing peer companies to identify outliers with unusual risk exposure
- Stress-testing scenarios where contingent liabilities materialize
Understanding these hidden obligations separates superficial analysis from deep financial due diligence.
The Future of Liability Reporting and Analysis
Financial reporting standards continue evolving to improve transparency and comparability.
Recent and Upcoming Changes
Lease Accounting Standards (ASC 842/IFRS 16):
Implemented in recent years, these standards brought most leases onto balance sheets, significantly increasing reported liabilities for retailers, airlines, and other lease-intensive businesses.
Cryptocurrency and Digital Asset Treatment:
As companies hold Bitcoin and other digital assets, accounting standards are evolving to address how related obligations (like staking commitments or DeFi protocols) should be classified.
Environmental, Social, and Governance (ESG) Liabilities:
Growing pressure exists to quantify and report environmental liabilities, carbon obligations, and social commitments in standardized formats.
Climate-Related Financial Disclosures:
Regulatory bodies increasingly require disclosure of climate-related risks that could create future liabilities (coastal property exposure, stranded assets in fossil fuel industries, transition costs).
Technology’s Impact on Liability Analysis
Automated Data Extraction:
AI and machine learning tools can now extract liability data from thousands of financial statements, enabling large-scale comparative analysis.
Real-Time Monitoring:
Rather than analyzing quarterly or annual statements, sophisticated investors can now monitor certain liability indicators (like credit default swap spreads) in real-time.
Predictive Analytics:
Machine learning models can identify patterns in liability growth, composition, and management that predict future financial distress or success.
Blockchain and Smart Contracts:
Distributed ledger technology may eventually enable real-time, transparent tracking of certain liabilities, particularly in supply chain finance and trade payables.
Implications for Financial Literacy
As reporting becomes more complex and data more abundant, financial literacy becomes increasingly valuable. Understanding fundamental concepts—what liabilities are, how they’re classified, why they matter—provides the foundation for leveraging advanced analytical tools.
The math behind money doesn’t change, but the tools for applying that math continue advancing.
Practical Action Steps: Applying Liability Knowledge
Knowledge without application provides limited value. Here’s how to use liability concepts in real financial decisions.
For Individual Investors Analyzing Stocks
Step 1: Pull the Balance Sheet
Access the company’s most recent 10-K filing (annual report) or 10-Q (quarterly report) through the SEC’s EDGAR database or the company’s investor relations website.
Step 2: Calculate Key Ratios
Compute:
- Debt-to-equity ratio
- Current ratio
- Debt ratio
- Interest coverage ratio (requires income statement data)
Step 3: Compare to Peers
Identify 3-5 competitors and calculate the same ratios. Determine whether your target company is more or less leveraged than industry norms.
Step 4: Analyze Trends
Pull balance sheets from the past 3-5 years. Are liabilities growing faster than assets? Is the current ratio improving or deteriorating?
Step 5: Read the Footnotes
Examine notes about debt covenants, lease obligations, contingent liabilities, and off-balance-sheet arrangements.
Step 6: Assess Risk
Based on your analysis, determine:
- Can the company comfortably service its debt?
- Does it have adequate liquidity for short-term obligations?
- Are liability trends improving or concerning?
- How would a recession impact the company’s ability to meet obligations?
This systematic approach transforms you from a passive stock picker to an informed analyst.
For Business Owners Managing Operations
Step 1: Create Monthly Balance Sheets
Don’t wait for annual tax preparation. Generate monthly balance sheets to track liability changes in real-time.
Step 2: Monitor Working Capital
Calculate working capital (current assets minus current liabilities) monthly. Declining working capital signals potential cash flow problems before they become crises.
Step 3: Optimize Payment Timing
Take full advantage of supplier payment terms without incurring late fees. If terms are Net 30, paying on day 30 preserves cash longer than paying on day 10.
Step 4: Negotiate Better Terms
Strong supplier relationships often enable extended payment terms (Net 60 instead of Net 30), improving cash flow without additional borrowing.
Step 5: Match Asset and Liability Duration
Finance long-term assets (equipment, real estate) with long-term liabilities. Finance short-term needs (seasonal inventory) with short-term credit lines.
Step 6: Maintain Credit Capacity
Establish credit lines before you need them. Banks prefer lending to companies that don’t desperately need money.
Step 7: Set Leverage Targets
Determine appropriate debt-to-equity and debt ratio targets for your industry and risk tolerance. Monitor actual ratios against targets quarterly.
For Individuals Managing Personal Finances
Step 1: Create a Personal Balance Sheet
List all assets (what you own) and liabilities (what you owe). Calculate net worth.
Step 2: Track Net Worth Quarterly
Update your personal balance sheet every three months. Consistent net worth growth indicates financial progress.
Step 3: Calculate Personal Debt Ratios
Compute your debt-to-income ratio and credit utilization ratio. If either exceeds healthy benchmarks, create a reduction plan.
Step 4: Prioritize Liability Reduction
List all debts with interest rates. Focus extra payments on the highest-interest obligations while making minimum payments on others.
Step 5: Avoid New Bad Debt
Before taking on new liabilities, ask:
- Will this create future value or fund current consumption?
- Can I comfortably afford the payments from my current income?
- What’s the true total cost, including all interest?
- Are there lower-cost alternatives?
Step 6: Build Emergency Reserves
Maintain 3-6 months of expenses in accessible savings. This prevents forcing you to take on high-interest debt during emergencies.
Step 7: Optimize Good Debt
Consider refinancing mortgages or student loans if interest rates have dropped significantly. Even a 1% rate reduction on a $300,000 mortgage saves thousands over the loan term.
Conclusion: Mastering the Math Behind What You Owe
Liabilities represent one-half of the fundamental equation governing all financial positions: Assets = Liabilities + Equity.
Understanding this relationship, truly comprehending what liabilities are, how they’re classified, why they matter, and how to analyze them, transforms financial decision-making from guesswork to evidence-based strategy.
The core insights to remember:
Liabilities are obligations arising from past events requiring future payment. They’re not inherently good or bad; their value depends entirely on how they’re used and managed.
Classification matters. Current liabilities create immediate liquidity demands, while long-term liabilities represent extended commitments. Both require different management approaches.
Ratios provide context. Raw numbers mean little without comparison to assets, equity, cash flow, and industry benchmarks. Debt-to-equity, current ratio, and debt ratio transform data into actionable insights.
Trends reveal trajectory. A single balance sheet shows the position at one moment. Comparing multiple periods reveals whether financial health is improving or deteriorating.
Strategic use creates value. Liabilities that fund investments generating returns exceeding their cost build wealth. Liabilities funding consumption or investments with inadequate returns destroys value.
Hidden obligations exist. Thorough analysis looks beyond balance sheet liabilities to identify contingent obligations, off-balance-sheet commitments, and industry-specific risks.
The same principles apply universally. Whether analyzing a Fortune 500 company or managing personal finances, understanding liabilities enables better decisions.
Your next steps:
If you’re an investor, pull the balance sheet of a company you own or are considering. Calculate the key ratios discussed in this guide. Compare them to competitors. Read the footnotes about debt obligations and contingent liabilities.
If you’re a business owner, schedule time this week to review your current liabilities. Calculate your current ratio and working capital. Identify opportunities to optimize payment timing or negotiate better terms.
If you’re managing personal finances, create your personal balance sheet. Calculate your net worth and debt-to-income ratio. If you have high-interest debt, create a specific reduction plan using the 50/30/20 budgeting framework.
Understanding liabilities isn’t about memorizing accounting rules; it’s about comprehending the cause-and-effect relationships between borrowing, investing, and wealth building. It’s about seeing through the numbers to the underlying economic reality.
This is the math behind money. These are the data-driven insights that separate informed financial participants from those making decisions based on hope or guesswork.
Master these concepts, and you’ll make better investment choices, build stronger businesses, and achieve greater financial security. The numbers don’t lie; they reveal truth to those who understand their language.
📊 Liability Ratio Calculator
Analyze financial health with key liability ratios
• Debt-to-Equity: Below 1.0 = conservative, 1.0-2.0 = moderate, above 2.0 = high leverage
• Debt Ratio: Below 40% = low risk, 40-60% = moderate, above 60% = higher risk
• Current Ratio: Below 1.0 = liquidity concerns, 1.0-2.0 = healthy, above 2.0 = very strong
Sources
[1] Financial Accounting Standards Board (FASB). “Conceptual Framework for Financial Reporting.” FASB.org.
[2] International Accounting Standards Board (IASB). “IAS 1 – Presentation of Financial Statements.” IFRS.org.
[3] U.S. Securities and Exchange Commission. “Beginners’ Guide to Financial Statements.” SEC.gov.
[4] CFA Institute. “Corporate Finance and Portfolio Management.” CFA Program Curriculum, 2025.
Author Bio
Max Fonji is the founder of The Rich Guy Math, a data-driven financial education platform dedicated to explaining the math behind money. With expertise in economic analysis, valuation principles, and evidence-based investing, Max translates complex financial concepts into clear, actionable insights for investors and financial learners. His analytical approach combines rigorous quantitative methods with accessible teaching, empowering readers to make informed decisions based on data rather than speculation.
Educational Disclaimer
This article is provided for educational and informational purposes only and does not constitute financial, investment, legal, or tax advice. The information presented represents general principles of financial analysis and should not be considered personalized recommendations for any specific individual or entity.
Financial ratios and analytical techniques discussed are tools for understanding financial statements, but they do not guarantee investment success or predict future performance. All investments carry risk, including potential loss of principal.
Before making any financial decisions, consult with qualified financial advisors, accountants, or other professionals who can evaluate your specific circumstances, goals, and risk tolerance. Past performance does not guarantee future results.
The Rich Guy Math and its authors are not liable for any financial decisions made based on this content. Always conduct thorough due diligence and seek professional guidance appropriate to your situation.
Frequently Asked Questions (FAQ)
What is the difference between liabilities and expenses?
Liabilities are obligations to pay in the future that appear on the balance sheet, while expenses are costs incurred during a period that appear on the income statement. An expense becomes a liability when it’s incurred but not yet paid, such as accrued wages.
Are all liabilities bad for a company?
No. Liabilities can be strategic financial tools. Debt used to fund profitable projects or growth initiatives can increase returns. The key question is whether the returns generated exceed the cost of the liability.
How do I know if a company has too much debt?
Review key ratios such as the debt-to-equity ratio (total liabilities compared to equity), the debt ratio (liabilities as a percentage of assets), and the interest coverage ratio (ability to pay interest using operating income). Compare these ratios to industry peers and historical company trends.
What’s the difference between current and non-current liabilities?
Current liabilities are obligations due within 12 months, such as accounts payable and short-term loans. Non-current liabilities are obligations due beyond one year, such as long-term debt and bonds payable. This distinction helps investors understand short-term liquidity versus long-term financial structure.
Why do companies have unearned revenue as a liability?
When a company receives payment before delivering goods or services, it has an obligation to fulfill in the future. This creates a liability because the company owes the customer either the product/service or a refund if it cannot deliver.
What is a good current ratio?
A current ratio between 1.0 and 2.0 typically indicates healthy liquidity. Ratios below 1.0 suggest potential difficulty meeting short-term obligations, while ratios above 2.0 may signal that the company is holding too many idle current assets instead of using them efficiently.
How do contingent liabilities affect financial analysis?
Contingent liabilities represent potential future obligations that depend on uncertain events, such as lawsuits. They generally do not appear on the balance sheet unless the obligation is probable and can be reasonably estimated. However, they represent hidden risks that investors should evaluate.
Should I pay off all debt before investing?
Not always. Low-interest debt—such as a 3% mortgage—may be worth keeping if you can earn higher returns through investing, such as 7–10% in diversified portfolios. However, high-interest debt like credit cards (18–24%) should be prioritized for payoff because the guaranteed savings exceed most investment returns.
