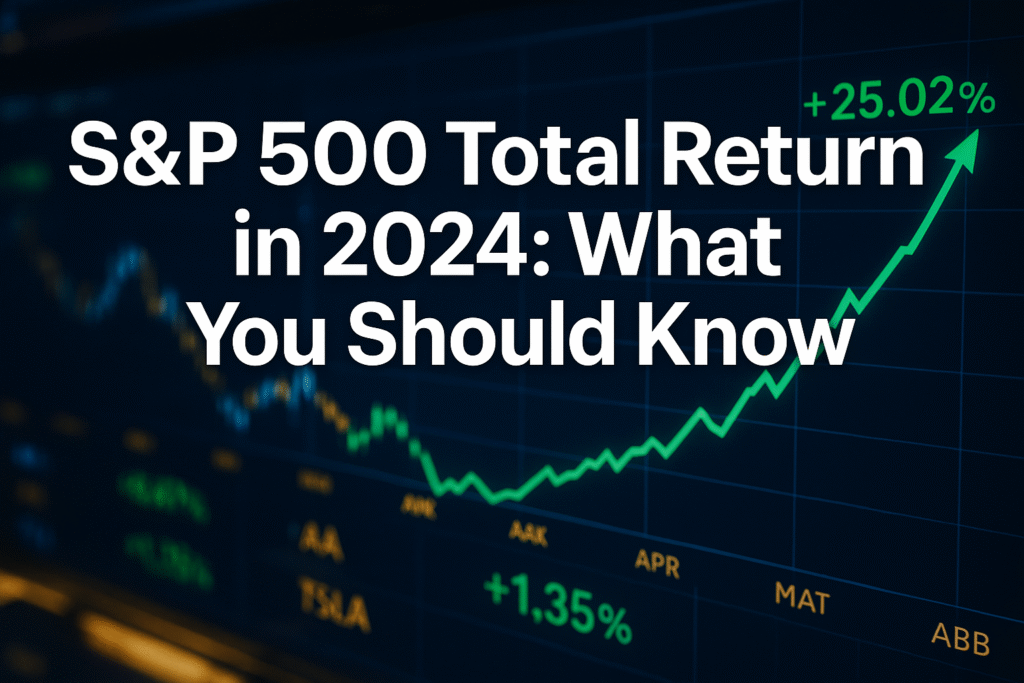
The year 2024 delivered a powerful reminder of why long-term investors trust the S&P 500. With a total return of 25.02%, the index proved once again that patient, evidence-based investing rewards those who understand the math behind money.
The S&P 500 Total Return in 2024 represents more than just a number on a screen. It captures the combined effect of price appreciation and reinvested dividends across 500 of America’s largest companies. This comprehensive measure tells the complete story of investor returns, a story that price-only metrics miss entirely.
For investors seeking to build wealth through proven strategies, understanding total return mechanics separates informed decision-making from speculation. The difference between a 23% price gain and a 25.02% total return might seem small, but over decades, that gap compounds into hundreds of thousands of dollars.
This guide breaks down the S&P 500 Total Return in 2024 with precision, clarity, and actionable insights. By the end, readers will understand not just what happened, but why it matters for their financial future.
Key Takeaways
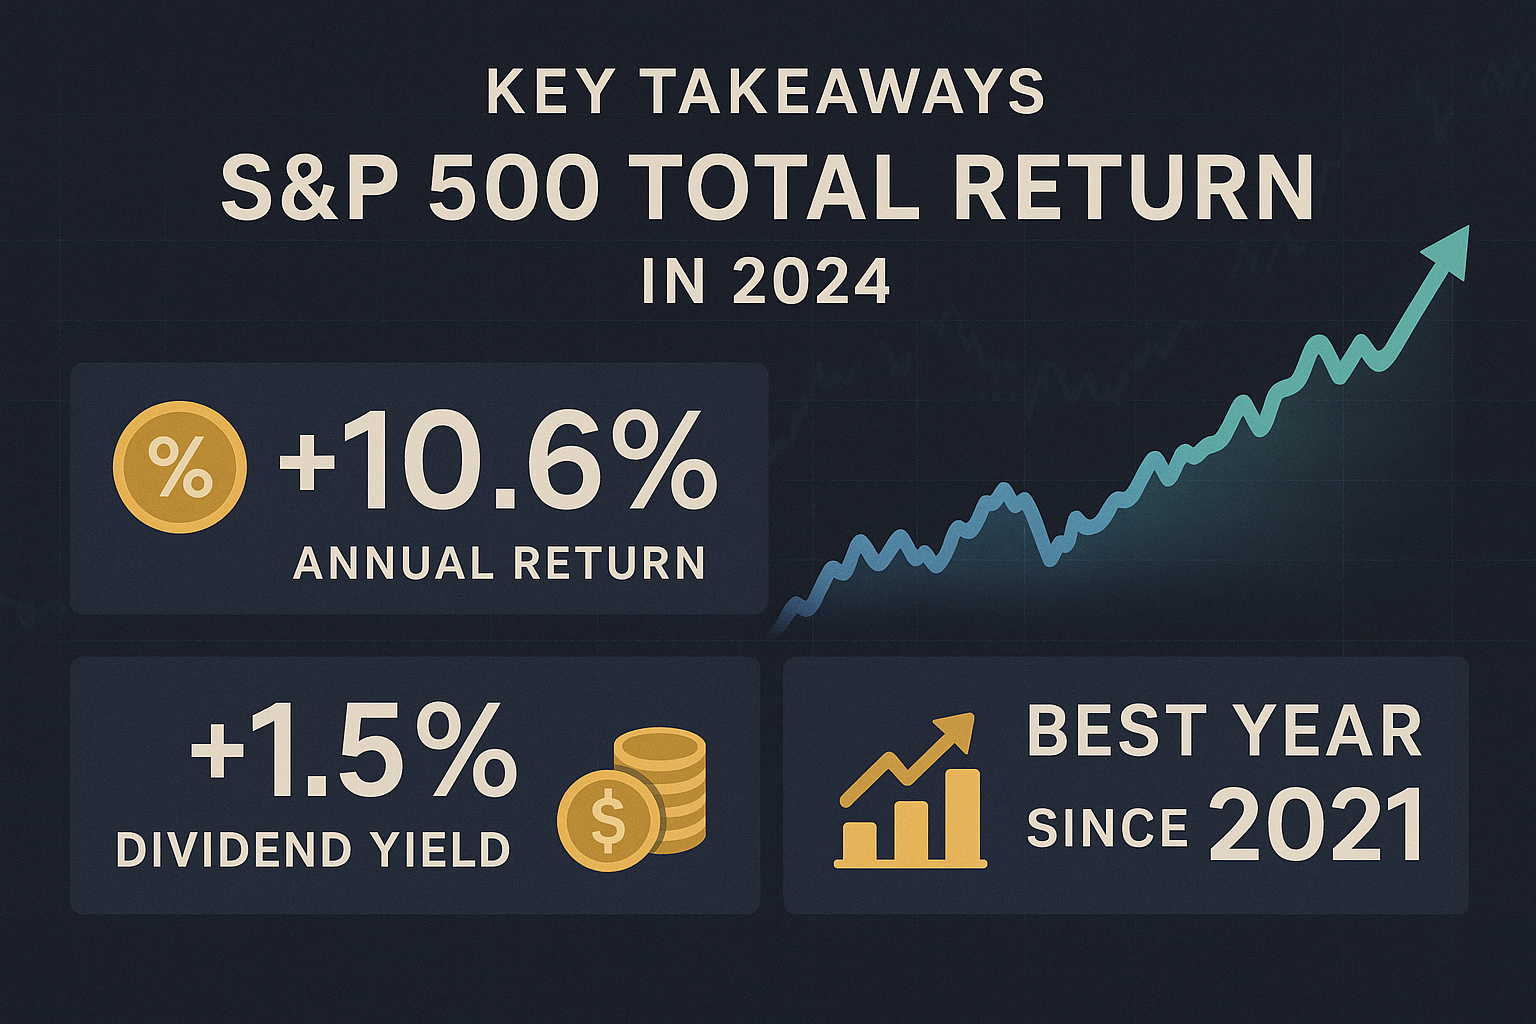
- The S&P 500 delivered a 25.02% total return in 2024, marking the second consecutive year of 25%+ gains and demonstrating exceptional market strength
- Total return includes both price appreciation and reinvested dividends, providing a more accurate measure of actual investor returns than price-only metrics
- 2024’s performance exceeded long-term averages, surpassing the historical annual average of 10.38% and the five-year average of 15.13%
- Historical data shows the S&P 500 posted positive returns in 78% of years between 1993 and 2024, reinforcing the index’s reliability for long-term wealth building
- Understanding total return methodology is essential for making informed investment decisions and accurately measuring portfolio performance
What Is Total Return and Why Does It Matter
Total return measures the complete performance of an investment over a specific period. Unlike price return, which only tracks share price changes, total return accounts for all sources of investor gains.
The calculation includes two components: capital appreciation (price changes) and income distributions (dividends). For the S&P 500, this means tracking both the index’s price movement and the dividends paid by the 500 constituent companies.
The Math Behind Total Return
The formula is straightforward:
Total Return = (Ending Value – Beginning Value + Dividends) / Beginning Value × 100
For the S&P 500 in 2024, this calculation captured the 25.02% gain that investors actually experienced when dividends were reinvested. The price-only return was approximately 23%, meaning dividends contributed roughly 2 percentage points to the total return.
This difference compounds significantly over time. A $10,000 investment tracking only price appreciation would have grown to approximately $12,300. The same investment tracking total return would have reached $12,502, an extra $202 in a single year.
Over the decades, this gap has become substantial. Since 1926, dividends have accounted for approximately 40% of the S&P 500’s total return, transforming what would have been solid gains into generational wealth.
Why Price-Only Metrics Mislead Investors
Many financial headlines report the S&P 500’s price movements without mentioning dividends. This creates a distorted picture of actual investor returns.
Consider an investor who purchased an S&P 500 index fund in January 2024. If they only tracked the index’s price level, they would underestimate their actual gains by approximately 2 percentage points. For a $100,000 portfolio, that’s a $2,000 discrepancy.
The misleading nature of price-only reporting becomes more pronounced during periods when dividend yields are higher. In market environments where the S&P 500 yields 2-3%, ignoring dividends means missing 20-30% of the total return story.
Takeaway: Total return provides the complete picture of investment performance. For accurate wealth tracking and informed decision-making, investors must measure total return, not just price changes.
Understanding absolute return metrics helps investors distinguish between different performance measurement approaches and choose the most appropriate benchmarks for their portfolios.
S&P 500 Total Return in 2024: The Complete Performance Picture
The S&P 500 Total Return in 2024 of 25.02% represents exceptional performance by historical standards. This gain placed 2024 among the top-performing years of the past decade and demonstrated the index’s continued strength.
Breaking Down the 25.02% Return
The 25.02% total return consisted of approximately 23% price appreciation and 2% from reinvested dividends. This breakdown reveals how both components contributed to investor wealth.
The price appreciation reflected broad-based gains across the 500 companies in the index. Technology, financials, and communication services sectors led performance, while energy and utilities lagged. This sector rotation pattern is typical of strong market years.
Dividend contributions remained consistent with historical patterns. The S&P 500’s dividend yield averaged approximately 1.5-1.7% during 2024, with quarterly distributions reinvested automatically in total return calculations.
Historical Context: How 2024 Compares
Placing 2024’s performance in historical context reveals its significance:
| Year | Total Return | Context |
|---|---|---|
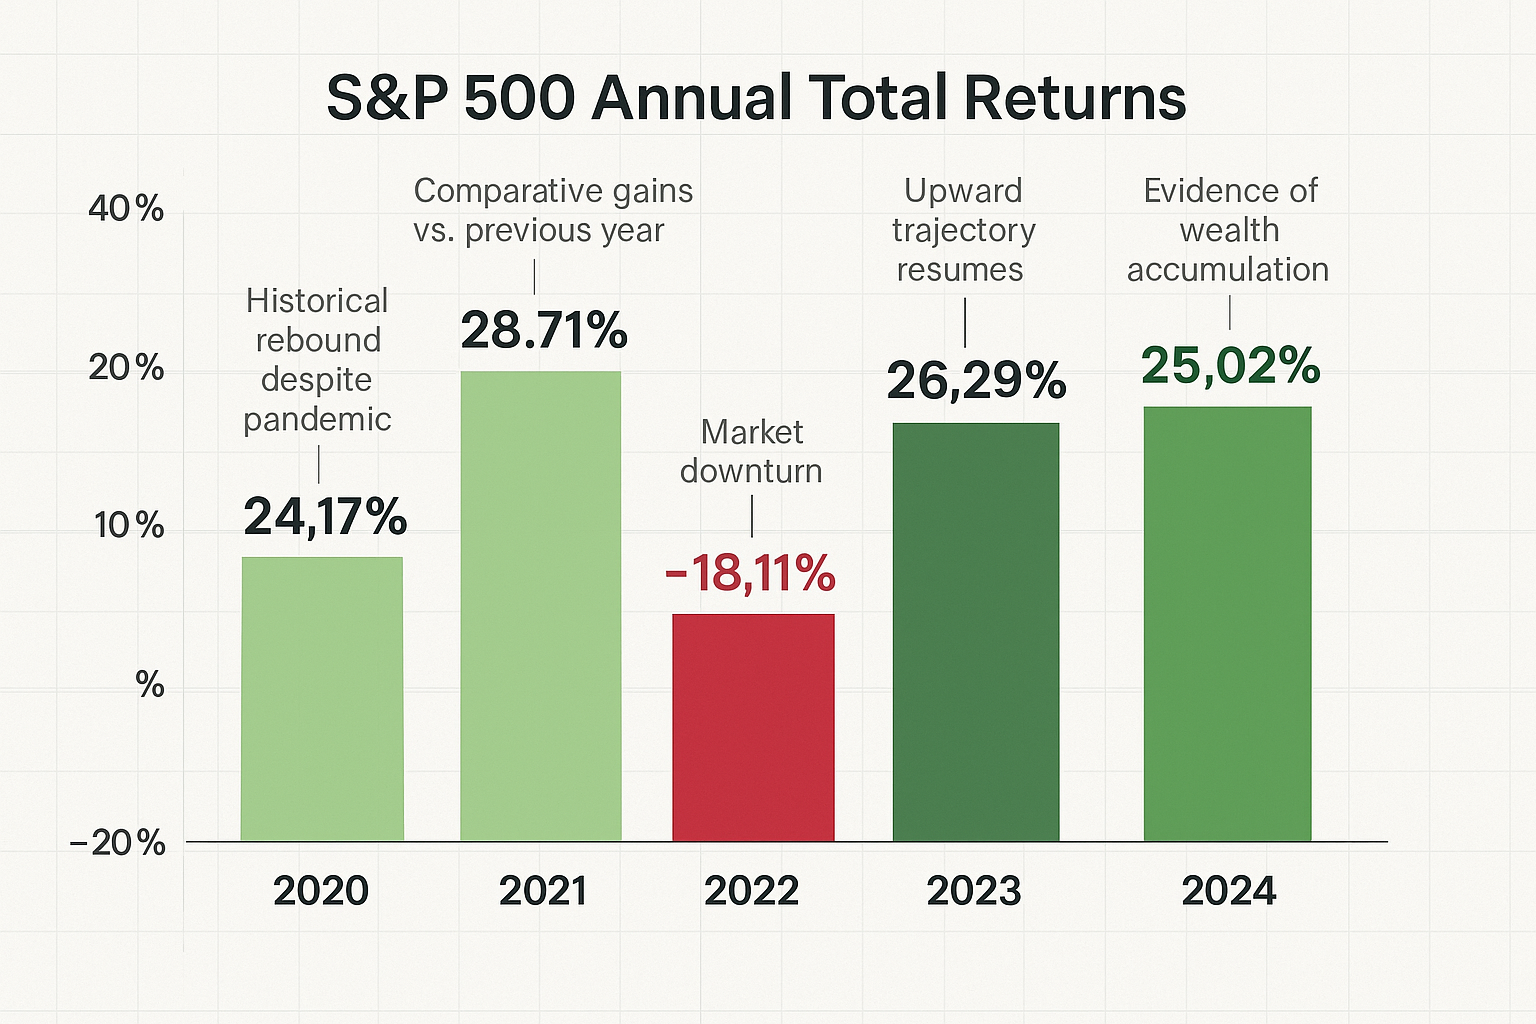
| 2020 | 24.17% | Pandemic recovery year |
| 2021 | 28.71% | Peak stimulus environment |
| 2022 | -18.11% | Bear market decline |
| 2023 | 26.29% | Strong recovery year |
| 2024 | 25.02% | Sustained momentum |
The 2024 return marked the second consecutive year of 25%+ gains, a relatively rare occurrence. Since 1926, the S&P 500 has achieved back-to-back years of 25%+ returns only a handful of times.
This exceptional two-year performance (2023-2024) delivered cumulative returns exceeding 58%, transforming a $100,000 investment into approximately $158,000 before taxes.
Compared to Long-Term Averages
The S&P 500 Total Return in 2024 significantly exceeded long-term averages:
- 10-year average (2015-2024): Approximately 12-13% annualized
- 20-year average: Approximately 10% annualized
- Since 1926, average: 10.38% annualized
The 2024 return of 25.02% was more than double the historical average. This outperformance reminds investors that annual returns vary widely around the long-term mean.
Understanding annualized return calculations helps investors accurately compare performance across different time periods and make informed allocation decisions.
What Drove 2024’s Strong Performance
Several factors contributed to the exceptional S&P 500 Total Return in 2024:
Corporate earnings growth: S&P 500 companies delivered solid earnings growth, with many exceeding analyst expectations. Revenue growth remained positive across most sectors.
Valuation expansion: Price-to-earnings ratios expanded modestly as investor confidence improved. This multiple expansion added to price appreciation beyond earnings growth alone.
Economic resilience: The U.S. economy avoided recession despite elevated interest rates. GDP growth remained positive, unemployment stayed low, and consumer spending held steady.
Technology leadership: Large-cap technology companies continued driving index performance, benefiting from artificial intelligence trends and digital transformation spending.
Monetary policy expectations: Market expectations for eventual Federal Reserve rate cuts supported equity valuations, even as rates remained elevated through most of 2024.
These factors combined to create an environment conducive to strong equity returns, demonstrating how multiple variables influence market performance simultaneously.
The Power of Dividend Reinvestment in Total Returns
Dividend reinvestment transforms good returns into exceptional long-term wealth accumulation. The S&P 500’s total return methodology automatically assumes dividends are reinvested, capturing the compound growth effect that separates wealth builders from casual investors.
How Reinvestment Amplifies Returns
When dividends are reinvested, they purchase additional shares. These new shares generate their own dividends, which purchase even more shares. This creates a compounding loop that accelerates wealth accumulation over time.
Consider a simplified example:
Year 1: $10,000 investment generates $200 in dividends (2% yield). Reinvesting purchases $200 in additional shares, bringing the total value to $10,200.
Year 2: The $10,200 generates $204 in dividends. Reinvesting brings the total to $10,404.
Year 3: The $10,404 generates $208 in dividends. The pattern continues, with each year’s dividend base growing larger.
This compounding effect becomes exponential over decades. A $10,000 investment in the S&P 500 in 1994 with dividends reinvested would have grown to approximately $100,000 by 2024. The same investment without dividend reinvestment would have reached only about $70,000.
The difference, $30,000 on a $10,000 investment, represents the power of dividend reinvestment. That’s a 300% improvement in total wealth from simply reinvesting distributions.
Historical Impact of Dividends on S&P 500 Returns
Historical data reveal dividends’ substantial contribution to long-term S&P 500 returns:
- Since 1926, Dividends have contributed approximately 40% of total returns
- During bear markets, Dividend reinvestment purchases shares at lower prices, accelerating recovery gains
- In low-growth periods, Dividends provide positive returns even when prices stagnate
The 1970s exemplify dividends’ importance. The S&P 500’s price return was nearly flat for the decade, but total return (including dividends) was positive. Investors who reinvested dividends maintained purchasing power despite challenging market conditions.
More recently, dividend contributions have been smaller as yields declined from historical averages. However, even a 2% annual dividend contribution compounds to significant wealth over 20-30 year periods.
Understanding dividend reinvestment strategies helps investors maximize the compound growth potential of their portfolios and build wealth more efficiently.
Calculating the Dividend Effect in 2024
In 2024, dividends contributed approximately 2 percentage points to the 25.02% total return. While this seems modest, it represents about 8% of the total gain.
For a $100,000 portfolio, this 2% dividend contribution added $2,000 to returns. Over a 30-year investing career, assuming similar dividend contributions, this would compound to hundreds of thousands of dollars in additional wealth.
The mathematical reality is clear: ignoring dividends means ignoring a substantial portion of long-term wealth creation.
Investors who track only price movements systematically underestimate their actual returns and may make suboptimal allocation decisions based on incomplete data.
Insight: Dividend reinvestment isn’t optional for maximizing long-term returns; it’s essential. Total return metrics capture this reality, while price-only metrics miss it entirely.
For investors interested in maximizing dividend income, exploring the best dividend ETF options can provide diversified exposure to high-quality dividend-paying companies.
Long-Term Performance: What History Teaches Us
The S&P 500 Total Return in 2024 represents a single data point in a nearly century-long track record. Understanding this historical context transforms how investors think about market volatility, risk, and wealth building.
The 100-Year Track Record
Since 1926, the S&P 500 has delivered an average annual nominal return of 10.38%. Adjusted for inflation, this becomes approximately 7.20% in real terms.
This consistency across nearly a century of economic cycles, wars, recessions, technological revolutions, and political changes demonstrates the index’s remarkable resilience.
A hypothetical $100 invested in 1926 would have grown to approximately $1,866,511.71 by 2025 in nominal terms. Adjusted for inflation, that same $100 would be worth approximately $101,879.86 in 1926 dollars, a real purchasing power increase of more than 1,000-fold.
These numbers aren’t theoretical. They represent actual returns available to investors who maintained diversified exposure to large-cap U.S. equities through all market conditions.
Positive Return Frequency
Between 1993 and 2024, the S&P 500 posted positive annual returns in 25 out of 32 years, a 78% success rate.
This frequency provides important context for risk assessment:
- Positive years (25): Returns ranged from modest single digits to exceptional 25%+ gains
- Negative years (7): Declines ranged from minor corrections to the 2022 bear market’s -18.11%
The 78% positive year frequency suggests that time in the market favors investors. Any given year has better than 3-in-4 odds of positive returns, though the magnitude varies significantly.
This statistical reality supports long-term buy-and-hold strategies over market timing attempts. Investors who remained invested through all 32 years captured the full compound return, while those who exited during negative years often missed subsequent recovery gains.
Volatility and Recovery Patterns
Market history reveals consistent patterns of decline and recovery:
2000-2002 Dot-com crash: The S&P 500 declined approximately 49% from peak to trough, then recovered to new highs by 2007.
2007-2009 Financial crisis: The index fell approximately 57% from peak to trough, then recovered to new highs by 2013.
2020 Pandemic crash: The S&P 500 dropped 34% in five weeks, then recovered to new highs within six months.
2022 Bear market: The index declined 18.11%, then posted 26.29% gains in 2023 and 25.02% in 2024.
Each decline felt catastrophic in the moment. Each recovery created new wealth for investors who maintained their positions.
The mathematical reality: every historical decline has been temporary; the long-term upward trajectory has been permanent.
This pattern doesn’t guarantee future results, but it provides evidence-based context for managing emotional responses during market volatility.
Understanding the cycle of market emotions helps investors maintain discipline during periods of volatility and avoid costly emotional decisions.
The Inflation-Adjusted Reality
Nominal returns tell only part of the story. Inflation erodes purchasing power, making inflation-adjusted returns the true measure of wealth creation.
The S&P 500’s inflation-adjusted return of 7.20% annually since 1926 represents real wealth accumulation. This means purchasing power doubled approximately every 10 years, a powerful wealth-buildingThe Real Math Behind Building Wealth in Your 20s engine.
In 2024, with inflation moderating from 2022-2023 peaks, the 25.02% nominal return translated to approximately 22-23% in real terms, depending on the specific inflation measure used.
This inflation-adjusted perspective is critical for retirement planning and long-term financial goals. A portfolio must grow faster than inflation to maintain and increase purchasing power over time.
Takeaway: Historical data provides evidence, not guarantees. However, the S&P 500’s century-long track record demonstrates consistent wealth creation through economic cycles, making it a foundational element of evidence-based investing strategies.
How Total Return Affects Your Investment Strategy
Understanding the S&P 500 Total Return in 2024 and its historical context should directly influence investment decisions. The math behind total returns reveals specific strategic implications for portfolio construction and wealth building.
Index Funds vs. Individual Stocks
The S&P 500’s consistent total returns make index funds compelling for most investors:
Diversification benefit: A single S&P 500 index fund provides exposure to 500 companies across 11 sectors, eliminating company-specific risk.
Cost efficiency: Index funds typically charge expense ratios of 0.03-0.20%, compared to 0.50-2.00% for actively managed funds.
Tax efficiency: Low turnover minimizes capital gains distributions, reducing tax drag on returns.
Performance consistency: The S&P 500’s 25.02% total return in 2024 was available to every index fund investor, regardless of stock-picking skill.
Individual stock selection requires substantial research, monitoring, and risk tolerance. For investors without the time, expertise, or inclination for active management, S&P 500 index funds capture market returns with minimal effort.
The comparison between ETFs vs individual stocks helps investors understand the tradeoffs between diversification and concentration in portfolio construction.
Dollar-Cost Averaging and Market Timing
The S&P 500 Total Return in 2024 of 25.02% might tempt investors to time market entry points. Historical evidence suggests a different approach works better.
Dollar-cost averaging involves investing fixed amounts at regular intervals regardless of market conditions. This strategy:
- Removes emotion from investment decisions
- Purchases more shares when prices are low
- Purchases fewer shares when prices are high
- Averages out the entry prices over time
A hypothetical investor who dollar-cost averaged $1,000 monthly into an S&P 500 index fund throughout 2024 would have invested $12,000 and ended the year with approximately $13,000-$13,500, depending on monthly timing.
This compares favorably to attempting to time a perfect entry point, which requires correctly predicting both when to enter and when to exit—a consistent challenge even for professional investors.
The dollar-cost averaging guide provides detailed strategies for implementing systematic investment plans that remove emotion from the process.
Rebalancing and Portfolio Maintenance
Strong years like 2024 create portfolio drift. If an investor began 2024 with a 60% stock / 40% bond allocation, the 25.02% equity return likely pushed their allocation to approximately 65% stocks / 35% bonds by year-end.
Rebalancing restores the target allocation by:
- Selling appreciated assets (stocks)
- Buying underperforming assets (bonds)
- Maintaining the desired risk profile
This “sell high, buy low” discipline is counterintuitive but mathematically sound. It prevents excessive concentration in outperforming assets and maintains consistent risk exposure.
Annual or semi-annual rebalancing typically provides the best balance between maintaining target allocations and minimizing transaction costs and tax consequences.
Tax Considerations for Total Returns
Total returns include both capital appreciation and dividends, each taxed differently:
Qualified dividends: Taxed at preferential long-term capital gains rates (0%, 15%, or 20% depending on income)
Capital gains (unrealized): Not taxed until shares are sold
Capital gains (realized): Taxed at short-term (ordinary income) or long-term (preferential) rates depending on holding period
For taxable accounts, tax-efficient fund placement matters:
- Tax-advantaged accounts (401k, IRA): Hold tax-inefficient assets like actively managed funds or REITs
- Taxable accounts: Hold tax-efficient assets like S&P 500 index funds
Understanding capital gains tax implications helps investors structure portfolios to minimize tax drag and maximize after-tax returns.
The difference between pre-tax and after-tax returns compounds significantly over decades. A 25% total return might become 20% after-tax, depending on individual circumstances. Over 30 years, this 5-percentage-point difference transforms into hundreds of thousands of dollars in wealth.
Insight: Total return data should inform strategic decisions about fund selection, contribution timing, rebalancing, and tax management. These decisions compound into substantial wealth differences over investing lifetimes.
What 2024’s Performance Means for 2025 and Beyond
The S&P 500 Total Return in 2024 of 25.02% provides context for forward-looking expectations, though past performance never guarantees future results. Understanding what drives returns helps investors form realistic expectations.
Mean Reversion vs. Momentum
Financial markets exhibit both mean reversion (tendency to return to long-term averages) and momentum (tendency for trends to continue). These opposing forces create uncertainty about short-term outcomes.
Mean reversion perspective: The S&P 500’s 10.38% long-term average suggests that exceptional years like 2024 often precede below-average years. After two consecutive 25%+ return years (2023-2024), mathematical probability suggests returns closer to historical averages in subsequent years.
Momentum perspective: Strong market years sometimes cluster together, as occurred in the 1990s. Positive economic fundamentals and corporate earnings growth can sustain above-average returns for extended periods.
Historical data shows that both patterns exist. The 1990s delivered seven consecutive years of 20%+ returns. Conversely, the 2000s delivered a “lost decade” with near-zero returns after the 1990s boom.
Prudent investors prepare for both scenarios by maintaining diversified portfolios aligned with long-term goals rather than short-term predictions.
Setting Realistic Return Expectations
Using 2024’s 25.02% return as a baseline for future expectations creates unrealistic projections. More realistic approaches include:
Historical average method: Assume 10-11% annual returns based on the 1926-2025 average. This conservative approach accounts for both strong and weak years.
Inflation-plus method: Assume 7-8% real returns plus expected inflation (2-3%), yielding 9-11% nominal returns.
Valuation-adjusted method: Consider current price-to-earnings ratios, dividend yields, and earnings growth expectations to estimate forward returns.
Most financial planning professionals recommend using 7-10% annual return assumptions for long-term S&P 500 projections. This range accounts for uncertainty while remaining grounded in historical evidence.
A $100,000 portfolio growing at 8% annually would reach approximately $1,006,000 in 30 years. The same portfolio growing at 12% would reach approximately $2,996,000. This massive difference illustrates why realistic assumptions matter for retirement planning.
For investors planning retirement withdrawals, understanding the 4% rule helps determine sustainable spending rates based on historical return patterns.
Early 2025 Performance Context
Through November 17, 2025, the S&P 500 posted a year-to-date total return of 15.77%, building on 2024’s foundation. This strong start to 2025 demonstrates continued market momentum.
However, nearly 11 months of performance doesn’t guarantee full-year results. Market conditions can change rapidly based on economic data, corporate earnings, geopolitical events, or monetary policy shifts.
The 15.77% return through mid-November 2025 already exceeds the historical annual average, suggesting 2025 may deliver another above-average year. Alternatively, a late-year correction could moderate full-year returns.
This uncertainty reinforces the importance of staying invested through market fluctuations rather than attempting to time entries and exits.
Building a Resilient Long-Term Strategy
The S&P 500 Total Return in 2024 and subsequent 2025 performance demonstrate key principles for resilient investing:
1. Maintain consistent contributions: Regular investments through all market conditions capture both highs and lows.
2. Reinvest dividends automatically: Compounding accelerates wealth accumulation over decades.
3. Minimize costs: Low expense ratios preserve more returns for investors.
4. Ignore short-term noise: Daily, weekly, and monthly fluctuations are irrelevant to 20-30 year outcomes.
5. Rebalance periodically: Maintain target allocations to manage risk appropriately.
6. Think in decades, not days: Wealth building requires patience and discipline, not prediction and timing.
These principles, applied consistently, transform market returns into personal wealth regardless of specific annual outcomes.
Understanding diversification investing strategies helps investors build resilient portfolios that weather various market conditions.
Takeaway: Use 2024’s exceptional performance as motivation to maintain long-term discipline, not as a baseline for future expectations. Historical averages provide more reliable planning assumptions than recent results.
Common Mistakes When Interpreting Total Returns
Understanding the S&P 500 Total Return in 2024 requires avoiding common misinterpretations that lead to poor investment decisions. These mistakes cost investors substantial wealth over time.
Mistake #1: Confusing Total Return with Guaranteed Returns
The S&P 500’s 25.02% total return in 2024 represents what happened, not what will happen. Some investors incorrectly assume historical returns predict future results with certainty.
Reality: Returns vary significantly year to year. The S&P 500 has delivered negative returns in approximately 22% of years since 1926. Any single year can produce losses regardless of historical averages.
Correction: Use historical returns as probability guides, not guarantees. Build portfolios that can withstand negative years without forcing premature liquidation.
Mistake #2: Ignoring Inflation’s Impact
Nominal returns of 25.02% sound impressive, but inflation erodes purchasing power. In 2024, with inflation moderating to approximately 2-3%, real returns were approximately 22-23%.
During high-inflation periods, this gap widens significantly. A 25% nominal return with 8% inflation produces only 17% real return, the actual increase in purchasing power.
Correction: Always consider inflation-adjusted returns when evaluating long-term wealth accumulation and retirement planning. Real returns determine actual purchasing power growth.
Mistake #3: Comparing Apples to Oranges
Investors sometimes compare their portfolio returns to the S&P 500 total return without accounting for differences:
- Asset allocation: A 60/40 portfolio will underperform the S&P 500 in strong equity years by design
- International exposure: Global diversification creates different return patterns
- Sector tilts: Overweighting specific sectors changes risk and return profiles
- Costs: Expense ratios, advisory fees, and trading costs reduce net returns
Correction: Compare portfolio returns to appropriate benchmarks that reflect actual asset allocation and investment strategy.
Mistake #4: Chasing Recent Performance
The S&P 500 Total Return in 2024 might tempt investors to shift allocations heavily toward U.S. large-cap stocks. This “performance chasing” typically backfires.
Historical evidence shows asset classes rotate leadership. The best-performing asset class in one period often underperforms in the next. Investors who chase recent winners consistently buy high and sell low.
Correction: Maintain strategic asset allocation based on long-term goals and risk tolerance, not recent performance. Rebalancing forces buying underperformers and selling outperformers, the opposite of performance chasing.
Mistake #5: Overlooking Sequence of Returns Risk
A 10% average return over 30 years produces vastly different outcomes depending on when specific returns occur:
Scenario A: Strong returns early, weak returns late
Scenario B: Weak returns early, strong returns late
For accumulation (contributing regularly), Scenario B produces better outcomes because contributions buy more shares during weak periods.
For distribution (withdrawing in retirement), Scenario A produces better outcomes because the portfolio isn’t depleted during weak early years.
Correction: Understand that average returns don’t tell the complete story. Sequence matters, especially near retirement. Building adequate cash reserves and maintaining appropriate equity exposure helps manage sequence risk.
Understanding the expected return concept helps investors form realistic expectations based on probability distributions rather than single-point estimates.
Mistake #6: Failing to Account for Taxes
The 25.02% total return is pre-tax. Actual investor returns depend on account type and tax situation:
- Tax-advantaged accounts (401k, IRA): Full 25.02% compounds tax-deferred
- Taxable accounts: Dividends incur annual taxes; capital gains are taxed when realized
A 25.02% pre-tax return might become 20-22% after-tax in taxable accounts, depending on individual circumstances. Over decades, this difference compounds into hundreds of thousands of dollars.
Correction: Consider after-tax returns when evaluating investment performance and making allocation decisions. Maximize use of tax-advantaged accounts before investing in taxable accounts.
Insight: Avoiding these common mistakes requires understanding the nuances of total return calculations, inflation adjustments, tax implications, and risk management. Education and discipline separate successful long-term investors from those who underperform despite strong market returns.
Practical Steps: How to Invest in S&P 500 Total Return
Understanding the S&P 500 Total Return in 2024 is valuable only when translated into action. These practical steps help investors capture S&P 500 returns efficiently and cost-effectively.
Step 1: Choose the Right Investment Vehicle
Several options provide S&P 500 exposure with automatic dividend reinvestment:
Index mutual funds:
- Vanguard 500 Index Fund (VFIAX): 0.04% expense ratio
- Fidelity 500 Index Fund (FXAIX): 0.015% expense ratio
- Schwab S&P 500 Index Fund (SWPPX): 0.02% expense ratio
Exchange-traded funds (ETFs):
- SPDR S&P 500 ETF Trust (SPY): 0.0945% expense ratio
- iShares Core S&P 500 ETF (IVV): 0.03% expense ratio
- Vanguard S&P 500 ETF (VOO): 0.03% expense ratio
All these options track the same index and deliver nearly identical returns. The primary differences are expense ratios and minimum investment requirements.
Selection criteria:
- Expense ratio: Lower is better; even 0.05% differences compound significantly over decades
- Minimum investment: Mutual funds often require $1,000-$3,000 minimums; ETFs require only the price of one share
- Account type: Some 401(k) plans offer only mutual funds; brokerage accounts offer both options
Exploring the best index funds helps investors compare options and select the most appropriate vehicles for their circumstances.
Step 2: Set Up Automatic Dividend Reinvestment
Most brokerages offer dividend reinvestment programs (DRIPs) that automatically purchase additional shares when dividends are paid. This feature is essential for capturing total returns.
To enable DRIP:
- Log in to your brokerage account
- Navigate to account settings or dividend preferences
- Select “reinvest dividends automatically” for S&P 500 holdings
- Confirm the setting applies to future dividend payments
Automatic reinvestment eliminates the temptation to spend dividends and ensures every distribution purchases additional shares, maximizing compound growth.
Step 3: Implement a Systematic Investment Plan
Consistent contributions matter more than perfect timing. A systematic investment plan removes emotion from the process.
Monthly contribution example:
- Determine affordable monthly amount ($100, $500, $1,000, etc.)
- Set up an automatic transfer from checking to the investment account
- Configure automatic purchase of the S&P 500 fund on a specific date each month
- Maintain contributions regardless of market conditions
This approach implements dollar-cost averaging automatically, purchasing more shares when prices are low and fewer when prices are high.
A hypothetical investor contributing $500 monthly with 10% average annual returns would accumulate approximately $1,130,000 over 30 years. The same investor contributing $500 monthly but pausing during market downturns would accumulate significantly less.
The dollar-cost averaging calculator helps investors model the long-term impact of systematic contribution strategies.
Step 4: Minimize Costs and Maximize Tax Efficiency
Small cost differences compound into large wealth differences over time.
Cost minimization:
- Choose funds with expense ratios below 0.10%
- Avoid load fees and transaction fees
- Use commission-free trading platforms for ETF purchases
Tax efficiency:
- Maximize contributions to tax-advantaged accounts (401k, IRA, HSA)
- Hold S&P 500 index funds in taxable accounts only after maximizing tax-advantaged space
- Avoid frequent trading that generates short-term capital gains
A 0.50% expense ratio difference on a $100,000 portfolio costs $500 annually. Over 30 years with compound growth, this difference exceeds $100,000 in lost wealth.
Step 5: Monitor and Rebalance Periodically
While S&P 500 investing is largely passive, periodic monitoring ensures the strategy remains aligned with goals.
Quarterly review:
- Verify dividend reinvestment is functioning correctly
- Confirm automatic contributions are processing
- Check that total portfolio allocation remains within targets
Annual rebalancing:
- Calculate current asset allocation (stocks vs. bonds vs. other)
- Compare to the target allocation
- Sell overweight positions and buy underweight positions to restore targets
This disciplined approach maintains appropriate risk exposure and forces “buy low, sell high” behavior.
Step 6: Stay the Course Through Volatility
The most important step is psychological: maintaining discipline during market downturns.
The S&P 500 will experience corrections (10%+ declines), bear markets (20%+ declines), and crashes (30%+ declines). These events are inevitable, not aberrations.
During downturns:
- Continue automatic contributions (buying shares at lower prices)
- Resist the urge to sell
- Remember that every historical decline has been temporary
- View volatility as an opportunity, not a threat
Investors who sold during the 2020 pandemic crash missed the subsequent recovery. Those who maintained contributions bought shares at temporarily depressed prices and benefited from the strong 2020-2024 returns.
Takeaway: Capturing S&P 500 total returns requires selecting low-cost funds, enabling automatic dividend reinvestment, implementing systematic contributions, minimizing costs and taxes, and maintaining discipline through market cycles. These practical steps transform market returns into personal wealth.
Conclusion
The S&P 500 Total Return in 2024 of 25.02% demonstrates the wealth-building power of diversified, low-cost equity investing. This exceptional performance, combined with historical context spanning nearly a century, provides clear evidence for the effectiveness of patient, disciplined investing strategies.
Several key principles emerge from this analysis:
Total return matters more than price return. Dividends contribute substantially to long-term wealth, and reinvestment accelerates compound growth. Investors who track only price movements miss a significant portion of their actual returns.
Historical averages provide realistic expectations. While 2024’s 25.02% return exceeded long-term averages, prudent planning assumes 7-10% real returns over multi-decade periods. Exceptional years should motivate continued discipline, not unrealistic future expectations.
Consistency beats timing. Systematic contributions through all market conditions, automatic dividend reinvestment, and periodic rebalancing create wealth more reliably than attempts to predict short-term market movements.
Costs compound like returns. Minimizing expense ratios, avoiding unnecessary trading, and maximizing tax-advantaged accounts preserve more wealth for compound growth over decades.
Discipline separates success from failure. The S&P 500’s century-long track record rewards investors who maintain positions through volatility, not those who exit during downturns.
Next Steps
For investors ready to capture S&P 500 total returns:
- Open or review your investment accounts. Ensure you have access to low-cost S&P 500 index funds or ETFs.
- Enable automatic dividend reinvestment. Verify that dividends purchase additional shares rather than accumulating as cash.
- Establish systematic contributions. Set up monthly automatic investments that continue regardless of market conditions.
- Calculate your target allocation. Determine appropriate S&P 500 exposure based on age, goals, and risk tolerance.
- Implement and maintain. Execute your plan, then resist the urge to make changes based on short-term market movements.
- Review annually. Check that your strategy remains aligned with goals and rebalance if allocations drift significantly from targets.
The math behind money is clear: consistent contributions to low-cost, diversified index funds, with automatic dividend reinvestment and disciplined rebalancing, build substantial wealth over time. The S&P 500 Total Return in 2024 provides one more data point in a century of evidence supporting this approach.
Wealth building doesn’t require prediction, perfect timing, or complex strategies. It requires understanding the principles, implementing them consistently, and maintaining discipline through market cycles. The evidence is overwhelming. The choice is yours.
For investors seeking to understand how different investment strategies compare, exploring resources on the best ETFs to buy and the best stocks to invest in 2025 provides additional context for portfolio construction decisions.
📈 S&P 500 Total Return Calculator
Calculate your investment growth with price appreciation and reinvested dividends
References
[1] S&P Dow Jones Indices. “S&P 500 Total Return Index Historical Data.” S&P Global, 2025.
[2] Federal Reserve Economic Data (FRED). “S&P 500 Total Return Index Performance Metrics.” Federal Reserve Bank of St. Louis, 2025.
[3] Morningstar. “S&P 500 Index Annual Returns and Performance Analysis.” Morningstar Investment Research, 2025.
[4] CFA Institute. “Understanding Total Return Calculations and Investment Performance Measurement.” CFA Institute Research Foundation, 2024.
[5] Investopedia. “Total Return vs. Price Return: A Comprehensive Guide.” Investopedia Financial Education, 2025.
[6] Vanguard Group. “Historical Returns and Long-Term Investment Performance.” Vanguard Research, 2025.
[7] Securities and Exchange Commission. “Investor Bulletin: Index Funds and Total Return Metrics.” SEC Office of Investor Education, 2024.
Author Bio
Max Fonji is the founder of The Rich Guy Math, a data-driven financial education platform dedicated to teaching the mathematical principles behind wealth building. With expertise in quantitative analysis and evidence-based investing strategies, Max translates complex financial concepts into actionable insights for investors at all levels. His approach emphasizes understanding cause-and-effect relationships in finance, using historical data and proven frameworks to build financial literacy and confidence.
Educational Disclaimer
This article is provided for educational and informational purposes only and does not constitute financial, investment, tax, or legal advice. The S&P 500 Total Return data and analysis presented are based on historical information and do not guarantee future results. Past performance does not predict future returns. All investments carry risk, including potential loss of principal.
Readers should conduct their own research and consult with qualified financial, tax, and legal professionals before making investment decisions. Individual circumstances vary, and strategies appropriate for one investor may not suit another. The Rich Guy Math and its authors do not provide personalized investment advice or recommendations.
Market conditions, economic factors, and individual company performance can change rapidly and unpredictably. The information presented reflects conditions as of the publication date and may become outdated. Readers are responsible for verifying current information and ass
Frequently Asked Questions
What is the difference between S&P 500 price return and total return?
Price return measures only changes in the index’s price level, while total return includes both price changes and reinvested dividends. In 2024, the S&P 500’s price return was approximately 23%, but the total return was 25.02% because dividends contributed an additional 2 percentage points. Total return provides a more accurate measure of actual investor returns because it captures all sources of gain. Investors who track only price movements systematically underestimate their actual performance and miss the significant long-term contribution of dividend reinvestment to wealth accumulation.
Can I expect 25% returns from the S&P 500 every year?
No. The 25.02% total return in 2024 exceeded the historical average of 10.38% annually since 1926. Annual returns vary significantly, ranging from losses exceeding 30% in severe bear markets to gains exceeding 30% in exceptional years. While the S&P 500 has delivered positive returns in approximately 78% of years since 1993, the magnitude varies widely. Prudent financial planning should assume returns closer to historical averages (7-10% after inflation) rather than exceptional years like 2024. Using realistic return assumptions prevents disappointment and ensures adequate savings rates for long-term goals.
How do I invest in the S&P 500 to capture total returns?
Invest in low-cost S&P 500 index funds or ETFs through a brokerage account, 401(k), or IRA. Popular options include Vanguard’s VFIAX or VOO, Fidelity’s FXAIX, and Schwab’s SWPPX, all with expense ratios below 0.05%. Enable automatic dividend reinvestment in your account settings to ensure dividends purchase additional shares rather than sitting as cash. Set up systematic monthly contributions to implement dollar-cost averaging. This combination of low-cost index funds, automatic dividend reinvestment, and consistent contributions captures the full total return of the S&P 500 with minimal effort and maximum tax efficiency.
What role should the S&P 500 play in my portfolio?
The S&P 500 typically serves as the core equity holding in diversified portfolios, with allocation depending on age, risk tolerance, and financial goals. Younger investors with long time horizons might allocate 70-90% to stocks, with the S&P 500 representing 60-80% of total portfolio value. Investors approaching retirement might reduce equity exposure to 40-60%, with the S&P 500 representing 30-50% of the portfolio. The remaining allocation typically includes bonds, international stocks, and other asset classes. The specific allocation should reflect individual circumstances and risk capacity, not recent performance. Maintaining strategic allocation through rebalancing prevents excessive concentration in any single asset class.
How does inflation affect S&P 500 total returns?
Inflation erodes the purchasing power of investment returns. The S&P 500’s nominal total return of 25.02% in 2024 translated to approximately 22-23% in real (inflation-adjusted) terms, assuming 2-3% inflation. Over the long term since 1926, the S&P 500’s nominal return of 10.38% becomes approximately 7.20% after inflation adjustment. This real return represents actual purchasing power growth. During high-inflation periods, the gap between nominal and real returns widens significantly, making inflation-adjusted returns the more meaningful measure for retirement planning and long-term wealth goals. Investors should focus on real returns when evaluating whether their portfolios are building actual purchasing power.
Is now a good time to invest in the S&P 500 after strong 2024 returns?
Time in the market consistently outperforms timing the market. While the S&P 500’s strong 2024 performance might suggest near-term mean reversion, historical evidence shows that attempting to time market entries reduces long-term returns. The best approach is implementing a systematic investment plan with regular contributions regardless of recent performance. Dollar-cost averaging through monthly contributions purchases shares at various price points, averaging out entry costs over time. Investors with lump sums to invest can consider deploying capital gradually over 6-12 months to reduce timing risk. The most important factor is starting—investors who wait for “perfect” entry points often remain on the sidelines while missing years of compound growth.