The average millionaire has seven different income streams. Not seven jobs, seven distinct sources of money flowing into their financial ecosystem. This isn’t a coincidence or luck; it’s the math behind money working exactly as designed.
Understanding types of income represents one of the most fundamental shifts in financial literacy. Most people spend decades focused on a single income source, their paycheck, while wealth builders construct diversified income portfolios that generate cash flow from multiple directions simultaneously.
This guide breaks down the mathematics, tax treatment, and strategic implementation of every major income category. The goal: transform how you think about earning, investing, and building lasting wealth through evidence-based insights and data-driven decision-making.
Key Takeaways
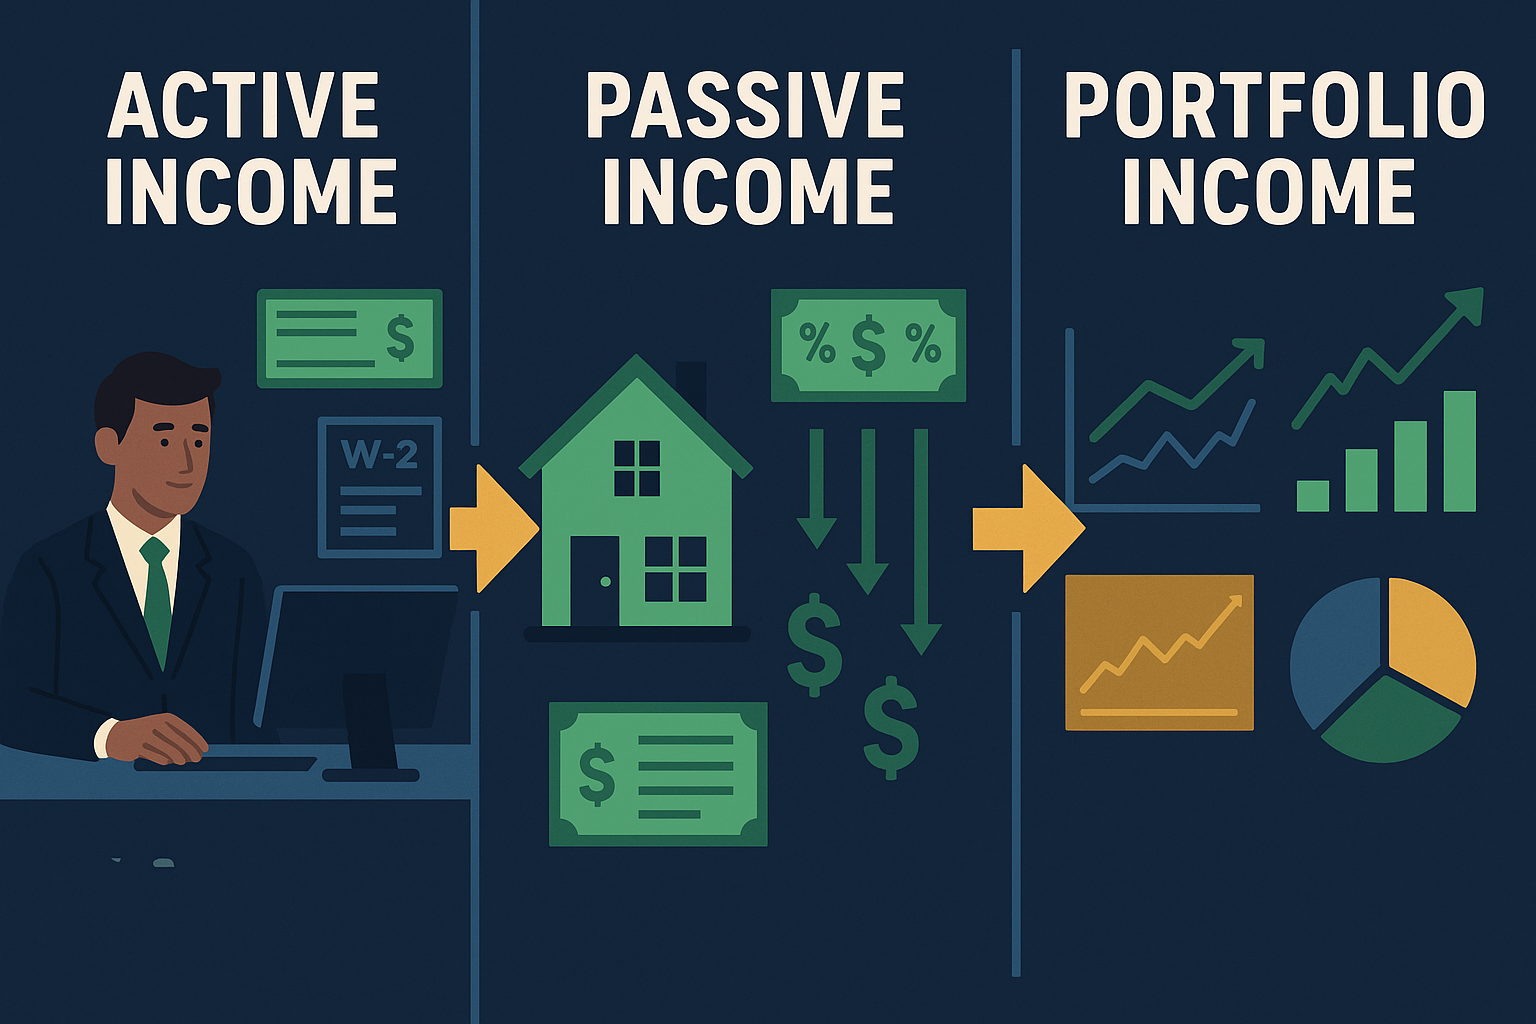
- Three primary income categories exist: earned income (active work), passive income (automated systems), and portfolio income (investment gains).
- Tax treatment varies dramatically between income types, with passive and portfolio income often receiving preferential rates compared to earned income.
- Wealth building accelerates when multiple income streams compound simultaneously, creating financial resilience and growth.
- Each income type requires different inputs: time and labor for earned income, upfront capital or effort for passive income, and invested assets for portfolio income.
- Strategic diversification across income types reduces risk while maximizing after-tax returns and long-term wealth accumulation.
The Three Fundamental Types of Income
Income classification isn’t arbitrary; it’s defined by the IRS and carries significant implications for taxation, wealth building, and financial strategy. Understanding these distinctions enables smarter decisions about where to invest time, energy, and capital.
Earned Income (Active Income)
Earned income represents compensation received in exchange for active work or services. This includes salaries, wages, tips, bonuses, commissions, and self-employment income. The defining characteristic: you trade time and effort directly for money.
The mathematics are straightforward. If you earn $50 per hour and work 40 hours weekly, your earned income equals $2,000 per week ($104,000 annually). The relationship is linear; more hours worked equals more income received, until you hit the ceiling of available time.
Tax treatment: Earned income faces the highest tax burden. Federal income tax rates range from 10% to 37% in 2025, plus Social Security (6.2%) and Medicare (1.45%) taxes. High earners also pay the additional 0.9% Medicare surtax on income exceeding $200,000 (single) or $250,000 (married filing jointly).
For someone earning $100,000 annually, the effective tax rate typically ranges from 18% to 24% after deductions, meaning $18,000 to $24,000 goes to federal taxes alone, before state and local taxes.
Advantages:
- Predictable and immediate compensation
- Employer benefits (health insurance, retirement matching)
- Skill development and career advancement potential
- No capital requirements to start
Limitations:
- Time-bound ceiling on earnings
- Highest tax rates applied
- Income stops when work stops
- Limited scalability beyond personal capacity
Learn more about active income and how it differs from passive income streams.
Passive Income
Passive income generates earnings with minimal ongoing effort after initial setup. According to IRS definitions, passive income includes rental property income, limited partnership distributions, and business activities where you don’t materially participate [1].
The critical distinction: passive income requires upfront work or capital investment but continues generating returns without proportional ongoing time investment. A rental property demands initial research, purchase, and setup, but then produces monthly rent with limited additional effort (though “passive” is somewhat misleading for real estate).
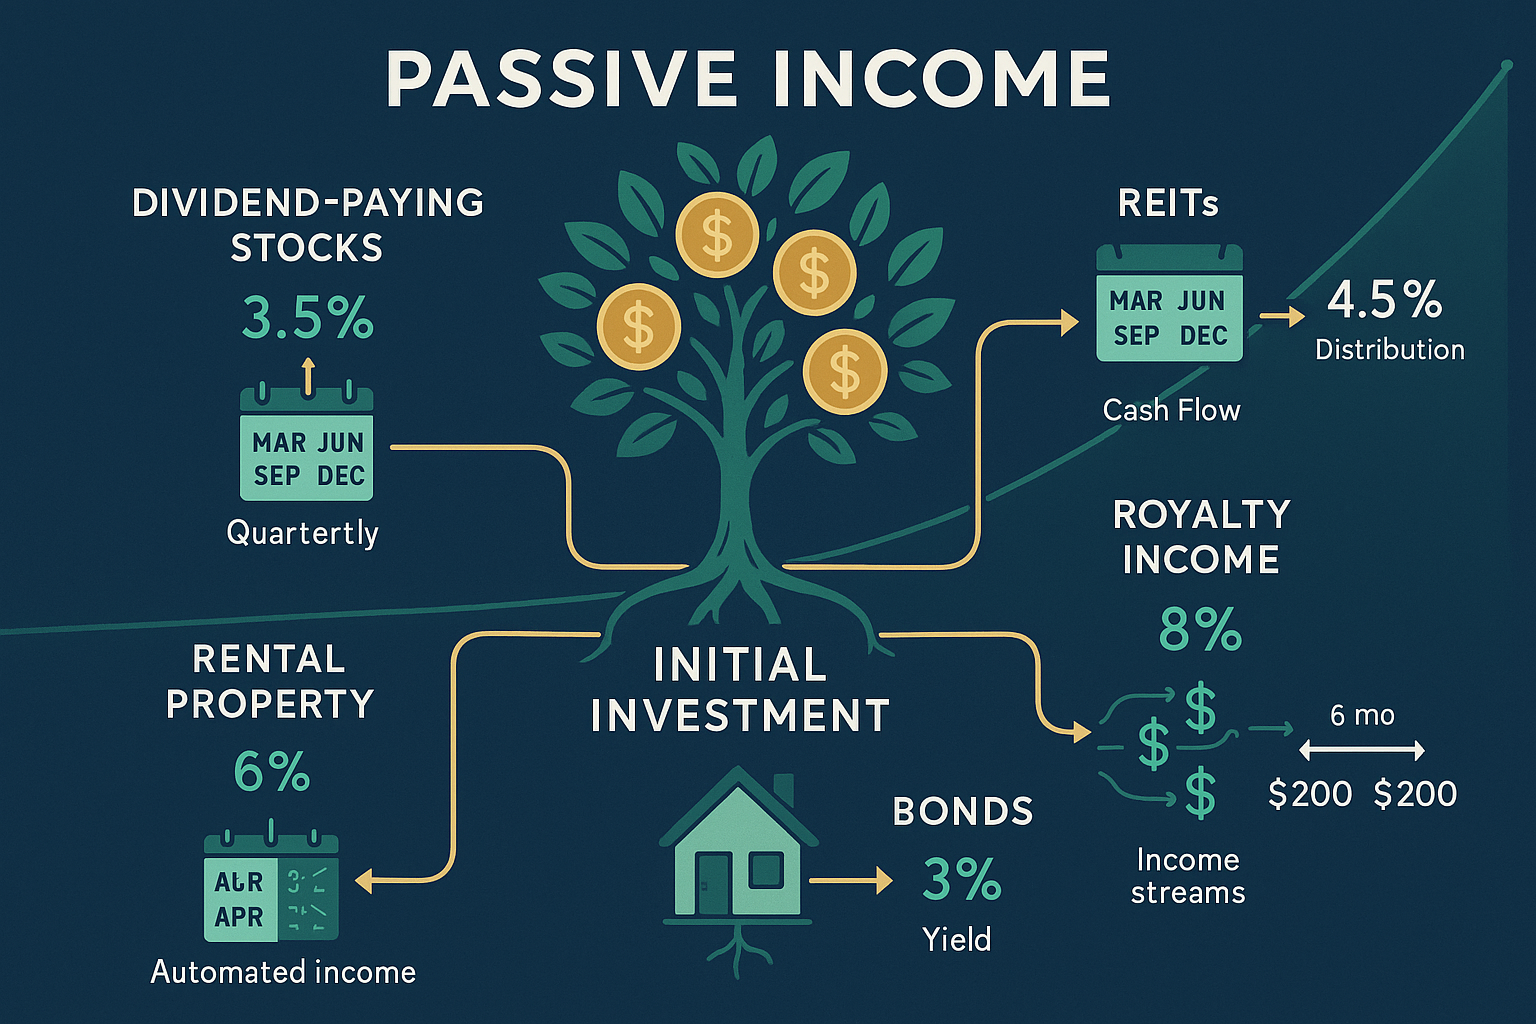
Common passive income sources:
- Rental real estate income
- Dividend payments from stocks
- Interest from bonds and savings accounts
- Royalties from intellectual property
- Business income where you’re not actively involved
- Peer-to-peer lending returns
The mathematics of passive income:
A $200,000 rental property with 20% down ($40,000) generating $1,500 monthly rent minus $800 in expenses produces $700 monthly passive income, or $8,400 annually. That represents a 21% cash-on-cash return on your $40,000 investment, significantly higher than most earned income returns on invested capital.
Tax advantages:
Passive income often receives preferential tax treatment. Qualified dividends and long-term capital gains face maximum rates of 0%, 15%, or 20%, substantially lower than earned income rates. Rental income offers depreciation deductions that can offset taxable income, sometimes resulting in tax-free cash flow.
However, passive losses generally only offset passive income, not earned income, a limitation designed to prevent tax shelter abuse.
Building passive income streams:
The path to meaningful passive income follows a predictable pattern:
- Capital accumulation through earned income and disciplined saving
- Strategic deployment into income-generating assets
- Reinvestment of returns to compound growth
- Scale through additional capital allocation
A disciplined investor following the 50/30/20 budgeting rule and investing 20% of a $75,000 salary ($15,000 annually) into dividend-paying stocks yielding 3% generates $450 in year one. After 10 years of consistent investment with dividend reinvestment and 7% annual growth, that portfolio could generate $3,000+ in annual passive income.
Portfolio Income
Portfolio income derives from the sale of investment assets, stocks, bonds, mutual funds, and other securities. This category includes capital gains, interest from non-business investments, and dividends (which straddle the line between passive and portfolio income).
The distinction matters for tax purposes and loss limitations. Unlike passive income, portfolio income can’t be offset by passive losses, and vice versa.
Capital gains: short-term vs. long-term
The holding period determines tax treatment:
- Short-term capital gains (assets held ≤ 1 year): Taxed as ordinary income at rates up to 37%
- Long-term capital gains (assets held > 1 year): Taxed at preferential rates of 0%, 15%, or 20%
This creates a powerful incentive for long-term investing. Consider an investor in the 32% tax bracket who purchases stock for $10,000 and sells at $15,000:
- Short-term gain (< 1 year): $5,000 profit × 32% = $1,600 in taxes, $3,400 net gain
- Long-term gain (> 1 year): $5,000 profit × 15% = $750 in taxes, $4,250 net gain
The difference: $850 (25% more after-tax profit) simply by holding an additional few months. This is the math behind money working in your favor through strategic tax planning.
Dividend income classification
Dividends fall into two categories:
- Qualified dividends: Taxed at long-term capital gains rates (0%, 15%, or 20%)
- Ordinary dividends: Taxed as ordinary income (up to 37%)
To qualify for preferential rates, dividends must come from U.S. corporations or qualified foreign corporations, and you must hold the stock for more than 60 days during the 121 days beginning 60 days before the ex-dividend date.
Understanding dividend investing strategies and selecting the best dividend ETFs can significantly impact after-tax returns.
Interest income
Interest from savings accounts, CDs, and bonds typically counts as portfolio income taxed at ordinary income rates. However, municipal bond interest enjoys federal tax exemption, and often state tax exemption if you purchase bonds from your state of residence.
For a high earner in the 35% federal bracket and 8% state bracket, a municipal bond yielding 3% tax-free provides an equivalent taxable yield of 5.26%:
Tax-equivalent yield = Tax-free yield ÷ (1 – Tax rate)
3% ÷ (1 – 0.43) = 5.26%
This mathematics explains why municipal bonds attract high-income investors despite lower nominal yields.
Breaking Down Earned Income Types
While earned income represents the highest-taxed category, it remains the foundation for most wealth-building journeys. Understanding the subcategories enables strategic optimization.
W-2 Wage and Salary Income
Traditional employment income arrives with automatic tax withholding, employer-provided benefits, and regulatory protections. Employers withhold federal income tax, Social Security, Medicare, and often state/local taxes before you receive payment.
Optimization strategies:
- Maximize retirement contributions: 401(k) contributions reduce taxable income. In 2025, you can contribute up to $23,000 ($30,500 if age 50+), potentially saving $7,360 in taxes at the 32% bracket
- Leverage employer matching: Free money that compounds tax-deferred, typically a 50-100% return on contributions up to match limits
- Use FSA and HSA accounts: Pre-tax contributions for healthcare and dependent care expenses
- Negotiate total compensation: Focus on tax-advantaged benefits (retirement matching, HSA contributions) alongside base salary
The earned income guide provides a deeper analysis of optimization tactics.
Self-Employment and Business Income
Self-employment income includes freelancing, consulting, sole proprietorship, and single-member LLC income. Unlike W-2 income, you pay both employer and employee portions of Social Security and Medicare taxes (15.3% combined on net earnings).
However, self-employment unlocks powerful deductions:
- Home office deduction (if qualified)
- Business equipment and supplies
- Professional development and education
- Health insurance premiums
- Retirement contributions (SEP-IRA, Solo 401(k))
- Vehicle expenses (actual or mileage method)
The mathematics of self-employment taxes:
Gross income: $100,000
Business expenses: $25,000
Net self-employment income: $75,000
Self-employment tax: $75,000 × 92.35% × 15.3% = $10,597
Income tax (24% bracket): $75,000 – $5,299 (½ SE tax deduction) = $69,701 × 24% = $16,728
Total tax: $27,325
Compare this to W-2 income of $75,000 with $18,000 in taxes (24% effective rate). The self-employment tax adds a burden, but deductions and retirement contribution flexibility can offset this significantly.
Commission and Bonus Income
Variable compensation creates planning challenges but offers upside potential. Commissions and bonuses face the same tax treatment as regular wages, but withholding often uses the supplemental wage rate of 22% (or 37% if supplemental wages exceed $1 million annually).
Strategic considerations:
- Anticipate tax liability if withholding is insufficient
- Time large bonuses across tax years when possible
- Maximize retirement contributions in high-income years
- Consider estimated tax payments to avoid underpayment penalties
Tips and Gratuities
Tip income must be reported and is fully taxable as earned income. Employees receiving $20+ in monthly tips must report to employers for proper withholding. Cash tips create reporting challenges, but failure to report constitutes tax evasion with significant penalties.
Passive Income Streams: Building Automated Wealth
Passive income represents the transition from trading time for money to building systems that generate returns with minimal ongoing effort. While “passive” often oversells the reality, most passive income requires substantial upfront work, the long-term benefits justify the initial investment.
Dividend Income from Stocks
Dividend stocks combine the characteristics of bonds (regular cash payments) with the growth potential of equities. Established, profitable companies distribute portions of earnings to shareholders quarterly, creating predictable income streams.
The mathematics of dividend investing:
A $100,000 portfolio of dividend stocks yielding 3.5% annually generates $3,500 in dividend income. With dividend reinvestment and 7% total annual returns (3.5% dividends + 3.5% growth), that portfolio grows to $196,715 after 10 years, producing $6,885 in annual dividend income, without additional contributions.
Dividend growth amplifies returns:
Companies that consistently increase dividends (dividend aristocrats) provide inflation protection and accelerated income. A stock yielding 3% today that grows dividends 7% annually yields 5.9% on original cost basis after 10 years.
Initial investment: $10,000
Initial yield: 3% ($300 annually)
Dividend growth rate: 7% annually
Year 10 yield on cost: 5.9% ($590 annually)
Total return: Price appreciation + growing dividend stream
Explore dividend growth stocks and dividend aristocrats for companies with proven dividend growth records.
Tax efficiency:
Qualified dividends receive preferential tax treatment (0%, 15%, or 20% rates). For investors in the 24% ordinary income bracket, qualified dividends save 9% in taxes compared to interest income or non-qualified dividends.
Building a dividend portfolio:
- Diversify across sectors to reduce concentration risk
- Focus on dividend sustainability (payout ratios below 60-70%)
- Prioritize dividend growth over current yield
- Reinvest dividends during the accumulation phase
- Consider dividend ETFs for instant diversification
The best monthly dividend stocks and ETFs guide provides specific recommendations for income-focused investors.
Rental Real Estate Income
Rental properties generate monthly cash flow from tenant rent payments. While often categorized as passive income, real estate demands active management—property maintenance, tenant screening, rent collection, and regulatory compliance.
The rental property income equation:
Net Operating Income (NOI) = Gross Rental Income – Operating Expenses
Operating expenses include:
- Property taxes
- Insurance
- Maintenance and repairs
- Property management fees
- Utilities (if landlord-paid)
- HOA fees
- Vacancy reserves
Cash flow = NOI – Debt Service
Example calculation:
Purchase price: $300,000
Down payment (25%): $75,000
Loan amount: $225,000 at 7% for 30 years
Monthly payment: $1,497
Monthly rent: $2,400
Operating expenses: $800
NOI: $1,600
Debt service: $1,497
Monthly cash flow: $103
Annual cash flow: $1,236
Cash-on-cash return: $1,236 ÷ $75,000 = 1.65%
This modest cash flow doesn’t capture the complete picture. Rental properties provide four distinct return sources:
- Cash flow (rental income minus expenses)
- Appreciation (property value increase)
- Loan paydown (tenant payments reduce mortgage principal)
- Tax benefits (depreciation deductions)
Tax advantages of rental real estate:
Depreciation allows you to deduct the property’s cost (excluding land) over 27.5 years for residential properties. A $300,000 property with $60,000 land value provides $8,727 annual depreciation deduction ($240,000 ÷ 27.5).
This creates a scenario where positive cash flow generates minimal or zero taxable income—or even paper losses that offset other passive income.
Challenges and considerations:
- Illiquidity (selling takes months)
- Property management demands
- Vacancy risk
- Maintenance surprises
- Tenant issues
- Market cycle exposure
REITs as an alternative:
Real Estate Investment Trusts provide real estate exposure without direct property management. REITs must distribute 90% of taxable income to shareholders, creating high dividend yields (often 3%-5%+). However, REIT dividends typically don’t qualify for preferential tax rates.
Review the best REITs to invest in for professionally managed real estate exposure.
Interest Income from Bonds and Fixed-Income Securities
Fixed-income investments provide predictable interest payments in exchange for lending capital. The risk-return spectrum ranges from ultra-safe Treasury securities to higher-yielding (and riskier) corporate bonds.
Types of bonds:
| Bond Type | Issuer | Risk Level | Tax Treatment | Typical Yield (2025) |
|---|---|---|---|---|
| Treasury Bills/Notes/Bonds | U.S. Government | Lowest | Federally taxable, state/local exempt | 4.0-5.0% |
| Municipal Bonds | State/Local Governments | Low-Medium | Federally tax-exempt, possibly state exempt | 3.0-4.5% |
| Investment-Grade Corporate | Corporations (BBB+ or higher) | Medium | Fully taxable | 5.0-6.5% |
| High-Yield Corporate | Corporations (Below BBB+) | Higher | Fully taxable | 7.0-10.0%+ |
| I Bonds | U.S. Government | Lowest | Federally taxable (deferred), state/local exempt | Variable with inflation |
Bond mathematics:
A $10,000 corporate bond with 6% coupon pays $600 annually (typically $300 semi-annually). At maturity, you receive your $10,000 principal plus final interest payment.
Yield to maturity (YTM) accounts for purchase price, coupon payments, and time to maturity. A bond purchased at $9,500 (discount) with 6% coupon and 5 years to maturity has a higher YTM than 6% because you receive $10,000 at maturity—a $500 gain plus interest.
Interest rate risk:
Bond prices move inversely to interest rates. When rates rise, existing bonds with lower coupons decrease in value. A 10-year bond with 4% coupon loses approximately 8-9% in value if rates increase by 1%.
Duration measures interest rate sensitivity. Higher duration means greater price volatility when rates change.
Strategic bond allocation:
- Short-term bonds (1-3 years): Lower yields, minimal interest rate risk
- Intermediate bonds (3-10 years): Moderate yields and risk
- Long-term bonds (10+ years): Higher yields, substantial interest rate risk
Bonds provide portfolio stability and income, particularly valuable for retirees or conservative investors. However, current yields must exceed inflation to preserve purchasing power—a challenge during low-rate environments.
High-Yield Savings Accounts and CDs
High-yield savings accounts and certificates of deposit offer the safest passive income with FDIC insurance (up to $250,000 per depositor, per institution). Online banks typically offer substantially higher rates than traditional banks—often 4.0-5.0% in 2025 compared to 0.01-0.5% at brick-and-mortar institutions.
The mathematics:
$50,000 in high-yield savings at 4.5% APY generates $2,250 annually in interest—completely passive after initial deposit. However, this interest faces ordinary income tax rates.
After-tax return:
$2,250 interest income
Tax (24% bracket): $540
Net return: $1,710 (3.42% after-tax)
Certificates of Deposit offer higher rates in exchange for locking funds for specific terms (3 months to 5 years). Early withdrawal triggers penalties, reducing liquidity.
CD laddering strategy:
Divide capital across multiple CDs with staggered maturity dates:
- $10,000 in a 1-year CD at 4.5%
- $10,000 in a 2-year CD at 4.8%
- $10,000 in a 3-year CD at 5.0%
- $10,000 in a 4-year CD at 5.1%
- $10,000 in a 5-year CD at 5.2%
Each year, reinvest maturing CDs into new 5-year CDs at current rates. This provides regular liquidity while capturing higher long-term rates.
Discover the best compound interest accounts for maximizing safe returns.
Royalties and Licensing Income
Royalty income derives from intellectual property, books, music, patents, trademarks, or mineral rights. After creating the asset, royalties provide ongoing income with minimal additional effort.
Types of royalties:
- Book royalties: 10-15% of retail price for traditional publishing, 35-70% for self-publishing
- Music royalties: Performance, mechanical, and synchronization rights
- Patent royalties: Licensing fees for invention usage
- Trademark royalties: Brand licensing agreements
- Mineral royalties: Oil, gas, or mineral extraction payments
The mathematics of book royalties:
A book priced at $20 with a 12% royalty rate generates $2.40 per sale. Selling 5,000 copies annually produces $12,000 in royalty income. If the book remains relevant for 10 years, total royalties reach $120,000 from a one-time creative effort.
Tax treatment:
Royalties are typically taxed as ordinary income. However, if you’re not a professional author/creator, they may qualify as passive income. Professional creators pay self-employment tax on royalty income.
Building royalty income:
- Create valuable intellectual property (requires upfront time/capital)
- Protect rights through copyright, patent, or trademark registration
- Market and distribute effectively
- License strategically to maximize reach and revenue
- Maintain relevance through updates and promotion
Peer-to-Peer Lending and Crowdfunding Returns
Peer-to-peer (P2P) lending platforms connect borrowers with individual lenders, generating interest income from personal or business loans. Returns typically range from 4-10% depending on borrower creditworthiness and loan terms.
Risk considerations:
- Default risk (borrower non-payment)
- Platform risk (platform failure or fraud)
- Illiquidity (difficult to exit before loan maturity)
- No FDIC insurance
Diversification essential:
Spreading $10,000 across 200 loans of $50 each reduces individual default impact. If 5% default completely, you lose $250—but remaining loans generating 8% return produce $800, netting $550 (5.5% return).
Real estate crowdfunding offers equity or debt investments in commercial properties, typically requiring accredited investor status ($200,000+ annual income or $1 million+ net worth excluding primary residence).
Returns vary widely (6-15%+) based on project type, risk profile, and investment structure. Illiquidity remains a significant consideration, most investments lock capital for 3-7 years.
Portfolio Income and Investment Gains
Portfolio income derives from buying and selling investment assets. Strategic management of capital gains, losses, and dividend income significantly impacts after-tax wealth accumulation.
Capital Gains: Short-Term vs. Long-Term
The holding period determines tax treatment and dramatically affects net returns.
2025 Long-Term Capital Gains Tax Rates:
| Filing Status | 0% Rate | 15% Rate | 20% Rate |
|---|---|---|---|
| Single | Up to $47,025 | $47,026 – $518,900 | Over $518,900 |
| Married Filing Jointly | Up to $94,050 | $94,051 – $583,750 | Over $583,750 |
| Head of Household | Up to $63,000 | $63,001 – $551,350 | Over $551,350 |
Strategic implications:
An investor with $80,000 taxable income (married filing jointly) pays 0% on long-term capital gains up to $94,050. This creates an opportunity for tax-free portfolio rebalancing or partial profit-taking.
Tax-loss harvesting:
Selling losing investments to offset gains reduces tax liability. Capital losses offset capital gains dollar-for-dollar. Excess losses offset up to $3,000 of ordinary income annually, with remaining losses carried forward indefinitely.
Example:
Realized gains: $20,000
Realized losses: $8,000
Net capital gain: $12,000
Tax (15% rate): $1,800
Without harvesting losses, the tax would be $3,000, a $1,200 savings.
The capital gains tax guide provides comprehensive strategies for minimizing investment taxes.
Dividend Income Strategies
Beyond individual dividend stocks, dividend-focused ETFs provide instant diversification across dozens or hundreds of dividend-paying companies.
Popular dividend ETF strategies:
- High-yield focus: Maximize current income (3.5-5%+ yields)
- Dividend growth focus: Prioritize companies that increase dividends consistently
- Dividend aristocrats: Companies with 25+ years of consecutive dividend increases
- International dividends: Geographic diversification and foreign tax considerations
Dividend reinvestment compounds wealth:
$100,000 invested in dividend stocks yielding 3.5% with 7% total returns:
Without dividend reinvestment:
Year 10: $196,715 portfolio value + $35,000 dividends received = $231,715 total
With dividend reinvestment:
Year 10: $196,715 portfolio value (dividends automatically purchase additional shares)
The difference: Reinvesting dividends during the accumulation phase captures compound growth on dividend payments themselves.
Explore ETFs vs individual stocks for guidance on building diversified portfolios.
Interest and Fixed-Income Returns
Fixed-income portfolio allocation depends on investment timeline, risk tolerance, and income needs.
The bond ladder strategy:
Purchasing bonds with staggered maturity dates provides:
- Regular liquidity as bonds mature
- Reduced interest rate risk compared to long-term bond concentration
- Opportunity to reinvest at prevailing rates
Total return perspective:
Bond returns include interest payments plus price appreciation/depreciation. During falling rate environments, bond prices rise, creating capital gains in addition to interest income.
Inflation-protected securities:
Treasury Inflation-Protected Securities (TIPS) adjust principal based on CPI changes, protecting purchasing power. I Bonds offer similar inflation protection with tax-deferred interest and state/local tax exemption.
Tax Implications Across Different Types of Income
Tax efficiency dramatically impacts wealth accumulation. Understanding how different income types are taxed enables strategic optimization.
Ordinary Income Tax Rates (2025)
| Tax Rate | Single | Married Filing Jointly | Head of Household |
|---|---|---|---|
| 10% | $0 – $11,600 | $0 – $23,200 | $0 – $16,550 |
| 12% | $11,601 – $47,150 | $23,201 – $94,300 | $16,551 – $63,100 |
| 22% | $47,151 – $100,525 | $94,301 – $201,050 | $63,101 – $100,500 |
| 24% | $100,526 – $191,950 | $201,051 – $383,900 | $100,501 – $191,950 |
| 32% | $191,951 – $243,725 | $383,901 – $487,450 | $191,951 – $243,700 |
| 35% | $243,726 – $609,350 | $487,451 – $731,200 | $243,701 – $609,350 |
| 37% | Over $609,350 | Over $731,200 | Over $609,350 |
Earned income, short-term capital gains, ordinary dividends, interest income, and non-qualified retirement distributions all face these rates.
Preferential Rates for Long-Term Capital Gains and Qualified Dividends
Maximum rates of 0%, 15%, or 20% create substantial tax savings for long-term investors.
Tax savings example:
$50,000 in investment income (married filing jointly, $150,000 total income):
If short-term capital gains (ordinary income):
Tax rate: 22%
Tax owed: $11,000
If long-term capital gains:
Tax rate: 15%
Tax owed: $7,500
Tax savings: $3,500 (31.8% reduction)
This mathematics demonstrates why buy-and-hold investing outperforms frequent trading for most investors—even before considering transaction costs.
Self-Employment Tax Considerations
Self-employed individuals pay both employer and employee portions of Social Security and Medicare taxes:
- Social Security: 12.4% on first $168,600 of net earnings (2025)
- Medicare: 2.9% on all net earnings
- Additional Medicare tax: 0.9% on earnings exceeding $200,000 (single) or $250,000 (married)
Total self-employment tax: 15.3% (on 92.35% of net earnings)
Mitigation strategies:
- Maximize business deductions to reduce net earnings
- Contribute to SEP-IRA or Solo 401(k) (reduces income tax, not SE tax)
- Consider S-corporation election for substantial income (requires reasonable salary)
Passive Activity Loss Limitations
Passive losses generally only offset passive income, not earned or portfolio income. This prevents high earners from using rental property losses to offset W-2 income.
Exception: Active real estate professionals (750+ hours annually in real estate activities and >50% of working time) can deduct rental losses against any income type.
$25,000 special allowance:
Taxpayers with modified adjusted gross income below $100,000 can deduct up to $25,000 in rental real estate losses against ordinary income if they actively participate (make management decisions, approve tenants, etc.). This allowance phases out between $100,000-$150,000 MAGI.
Tax-Advantaged Account Strategies
Retirement accounts provide powerful tax benefits:
Traditional 401(k)/IRA:
- Contributions reduce current taxable income
- Growth tax-deferred
- Withdrawals taxed as ordinary income
- Required Minimum Distributions (RMDs) begin at age 73
Roth 401(k)/IRA:
- Contributions with after-tax dollars
- Growth tax-free
- Qualified withdrawals are completely tax-free
- No RMDs for Roth IRAs
Health Savings Account (HSA):
- Triple tax advantage: deductible contributions, tax-free growth, tax-free withdrawals for qualified medical expenses
- Becomes an additional retirement account after age 65 (non-medical withdrawals taxed as ordinary income, no penalty)
2025 contribution limits:
- 401(k): $23,000 ($30,500 age 50+)
- IRA: $7,000 ($8,000 age 50+)
- HSA: $4,300 individual, $8,550 family ($1,000 additional age 55+)
Strategic use of these accounts can reduce current taxes by $5,000-$15,000+ annually while building tax-advantaged wealth.
Building Multiple Income Streams: A Strategic Framework
Wealth building accelerates when multiple income streams compound simultaneously. The framework: start with earned income, build passive and portfolio income, then scale systematically.
Phase 1: Maximize Earned Income (Years 1-3)
Primary focus: Increase earning power through skill development, career advancement, or business building.
Actions:
- Invest in high-ROI education and certifications
- Negotiate compensation aggressively
- Develop specialized, valuable skills
- Build a professional network
- Consider strategic job changes (typically 10-20% raises)
Simultaneously:
- Live below means using proven budgeting frameworks like the 50/30/20 rule
- Build emergency fund (3-6 months’ expenses)
- Eliminate high-interest debt
- Maximize employer retirement matching (100% immediate return)
Phase 2: Establish Portfolio Income Foundation (Years 2-5)
Primary focus: Build an investment portfolio generating dividend and capital gains income.
Actions:
- Contribute consistently to tax-advantaged accounts
- Implement dollar-cost averaging for systematic investing
- Build a diversified portfolio using low-cost index funds or ETFs
- Reinvest all dividends during the accumulation phase
- Maintain long-term perspective (minimize trading)
Target allocation example (age 30, moderate risk tolerance):
- 70% stock index funds/ETFs
- 20% bond funds
- 10% high-yield savings (emergency fund)
Phase 3: Add Passive Income Streams (Years 5-10)
Primary focus: Convert capital and expertise into automated income systems.
Options based on capital and interests:
Real estate path:
- Purchase rental property with a 20-25% down payment
- Use property management to minimize time commitment
- Leverage appreciation and cash flow
- Consider house hacking (live in one unit, rent others)
Digital asset path:
- Create online courses or educational content
- Build affiliate marketing systems
- Develop software or digital products
- License intellectual property
Business income path:
- Invest in or acquire existing businesses
- Develop systems and hire management
- Transition from active to passive role
- Scale through proven processes
Phase 4: Optimize and Scale (Years 10+)
Primary focus: Tax optimization, diversification, and accelerated growth.
Actions:
- Rebalance income sources for tax efficiency
- Harvest tax losses strategically
- Consider geographic arbitrage (lower cost of living areas)
- Reinvest passive income into additional income streams
- Build redundancy (multiple sources in each category)
Target state: 3-5 distinct income streams across earned, passive, and portfolio categories, each generating meaningful cash flow.
The Mathematics of Multiple Income Streams
Single income stream:
$100,000 earned income
Tax burden: ~$24,000
Net: $76,000
Diversified income streams:
$60,000 earned income (tax: ~$11,000)
$20,000 qualified dividends (tax: ~$3,000)
$15,000 rental income (tax: ~$2,250 after depreciation)
$5,000 municipal bond interest (tax: $0)
Total: $100,000 (tax: ~$16,250)
Net: $83,750
Tax savings: $7,750 annually (10.2% higher after-tax income) from identical gross income, purely through strategic income diversification.
Over 20 years with 6% compound growth, that $7,750 annual tax savings invested grows to $285,000+ in additional wealth.
Common Mistakes to Avoid When Building Income Diversity
Mistake 1: Chasing High Yields Without Understanding Risk
The error: Investing in 8-12% dividend yields without analyzing sustainability.
The reality: Unsustainable high yields often precede dividend cuts. When companies struggle, they reduce dividends, causing both income loss and share price decline.
The solution: Focus on dividend growth and payout ratios below 60-70%. A 3% yield growing 8% annually outperforms a static 6% yield within 9 years, and continues widening the gap thereafter.
Mistake 2: Underestimating Active Requirements of “Passive” Income
The error: Believing rental properties or online businesses run themselves.
The reality: Most passive income requires substantial upfront work and ongoing management. Rental properties demand tenant management, maintenance, and regulatory compliance. Online businesses need content updates, marketing, and customer support.
The solution: Accurately assess time commitments. Build systems and consider professional management. Calculate returns accounting for your time investment.
Mistake 3: Ignoring Tax Implications
The error: Making investment decisions without considering after-tax returns.
The reality: A 6% taxable bond yields less than a 4.5% municipal bond for high earners. Short-term trading generates 30-50% higher tax bills than buy-and-hold investing.
The solution: Calculate after-tax returns for all income sources. Use tax-advantaged accounts strategically. Consult tax professionals for complex situations.
Mistake 4: Insufficient Diversification
The error: Concentrating income sources in a single asset class, industry, or geographic region.
The reality: Correlated income streams fail simultaneously during downturns. The 2008 financial crisis devastated investors with concentrated real estate holdings. The 2020 pandemic crushed hospitality and retail income.
The solution: Diversify across:
- Income types (earned, passive, portfolio)
- Asset classes (stocks, bonds, real estate)
- Industries and sectors
- Geographic regions
- Time horizons
Mistake 5: Neglecting Earned Income Optimization
The error: Focusing exclusively on passive income while leaving earned income unoptimized.
The reality: A $10,000 salary increase provides more immediate impact than building passive income from zero. Earned income funds passive income investments.
The solution: Simultaneously optimize earned income (skills, negotiation, career moves) and build passive/portfolio income. The combination accelerates wealth building exponentially.
Mistake 6: Overleveraging for Income
The error: Using excessive debt to purchase income-producing assets, assuming income will cover payments.
The reality: Vacancy, market downturns, or income disruption can create negative cash flow. Forced sales during downturns lock in losses.
The solution: Maintain conservative debt ratios. Ensure positive cash flow with a margin for unexpected expenses. Build cash reserves covering 6-12 months of debt payments.
Measuring and Tracking Your Income Portfolio
What gets measured gets managed. Tracking income sources, returns, and tax efficiency enables data-driven optimization.
Key Metrics to Monitor
1. Total Income by Category
Track monthly and annual income across:
- Earned income (W-2, self-employment)
- Passive income (rental, royalties, business)
- Portfolio income (dividends, interest, capital gains)
Target: Increasing percentage from passive and portfolio sources over time.
2. After-Tax Return by Source
Calculate: (Income – Taxes) ÷ Capital Invested
This reveals true efficiency and enables comparison across income types with different tax treatments.
3. Income Diversification Ratio
Measure concentration: Largest income source ÷ Total income
Target: Below 60-70% from a single source for meaningful diversification.
4. Passive Income Replacement Ratio
Calculate: Annual passive income ÷ Annual expenses
This metric tracks progress toward financial independence. When the ratio exceeds 100%, passive income covers all expenses, work becomes optional.
Recommended Tracking Systems
Spreadsheet approach:
- Monthly income log by source and category
- Annual tax summary by income type
- Return on investment calculations
- Progress toward income goals
Financial software:
- Personal Capital (investment tracking, net worth)
- Quicken (comprehensive income/expense tracking)
- YNAB (budgeting and income allocation)
Professional support:
- CPA for tax optimization
- Financial advisor for investment strategy
- Bookkeeper for business income tracking
Annual Review Process
Q4 each year:
- Calculate total income by source and compare to the prior year
- Analyze after-tax returns for each income stream
- Review tax efficiency and identify optimization opportunities
- Assess diversification and identify concentration risks
- Project next year’s income based on the current trajectory
- Set specific goals for each income category
- Adjust strategy based on performance and changing circumstances
This systematic review ensures continuous improvement and strategic alignment.
💰 Income Types Calculator & Tax Analyzer
Calculate your total income, tax burden, and after-tax returns across different income types
📊 Income Breakdown
📈 Income Diversification
💡 Key Insights
Real-World Income Diversification Case Studies
Theory becomes actionable through concrete examples. These case studies demonstrate how real individuals built diversified income portfolios.
Case Study 1: The Corporate Professional’s Transition
Background: Sarah, 34, software engineer earning $120,000 annually
Starting point (Year 1):
- Earned income: $120,000
- Portfolio income: $0
- Passive income: $0
- Total: $120,000
Strategy implemented:
- Maximized 401(k) contributions ($23,000 annually)
- Invested 15% of after-tax income in dividend growth ETFs
- Developed an online course teaching coding fundamentals
- Purchased a duplex, living in one unit while renting the other
Results after 5 years:
- Earned income: $145,000 (career advancement)
- Dividend income: $4,200 (from $120,000 portfolio)
- Rental income: $18,000 net annually
- Course royalties: $12,000 annually
- Total: $179,200 (49% increase)
Key insight: Passive income grew from $0 to $34,200 (19% of total income), providing financial resilience and optionality. Sarah reduced work hours to 4 days weekly, maintaining quality of life while building wealth.
Case Study 2: The Small Business Owner’s Evolution
Background: Marcus, 42, owns a local marketing agency
Starting point:
- Business income: $180,000 (all active)
- Investment income: $2,500
- Total: $182,500
Challenge: Income is completely dependent on active client work; no income during vacation or illness.
Strategy implemented:
- Hired account managers, transitioning from practitioner to owner
- Systematized operations with documented processes
- Invested business profits into a dividend aristocrat portfolio
- Purchased commercial real estate, leasing to own business
- Developed productized service offerings requiring minimal customization
Results after 7 years:
- Business income (passive): $95,000 (managed by team)
- Consulting income (active): $60,000 (selective high-value clients)
- Dividend income: $22,000
- Commercial rental income: $48,000
- Total: $225,000 (23% increase with 60% less active work)
Key insight: Transitioning from self-employed to business owner created passive income from the business itself. Marcus now works 15-20 hours weekly on strategic initiatives rather than 60+ hours on client delivery.
Case Study 3: The Dual-Income Family’s Wealth Acceleration
Background: Jennifer and David, both 38, combined household income $165,000
Starting point:
- Combined W-2 income: $165,000
- Investment income: $1,800
- Total: $166,800
Strategy implemented:
- Lived on one income, invested the other entirely
- Purchased a rental property using an FHA loan with 3.5% down
- Implemented systematic dividend reinvestment in a taxable account
- Maximized both 401(k)s and Roth IRAs
- Used dollar-cost averaging for consistent monthly investing
Results after 10 years:
- Combined W-2 income: $195,000
- Dividend income: $18,500
- Rental income (3 properties): $42,000
- Total: $255,500 (53% increase)
- Investment portfolio value: $520,000
Key insight: Living below means and investing aggressively created multiple income streams. The family reached “Coast FI”; their existing investments will grow to fund retirement without additional contributions, making current income completely discretionary.
Conclusion: Your Roadmap to Income Diversification
Understanding types of income transforms financial strategy from linear (trading time for money) to exponential (building systems that generate returns). The mathematics are clear: diversified income streams reduce risk, optimize taxes, and accelerate wealth accumulation.
The evidence-based path forward:
Phase 1: Foundation (Months 1-12)
- Optimize earned income through skill development and negotiation
- Build a 3-6 month emergency fund in a high-yield savings account
- Maximize employer retirement matching (100% immediate return)
- Eliminate high-interest debt
- Establish a systematic investing habit
Phase 2: Portfolio Building (Years 1-5)
- Invest 15-25% of income consistently using dollar-cost averaging
- Build a diversified portfolio with index funds and dividend ETFs
- Target 10-20% of income from portfolio sources
- Study tax optimization strategies
- Track all income sources and after-tax returns
Phase 3: Passive Income Development (Years 3-10)
- Deploy capital into rental real estate or REITs
- Develop digital assets (courses, content, products)
- Build business systems enabling passive ownership
- Target 30-40% of income from passive and portfolio sources
- Implement tax-loss harvesting and strategic rebalancing
Phase 4: Optimization and Scale (Years 10+)
- Fine-tune asset allocation for tax efficiency
- Consider geographic arbitrage for lower living costs
- Reinvest passive income into additional streams
- Target 50%+ income from non-earned sources
- Plan transition to financial independence
The math behind money works predictably: consistent investment in income-generating assets, compounded over time, creates financial freedom. The journey requires patience, discipline, and strategic thinking—but the destination is worth every step.
Start today. Calculate your current income diversification ratio. Set specific targets for each income category. Take one action this week toward building your next income stream.
Wealth building isn’t magic—it’s mathematics, executed consistently over time.
Sources
Internal Revenue Service. (2025). “Passive Activity Loss ATG – Chapter 2, Passive Activity Loss Overview.” IRS.gov.
Internal Revenue Service. (2025). “Topic No. 404 Dividends.” IRS.gov.
Author Bio
Max Fonji is a data-driven financial educator and the voice behind The Rich Guy Math, where complex financial concepts are broken down through evidence-based analysis and clear mathematical frameworks. With expertise in investment analysis, tax optimization, and wealth-building strategies, Max helps readers understand the quantitative foundations of financial success. His approach combines rigorous data analysis with accessible teaching, empowering individuals to make informed financial decisions based on logic and evidence rather than emotion or speculation.
Educational Disclaimer
This article provides educational information about income types, tax considerations, and wealth-building strategies. It does not constitute personalized financial, investment, tax, or legal advice. Tax laws change frequently, and individual circumstances vary significantly—consult qualified tax professionals, financial advisors, and legal counsel before making financial decisions. Investment returns are not guaranteed, and all investments carry risk, including potential loss of principal. Historical performance does not guarantee future results. The strategies discussed may not be suitable for all investors. Always conduct thorough due diligence and consider your personal financial situation, risk tolerance, and investment objectives before implementing any financial strategy.
Frequently Asked Questions About Types of Income
What are the three main types of income?
The three primary income categories are earned income (wages, salaries, and self-employment compensation), passive income (rental properties, royalties, and limited partnership distributions), and portfolio income (dividends, interest, and capital gains from investments). Each category receives different tax treatment and requires different inputs—time and labor for earned income, upfront capital or effort for passive income, and invested assets for portfolio income.
Which type of income is taxed the least?
Long-term capital gains and qualified dividends typically face the lowest tax rates, with maximum federal rates of 0%, 15%, or 20% depending on income level—substantially lower than ordinary income rates reaching 37%. Municipal bond interest receives even more favorable treatment with complete federal tax exemption and potential state/local exemption. Strategic income diversification toward preferential tax treatment can reduce effective tax rates by 5–15 percentage points compared to earned income alone.
How much passive income do I need to retire?
You need passive income exceeding annual expenses to achieve financial independence. Using the 4% rule, a portfolio generating $40,000 annually in passive income supports $40,000 in annual spending indefinitely. To determine your number: calculate annual expenses, multiply by 25, and that’s your target portfolio value. For $60,000 annual expenses, you need $1.5 million in income-generating assets. However, combining multiple passive income streams (dividends, rental income, royalties) can reduce the required portfolio size.
Can passive income replace my salary?
Yes, but it requires substantial upfront investment of capital, time, or both. Most successful passive income builders spend 5–10 years systematically investing earned income into passive income-generating assets before achieving salary replacement. The mathematics: to replace a $75,000 salary with dividend income at 4% yield requires a $1.875 million portfolio. Combining rental income, dividends, and other passive sources reduces the capital requirement for any single source. Start by targeting 10–20% salary replacement, then scale systematically.
What’s the difference between passive and portfolio income?
Passive income derives from business activities where you don’t materially participate (rental properties, limited partnerships, royalties), while portfolio income comes from investment assets (stocks, bonds, mutual funds). The distinction matters for tax purposes—passive losses generally only offset passive income, not portfolio or earned income. However, qualified dividends and long-term capital gains (portfolio income) receive the same preferential tax rates. Both require less ongoing time than earned income but demand different initial investments.
How do I start building passive income with no money?
Start with earned income optimization—increase salary through skill development, negotiation, or career changes. Simultaneously, reduce expenses using frameworks like the 50/30/20 budgeting rule to create investment capital. With initial savings, invest in dividend-paying index funds through dollar-cost averaging. Alternatively, build digital passive income through content creation, affiliate marketing, or online courses—these require time investment rather than capital. The key: convert earned income into assets that generate passive returns.
Are dividends considered passive income or portfolio income?
Dividends occupy a unique position—they’re technically portfolio income for tax classification purposes, but function similarly to passive income in generating returns without active effort. Qualified dividends receive preferential tax treatment (0%, 15%, or 20% rates) like long-term capital gains. The IRS distinguishes between passive income (business activities) and portfolio income (investment securities), but both offer advantages over earned income. For wealth-building purposes, focus on after-tax returns rather than classification semantics.
What percentage of income should come from passive sources?
Target 30–50% passive income for meaningful financial resilience and flexibility. This diversification reduces dependence on earned income, provides stability during job transitions, and accelerates wealth building through tax-advantaged returns. Early career professionals (20s–30s) typically show 5–15% passive income, mid-career (40s) around 20–30%, and pre-retirees (50s–60s) targeting 50%+ as they transition toward financial independence. The specific percentage matters less than consistent progress toward diversification.
How are rental properties taxed differently from dividend income?
Rental properties offer unique tax advantages including depreciation deductions (1/27.5 of property value annually for residential), mortgage interest deductions, and operating expense write-offs. This often creates paper losses offsetting passive income despite positive cash flow. Dividend income receives preferential rates for qualified dividends but offers no depreciation benefits. However, dividends require zero management time, while rentals demand ongoing attention. Both qualify as passive income, but rental properties provide more tax optimization opportunities at the cost of increased complexity.
What’s the best type of income for building wealth?
Portfolio income from invested capital compounds most efficiently for long-term wealth building due to preferential tax treatment, minimal time requirements, and exponential growth potential. A diversified portfolio generating 8–10% annually through dividends and appreciation outpaces most earned income growth rates. However, earned income provides the capital to fund investments initially. The optimal strategy: maximize earned income early career, systematically convert to portfolio income through consistent investing, then add passive income streams for diversification and tax optimization. Wealth building accelerates when all three income types compound simultaneously.